Dynamic Modulation of Expression of
Lentiviral Restriction Factors in Primary
CD4
ⴙ
T Cells following Simian
Immunodeficiency Virus Infection
Andrew R. Rahmberg,a,b,cPremeela A. Rajakumar,b,cJames M. Billingsley,b,c R. Paul Johnsonb,c,d
Virology Program, Harvard University, Graduate School of Arts and Sciences, Division of Medical Science, Boston, Massachusetts, USAa; Yerkes National Primate Research Center, Atlanta, Georgia, USAb; New England Primate Research Center, Harvard Medical School, Southborough Campus, Southborough, Massachusetts, USAc; Division of Infectious Diseases, Department of Medicine, Emory University School of Medicine, Atlanta, Georgia, USAd
ABSTRACT Although multiple restriction factors have been shown to inhibit HIV/SIV
replication, little is known about their expressionin vivo. Expression of 45 confirmed
and putative HIV/SIV restriction factors was analyzed in CD4⫹T cells from peripheral
blood and the jejunum in rhesus macaques, revealing distinct expression patterns in naive and memory subsets. In both peripheral blood and the jejunum, memory
CD4⫹T cells expressed higher levels of multiple restriction factors compared to
na-ive cells. However, relatna-ive to their expression in peripheral blood CD4⫹T cells,
jeju-nal CCR5⫹ CD4⫹ T cells exhibited significantly lower expression of multiple
restric-tion factors, including APOBEC3G,MX2, and TRIM25, which may contribute to the
exquisite susceptibility of these cells to SIV infection. In vitro stimulation with
anti-CD3/CD28 antibodies or type I interferon resulted in upregulation of distinct subsets of multiple restriction factors. After infection of rhesus macaques with SIVmac239, the expression of most confirmed and putative restriction factors substantially
in-creased in all CD4⫹T cell memory subsets at the peak of acute infection. Jejunal
CCR5⫹ CD4⫹ T cells exhibited the highest levels of SIV RNA, corresponding to the
lower restriction factor expression in this subset relative to peripheral blood prior to infection. These results illustrate the dynamic modulation of confirmed and putative restriction factor expression by memory differentiation, stimulation, tissue microenvi-ronment and SIV infection and suggest that differential expression of restriction fac-tors may play a key role in modulating the susceptibility of different populations of
CD4⫹T cells to lentiviral infection.
IMPORTANCE Restriction factors are genes that have evolved to provide intrinsic
de-fense against viruses. HIV and simian immunodeficiency virus (SIV) target CD4⫹T cells.
The baseline level of expression in vivo and degree to which expression of restriction
factors is modulated by conditions such as CD4⫹T cell differentiation, stimulation, tissue
location, or SIV infection are currently poorly understood. We measured the expression
of 45 confirmed and putative restriction factors in primary CD4⫹T cells from rhesus
ma-caques under various conditions, finding dynamic changes in each state. Most dramati-cally, in acute SIV infection, the expression of almost all target genes analyzed increased. These are the first measurements of many of these confirmed and putative restriction factors in primary cells or during the early events after SIV infection and suggest that the level of expression of restriction factors may contribute to the differential
susceptibil-ity of CD4⫹T cells to SIV infection.
KEYWORDS CD4⫹T lymphocytes, gut-associated lymphoid tissue, interferon-stimulated genes, restriction factors, simian immunodeficiency virus
Received4 November 2016Accepted11 January 2017
Accepted manuscript posted online18 January 2017
CitationRahmberg AR, Rajakumar PA, Billingsley JM, Johnson RP. 2017. Dynamic modulation of expression of lentiviral restriction factors in primary CD4+T cells following simian immunodeficiency virus infection. J Virol 91:e02189-16.https://doi.org/ 10.1128/JVI.02189-16.
EditorFrank Kirchhoff, Ulm University Medical Center
Copyright© 2017 American Society for Microbiology.All Rights Reserved. Address correspondence to R. Paul Johnson, [email protected].
crossm
on November 7, 2019 by guest
http://jvi.asm.org/
R
estriction factors serve as a key host defense against virus infection. Many of these genes have well-described activity against the primate lentiviruses HIV and SIV,including the APOBEC3 DNA deaminase family (1), the TRIM family (2),BST-2/tetherin (3,
4), andSAMHD1 (5). In addition to the more well-studied restriction factors, screens
have been performed to identify additional restriction factors. A whole-genome small interfering RNA screen has identified putative restriction factors such as the PAF1 complex and exosome components (6). A screen for genes sharing genomic
charac-teristics of known restriction factors identifiedAPOLandTNFRSFfamily members and
used cell-based assays to confirm the restriction of HIV-1 (7). Although many studies focus on the impact of a single factor, the total effect of restriction factors on virus infection is likely to be cumulative. Though much work has focused on defining mechanisms of action and structure-function studies for individual restriction factors,
little is known about the levels of expression in primary CD4⫹ T cells and how
expression may be modulated as a result of T cell differentiation and activation or during the course of acute lentiviral infection.
Naive CD4⫹T cells that are stimulated by cognate antigen can differentiate into a
broad range of functionally specialized cell subsets (8). Studies have found that the
differentiation status of a CD4⫹ T cell influences its susceptibility to HIV and SIV
infection and, specifically, that memory CD4⫹T cells are more likely to be infected than
naive CD4⫹T cells (9, 10). The effects of memory differentiation on restriction factor
expression are incompletely understood and may contribute to the differential suscep-tibility of memory and naive cells.
During acute infection, HIV and SIV primarily replicate in and deplete gut CD4⫹T
cells (11–13); however, primary cells from mucosal tissues are relatively understudied compared to cells from peripheral blood due to the difficulty in obtaining tissue samples (14). Whether expression of restriction factors differs between peripheral blood
CD4⫹T cells, which are infected at lower rates, and CD4⫹T cells in the gut mucosa,
which are highly susceptible to SIV/HIV infection (11–13), is currently unknown. We
studied here the expression of confirmed and putative restriction factors in CD4⫹T cells
obtained from the jejunum as a representative gut mucosal site; the jejunum was chosen due to the relative abundance of jejunal lymphoid cells compared to other intestinal regions, the relative infrequency of immune inductive sites in this location (15), and the availability of robust data sets regarding the kinetics of SIV replication in the jejunum (11–13).
The events of acute immunodeficiency virus infection are challenging to study in humans. Analysis of acute lentiviral infection in nonhuman primates has multiple advantages, including the ability to control the inoculating strain, the precise timing of sampling, and superior access to mucosal and lymphoid tissues. In light of strong evidence documenting the induction of interferon during primary SIV and HIV infection and the fact that many restriction factors are known to be interferon (IFN)-stimulated genes (ISGs) (16, 17), we reasoned that expression of restriction factors is likely to be modulated during the course of SIV infection. However, data on the modulation of
expression of restriction factors in different CD4⫹ T cell subsets during acute SIV
infection, especially for the critical CD4⫹target cells in the gut mucosa, is not currently
defined.
We hypothesized that the comprehensive analysis expression of a large panel of confirmed and putative restriction factors would provide insights into the molecular mechanisms that underlie differences between naive and memory cells in their sus-ceptibility to lentiviral infection, as well as the differential infectivity between peripheral
blood and gut mucosa CD4⫹ T cells. Analysis of expression of target genes was
performed using a high-throughput microfluidic RT-PCR platform that allows for highly quantitative and specific analysis of up to 96 genes at a time from each of 96 samples.
Using highly purified sorted populations of CD4⫹T cells, we observed both up- and
downregulation of restriction factors due to memory differentiation that occurred in a similar pattern in both peripheral blood and jejunum cells. Stimulation with either anti-CD3/CD28 or type I IFN also altered expression of restriction factors in primary cells.
on November 7, 2019 by guest
http://jvi.asm.org/
Despite broad similarities in expression patterns between peripheral blood and the
jejunum, the transitional memory CD4⫹ T cells from the jejunum had lower total
expression of confirmed and putative restriction factors relative to the same subset in
peripheral blood. After infection with SIVmac239, transitional memory CD4⫹T cells
from the jejunum exhibited the highest level of infection. Strikingly, expression of most restriction factors increased in all memory subsets during acute SIV infection.
RESULTS
Expression of confirmed and putative restriction factors in peripheral blood CD4ⴙT cells.As a comprehensive approach to analyze the expression of restriction
factors in primary CD4⫹T cells, a list of 45 confirmed or putative HIV/SIV restriction
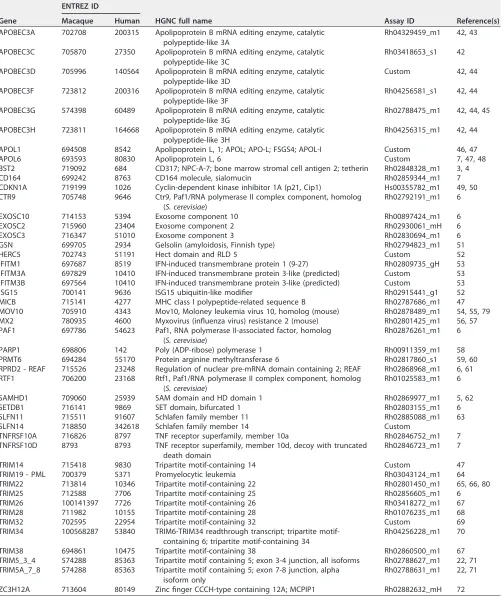
factors was compiled from published sources (Table 1). (We refer to these molecules as restriction factors in the remainder of the manuscript but acknowledge that a number of these molecules have not been rigorously confirmed as restriction factors). To assess expression of restriction factors in defined cell populations in macaques not infected with SIV, peripheral blood mononuclear cells (PBMCs) and jejunum lymphocytes were isolated from four Indian-origin rhesus macaques, stained with monoclonal antibodies, and sorted into four highly purified
popula-tions: naive (CD3⫹4⫹28⫹95⫺ CCR7⫹ CCR5⫺), central memory (CD3⫹4⫹28⫹95⫹
CCR7⫹CCR5⫺), transitional memory (CD3⫹4⫹28⫹95⫹CCR7⫺CCR5⫹), and effector
memory (CD3⫹4⫹28⫺95⫹CCR7⫺CCR5⫺) (18, 19). RNA was extracted and the cDNA
samples were analyzed on the Fluidigm BioMark microfluidic real-time PCR system.
Results from each animal were normalized by the ΔΔCTmethod (20) to the most
stable of seven endogenous control genes (POLR2A), as determined by the NormFinder
algorithm (21), and to the naive population (Fig. 1A). In general, increased expression was seen for many of the target genes in memory subsets relative to naive cells,
including APOBEC family members, p21, GSN, and SAMHD1. The CCR5⫹ transitional
memory CD4⫹T cells from peripheral blood expressed the largest number of confirmed
and putative restriction factors, 12, with a mean of at least 4-fold greater expression relative to naive cells compared to nine genes in effector memory and six in central memory.
Using expression data of only the restriction factor genes normalized to a stable
control gene (POLR2A), principal-component analysis (PCA) revealed expression
pat-terns that clustered by memory subset (Fig. 1E). Since each memory subset was more similar to the respective subset from another animal rather than other subsets from the same animal (Fig. 1C and D), these data reveal a reproducible pattern of expression due to memory differentiation. Examination of the loading factors for principal component
axis 1 (PC1) identified the genes driving the clustering along thexaxis.APOBECfamily
members,MX2,GSN, andTNFSRFfamily members were the major genes contributing to
memory subset differences. These genes were among the most differentially expressed restriction factors among memory populations.
Expression of confirmed and putative restriction factors in jejunum CD4ⴙT
cells. CD4⫹T cells from the jejunum showed a similar pattern of restriction factor
expression as observed in peripheral blood CD4⫹T cells, demonstrating that in general,
expression of restriction factors was modulated primarily by memory differentiation regardless of tissue location (Fig. 1B). Similar to peripheral blood, transitional memory cells had the largest number of upregulated target genes— eight, relative to naive cells, compared to four in central memory and five in effector memory. As in peripheral
blood, PCA also clustered memory subsets together for jejunum CD4⫹T cells, though
transitional and effector memory cells were not as distinctly separated (Fig. 1D). Similar
genes contributed to the spatial organization of samples along PC1, includingAPOBECs,
MX2,GSN, andTNFRSFgenes (Fig. 1F).
Since TRIM5 is known to be expressed as multiple differentially spliced isoforms
where only the␣ isoform is restrictive (22), we used two assays forTRIM5: one that
recognizes a splice junction present in all TRIM5transcripts (exon 3-4) and one that
recognizes the exon 7-8 splice junction found only inTRIM5␣. This allowed assessment
on November 7, 2019 by guest
http://jvi.asm.org/
TABLE 1Confirmed and putative restriction factors selected for analysisa
Gene
ENTREZ ID
HGNC full name Assay ID Reference(s)
Macaque Human
APOBEC3A 702708 200315 Apolipoprotein B mRNA editing enzyme, catalytic polypeptide-like 3A
Rh04329459_m1 42, 43
APOBEC3C 705870 27350 Apolipoprotein B mRNA editing enzyme, catalytic polypeptide-like 3C
Rh03418653_s1 42
APOBEC3D 705996 140564 Apolipoprotein B mRNA editing enzyme, catalytic polypeptide-like 3D
Custom 42, 44
APOBEC3F 723812 200316 Apolipoprotein B mRNA editing enzyme, catalytic polypeptide-like 3F
Rh04256581_s1 42, 44
APOBEC3G 574398 60489 Apolipoprotein B mRNA editing enzyme, catalytic polypeptide-like 3G
Rh02788475_m1 42, 44, 45
APOBEC3H 723811 164668 Apolipoprotein B mRNA editing enzyme, catalytic polypeptide-like 3H
Rh04256315_m1 42, 44
APOL1 694508 8542 Apolipoprotein L, 1; APOL; APO-L; FSGS4; APOL-I Custom 46, 47
APOL6 693593 80830 Apolipoprotein L, 6 Custom 7, 47, 48
BST2 719092 684 CD317; NPC-A-7; bone marrow stromal cell antigen 2; tetherin Rh02848328_m1 3, 4
CD164 699242 8763 CD164 molecule, sialomucin Rh02859344_m1 7
CDKN1A 719199 1026 Cyclin-dependent kinase inhibitor 1A (p21, Cip1) Hs00355782_m1 49, 50 CTR9 705748 9646 Ctr9, Paf1/RNA polymerase II complex component, homolog
(S. cerevisiae)
Rh02792191_m1 6
EXOSC10 714153 5394 Exosome component 10 Rh00897424_m1 6
EXOSC2 715960 23404 Exosome component 2 Rh02930061_mH 6
EXOSC3 716347 51010 Exosome component 3 Rh02830694_m1 6
GSN 699705 2934 Gelsolin (amyloidosis, Finnish type) Rh02794823_m1 51
HERC5 702743 51191 Hect domain and RLD 5 Custom 52
IFITM1 697687 8519 IFN-induced transmembrane protein 1 (9-27) Rh02809735_gH 53
IFITM3A 697829 10410 IFN-induced transmembrane protein 3-like (predicted) Custom 53 IFITM3B 697564 10410 IFN-induced transmembrane protein 3-like (predicted) Custom 53
ISG15 700141 9636 ISG15 ubiquitin-like modifier Rh02915441_g1 52
MICB 715141 4277 MHC class I polypeptide-related sequence B Rh02787686_m1 47
MOV10 705910 4343 Mov10, Moloney leukemia virus 10, homolog (mouse) Rh02878489_m1 54, 55, 79 MX2 780935 4600 Myxovirus (influenza virus) resistance 2 (mouse) Rh02801425_m1 56, 57 PAF1 697786 54623 Paf1, RNA polymerase II-associated factor, homolog
(S. cerevisiae)
Rh02876261_m1 6
PARP1 698806 142 Poly (ADP-ribose) polymerase 1 Rh00911359_m1 58
PRMT6 694284 55170 Protein arginine methyltransferase 6 Rh02817860_s1 59, 60
RPRD2 - REAF 715526 23248 Regulation of nuclear pre-mRNA domain containing 2; REAF Rh02868968_m1 6, 61 RTF1 706200 23168 Rtf1, Paf1/RNA polymerase II complex component, homolog
(S. cerevisiae)
Rh01025583_m1 6
SAMHD1 709060 25939 SAM domain and HD domain 1 Rh02869977_m1 5, 62
SETDB1 716141 9869 SET domain, bifurcated 1 Rh02803155_m1 6
SLFN11 715511 91607 Schlafen family member 11 Rh02885088_m1 63
SLFN14 718850 342618 Schlafen family member 14 Custom
TNFRSF10A 716826 8797 TNF receptor superfamily, member 10a Rh02846752_m1 7
TNFRSF10D 8793 8793 TNF receptor superfamily, member 10d, decoy with truncated death domain
Rh02846723_m1 7
TRIM14 715418 9830 Tripartite motif-containing 14 Custom 47
TRIM19 - PML 700379 5371 Promyelocytic leukemia Rh03043124_m1 64
TRIM22 713814 10346 Tripartite motif-containing 22 Rh02801450_m1 65, 66, 80
TRIM25 712588 7706 Tripartite motif-containing 25 Rh02856605_m1 6
TRIM26 100141397 7726 Tripartite motif-containing 26 Rh03418272_m1 67
TRIM28 711982 10155 Tripartite motif-containing 28 Rh01076235_m1 68
TRIM32 702595 22954 Tripartite motif-containing 32 Custom 69
TRIM34 100568287 53840 TRIM6-TRIM34 readthrough transcript; tripartite motif-containing 6; tripartite motif-motif-containing 34
Rh04256228_m1 70
TRIM38 694861 10475 Tripartite motif-containing 38 Rh02860500_m1 67
TRIM5_3_4 574288 85363 Tripartite motif containing 5; exon 3-4 junction, all isoforms Rh02788627_m1 22, 71 TRIM5A_7_8 574288 85363 Tripartite motif containing 5; exon 7-8 junction, alpha
isoform only
Rh02788631_m1 22, 71
ZC3H12A 713604 80149 Zinc finger CCCH-type containing 12A; MCPIP1 Rh02882632_mH 72
aAssay ID numbers are provided for the ABI TaqMan assays; sequences for the custom assays are provided in the text.
on November 7, 2019 by guest
http://jvi.asm.org/
of the precise functional isoform in case it differed in expression under the various
tested conditions. In both peripheral blood and the jejunum, bothTRIM5assays showed
similar patterns of expression change relative to naive CD4⫹T cells, indicating that the
transcript levels are not differentially affected by memory differentiation.
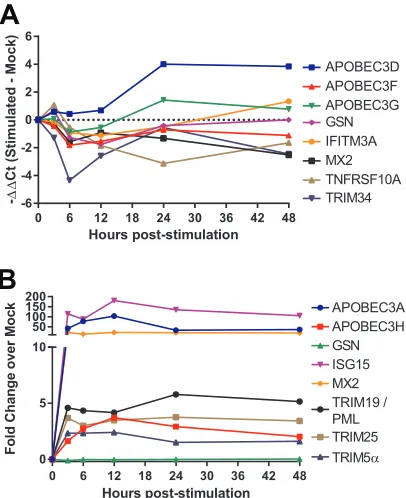
Stimulation alters expression of confirmed and putative restriction factors.To
test whether cellular activation modulated expression of the target genes, bulk CD4⫹
T cells were isolated from the peripheral blood of four rhesus macaques and stimulated
with either ␣CD3/␣CD28-coupled beads or recombinant type I human IFN-␣A/D.
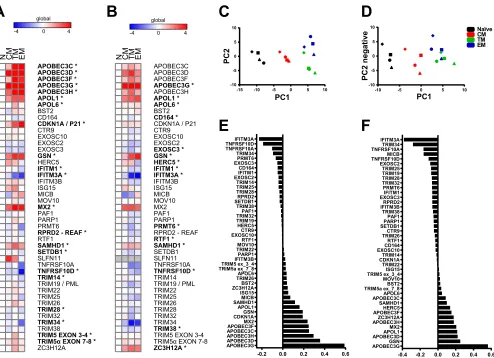
CD3/CD28 activation significantly (P⬍0.05,ttest) modulated 36% of the genes in at
least one time point compared to mock-stimulated cells (Fig. 2A). Stimulation induced both increases and decreases in expression of multiple restriction factors over the course of the experiment, showing that restriction factor expression can be dynamically modulated by CD3/CD28 stimulation. This pattern of modulation of expression of restriction factors contrasts with that previously observed in response to phytohem-agglutinin (PHA) stimulation, which generally resulted in increased restriction factor expression in human CD4 T cells (23).
In vitro IFN stimulation increased expression of 32% of the genes compared to mock-stimulated cells (Fig. 2B). All of the restriction factors exhibiting increased ex-pression have been previously found to be IFN-stimulated genes in microarray studies
global
-4 0 4
N CM TM EM
APOBEC3C * APOBEC3D * APOBEC3F * APOBEC3G * APOBEC3H * APOL1 * APOL6 * BST2 CD164 CDKN1A / P21 * CTR9 EXOSC10 EXOSC2 EXOSC3 GSN * HERC5 IFITM1 * IFITM3A * IFITM3B ISG15 MICB MOV10 MX2 * PAF1 PARP1 PRMT6 RPRD2 - REAF * RTF1 SAMHD1 * SETDB1 * SLFN11 TNFRSF10A TNFRSF10D * TRIM14 * TRIM19 / PML TRIM22 TRIM25 TRIM26 TRIM28 * TRIM32 TRIM34 * TRIM38 TRIM5 EXON 3-4 * TRIM5α EXON 7-8 * ZC3H12A
N CM TM EM
APOBEC3C APOBEC3D APOBEC3F APOBEC3G * APOBEC3H APOL1 * APOL6 * BST2 CD164 * CDKN1A / P21 CTR9 EXOSC10 EXOSC2 EXOSC3 * GSN * HERC5 * IFITM1 * IFITM3A * IFITM3B ISG15 MICB MOV10 MX2 PAF1 PARP1 PRMT6 * RPRD2 - REAF RTF1 * SAMHD1 * SETDB1 SLFN11 TNFRSF10A TNFRSF10D * TRIM14 TRIM19 / PML TRIM22 TRIM25 TRIM26 TRIM28 TRIM32 TRIM34 TRIM38 * TRIM5 EXON 3-4 TRIM5α EXON 7-8 ZC3H12A *
A
B
C
D
E
F
global
-4 0 4
-15 -10 -5 0 5 10
-10 -5 0 5 10 PC1 PC2
-10 -5 0 5 10
-10 -5 0 5 10 PC1 PC2 negative Naïve EM CM TM
-0.2 0.0 0.2 0.4 0.6
APOBEC3G APOBEC3D APOBEC3H APOBEC3CAPOBEC3F MX2 CDKN1AGSN APOL1 SAMHD1MICB ISG15 ZC3H12ABST2 TRIM26APOL6
TRIM5a ex_7_8TRIM5 ex_3_4
IFITM3BPARP1 TRIM22 MOV10RTF1 EXOSC10CTR9 HERC5 TRIM19 TRIM32PAF1 TRIM38 SETDB1 RPRD2 TRIM28 TRIM25 TRIM14 EXOSC2 IFITM1CD164 EXOSC3PRMT6 TRIM34 TNFRSF10A TNFRSF10DIFITM3A
-0.4 -0.2 0.0 0.2 0.4 0.6
APOBEC3G GSN APOBEC3DAPOL1 MX2 APOBEC3H ZC3H12A APOBEC3FHERC5 SAMHD1 APOBEC3C APOL6
TRIM5a ex_7_8BST2
MOV10 TRIM5 ex_3_4 ISG15 TRIM22 CDKN1ATRIM14 EXOSC10 CD164RTF1 TRIM26CTR9 SETDB1 PARP1PAF1 TRIM38 IFITM3BRPRD2 EXOSC3IFITM1 PRMT6 TRIM32 TRIM28 TRIM19 TRIM25 EXOSC2 TNFRSF10DMICB TNFRSF10ATRIM34 IFITM3A
FIG 1Confirmed and putative restriction factors exhibit similar patterns of expression in peripheral blood and jejunum CD4⫹T cell memory subsets and are
dynamically modulated by stimulation. (A and B) Heat map of⫺ΔΔCTexpression values depicting memory subset expression relative to naive for peripheral blood (A) and the jejunum (B).POLR2Awas used as endogenous control gene for normalization. The means for four animals are shown (*, P⬍0.01 [repeated-measures ANOVA with an extension of the Benjamini-Hochberg correction method]). (C and D) PCA for peripheral blood (C) and the jejunum (D) based on analysis of 45 restriction factor genes. Each symbol in panels C and D represents a different animal. (E and F) PC1 loading factors from the PCA for peripheral blood (E) and the jejunum (F).
on November 7, 2019 by guest
http://jvi.asm.org/
[image:5.585.48.542.70.428.2](24–26). The time course exhibited a rapid modulation of responding genes as they reached peak or near-peak fold changes by the earliest time point poststimulation, 3 h, and generally maintained these levels for 48 h. Similar to memory differentiation, both
TRIM5assays were modulated in concert by interferon, indicating similar regulation of the different transcripts. Overall, both forms of stimulation showed that restriction factor expression can be dynamically modulated by external signals; however, neither form of stimulation reproduced a pattern similar to memory differentiation.
Differences between expression of confirmed and putative restriction factors in the jejunum and peripheral blood.Despite the similarities in the overall pattern of expression of restriction factors between peripheral blood and the jejunum, several differences were apparent. To determine the extent of variation in confirmed and
putative restriction factor expression between peripheral blood and jejunum CD4⫹T
cells, the expression of the target genes in the jejunum relative to peripheral blood was
analyzed using the ΔΔCT method (20), normalizing expression to the most stable
endogenous control, B2M, and to the respective peripheral blood subset (Fig. 3A).
Several genes showed⬎4-fold-greater differences:APOBEC3Din naive T cells,PRMT6
andTNFRSF10Din effector memory T cells, andZC3H12Ain all three memory CD4⫹T cell subsets. Interestingly, eight genes exhibited at least 4-fold mean decreased
expres-sion in the CCR5⫹transitional memory cells from the jejunum compared to the same
subset of CD4⫹ T cells from peripheral blood. The number of target genes with
decreased expression in jejunal CCR5⫹transitional memory CD4⫹T cells was much
larger than the number of genes exhibiting lower expression in central memory (one) or effector memory (two). Using a two-way analysis of variance (ANOVA), the genes that significantly differed in their magnitude of expression between peripheral blood and the jejunum were identified and are noted in Fig. 3A. In addition, genes for which the pattern of expression among the memory subsets differed significantly in the two
0 6 12 18 24 30 36 42 48
-6 -4 -2 0 2 4 6
Hours post-stimulation
-ΔΔ
C
t
(Stimulate
d
-M
o
c
k
)
APOBEC3D APOBEC3F APOBEC3G GSN IFITM3A MX2 TNFRSF10A TRIM34
0 6 12 18 24 30 36 42 48
0 5 10 50 100 150 200
Hours post-stimulation
F
o
ld
Change
o
v
e
r
M
o
c
k APOBEC3A
APOBEC3H GSN ISG15 MX2 TRIM19 / PML TRIM25 TRIM5α
A
B
FIG 2Expression of confirmed and putative restriction factors is dynamically modulated by CD3/CD28
and type I IFN stimulation. (A) Time course of the change in expression of selected restriction factor genes in CD4⫹T cells from peripheral blood stimulated with anti-CD3/anti-CD28 beads versus mock-treated animals relative to the time of stimulation. (B) Time course of the change in expression of restriction factor genes after stimulation with 1,000 U of type I IFN/ml relative to the time of stimulation. Data represent the means of samples obtained from four animals. The results shown for TRIM5␣reflect data obtained using an assay specific for the␣isoform ofTRIM5.
on November 7, 2019 by guest
http://jvi.asm.org/
[image:6.585.105.308.73.322.2]tissues were identified. There were nine genes with a Pvalue of ⬍0.02: APOBEC3C,
APOBEC3D,APOBEC3G,APOBEC3H,APOL6,CDKN1A,PARP1,SAMHD1, andTRIM5. As the overall level of viral restriction mediated by these genes is likely to be cumulative, the overall mean expression of restriction factors from the jejunum relative to the peripheral blood was calculated (Fig. 3B). This value provides a measure of the extent of overall restriction factor expression in each subset for which the only difference between cells was anatomic location. Transitional memory cells from the
jejunum had a mean ⫺ΔΔCT value of ⫺0.819, which represents 0.567-fold lower
expression. Using a pairedttest, this decrease was statistically significantly different
from the naive (P⫽0.028) and central memory (P⫽0.015) subsets, though not for
effector CD4⫹T cells (P⫽0.115).
Acute SIV infection increases expression of restriction factors in CD4ⴙT cells.
Given the effects of IFN stimulation and T cell activation that we observed on the
expression of restriction factors in CD4⫹T cellsin vitro, we reasoned that the dynamic
effects of acute SIV infection, which include induction of a robust type I IFN response
(16, 17), would likely have significant effects on the expression of restriction factorsin
vivo. It is challenging to study the acute phase of immunodeficiency virus infection in
humans, especially in the primary target tissue, i.e., gut-associated lymphoid tissue. To
-4.00 -2.67 -1.33 0.00 1.33 2.67 4.00
N CM TM EM
TRIM34 TRIM22 TRIM19 / PML EXOSC10 TRIM5a EXON 3-4 TNFRSF10A SETDB1 TRIM32 IFITM1 TRIM5a EXON 7-8 APOL6 TRIM38 RPRD2 - REAF PARP1 CTR9
TRIM25 * SAMHD1 MICB
MX2 * APOBEC3G * HERC5 APOL1 IFITM3A APOBEC3H IFITM3B APOBEC3F APOBEC3D APOBEC3C CD164
CDKN1A / P21 * PAF1 * GSN * EXOSC3 TNFRSF10D
ZC3H12A * BST2 ISG15 EXOSC2 TRIM28 RTF1 TRIM26 MOV10 PRMT6 * TRIM14
A
B
Naive CM TM EM
-1.5 -1.0 -0.5 0.0 0.5 1.0
Me
a
n
±
S
D
*
*
FIG 3Differences in expression of confirmed and putative restriction factors in peripheral blood and jejunum CD4⫹
T cells. (A) Heat map depicting expression in the jejunum relative to peripheral blood and the most stable endogenous control gene,B2M. Unsupervised hierarchical clustering was performed using an uncentered Pearson correlation with complete linkage groups genes with similar expression patterns. The means of four animals are shown (*,P⬍0.05 [two-way ANOVA testing tissue differences with an extension of the Benjamini-Hochberg correction method]). (B) Mean expression plus the standard deviations (⫺ΔΔCT) of all restriction factors in the jejunum relative to their respective peripheral blood subset (*,P⬍0.05 [pairedttest]).
on November 7, 2019 by guest
http://jvi.asm.org/
[image:7.585.45.407.70.428.2]investigate potential changes in expression of restriction factorsin vivoduring acute SIV
infection, four rhesus macaques were infected intravenously with SIVMAC239. At 10 days
postinfection, the animals were sacrificed, and peripheral blood and jejunum lympho-cytes were isolated. Analysis of plasma SIV viral loads demonstrated a geometric mean
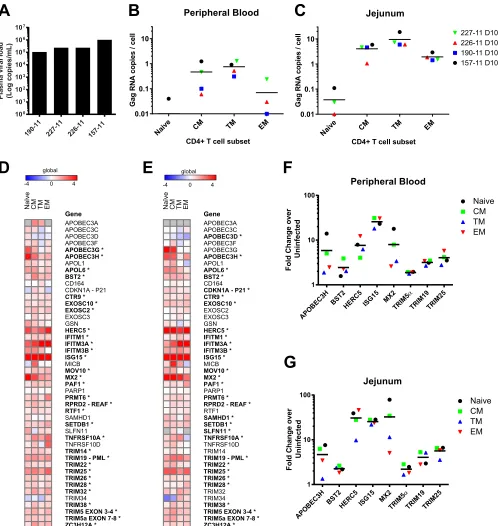
of 2.8⫻105copies/ml at 10 days after infection (Fig. 4A). Memory CD4⫹T cell subsets
were sorted as previously defined, and levels of SIVgagRNA were quantified. In both
peripheral blood and the jejunum, the transitional memory CCR5⫹CD4⫹T cells were
the most highly infected memory subset, as expected (Fig. 4B and C). CD4⫹T cells from
the jejunum in each subset were much more highly infected than from peripheral
blood (P⫽0.0058, pairedt test). The reduced expression of confirmed and putative
restriction factors specifically in jejunum transitional memory CD4⫹T cells compared to
peripheral blood corresponded with increased viral infection of these cells.
Strikingly, expression of restriction factors increased in every CD4⫹T cell memory
subset from both peripheral blood (mean 2.08-fold change increase) and the jejunum (mean 2.14-fold change) 10 days postinfection (Fig. 4D and E) compared to four uninfected animals. On average, 43 of 46 genes increased expression in peripheral blood and 43 of 45 in the jejunum. In particular, peripheral blood cells exhibited a mean
increase of⬎4-fold inAPOBEC3H,HERC5,IFITM3A,ISG15, andMX2, whereas jejunum
cells increased expression of APOBEC3G, HERC5, IFITIM3A, ISG15, MX2, and TRIM25
⬎4-fold on average. These genes have been previously reported to be type I ISGs (25,
26), and acute SIV infection has been well documented to induce a strong type I IFN response (17). Using a two-way ANOVA with Benjamini Hochberg correction,
approx-imately two-thirds of the target genes were significantly modulated (P ⬍ 0.01) by
infection in both peripheral blood and the jejunum, including the known ISGs and
nearly all of the TRIM family members. To verify that a global increase in gene
expression did not account for upregulation of restriction factors, a panel of 18
endogenous control or lineage genes such asCD3,CD4,CD28, etc., was confirmed to
remain quite stable compared to preinfection (mean ⫺ΔΔCT value of ⫺0.04, or a
0.97-fold change [data not shown]). The pattern of restriction factor upregulation was quite similar in peripheral blood compared to the jejunum and naive cells compared to memory cells despite large differences in the levels of infection between the two groups, implicating systemic IFN or cytokine responses as drivers of upregulation.
Finally, we also examined whether there was a correlation between the expression
of confirmed and putative restriction factors in subsets of jejunal CD4⫹T cells relative
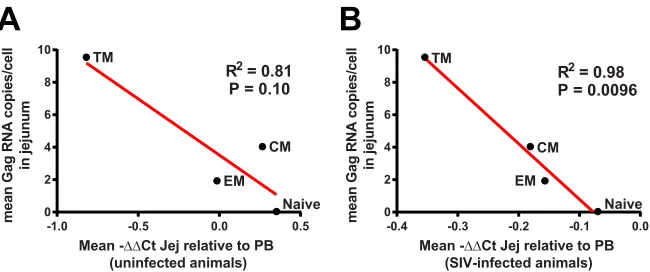
to their counterparts in peripheral blood in uninfected animals and the susceptibility of these various subsets to SIV infection at 10 days postinfection. Although statistical power was limited by the number of samples studied, a trend toward an inverse
relationship was observed between expression of restriction factors in jejunum CD4⫹T
cell memory subsets compared to peripheral blood in uninfected animals and the level
of SIV infection in jejunal CD4⫹T cells (Fig. 5A). We did observe a significant
relation-ship between relatively lower levels of expression of confirmed and putative restriction
factors in CD4⫹T cells in the jejunum compared to peripheral blood postinfection and
the amount of SIV RNA in jejunal CD4⫹T cells (Fig. 5B). Future studies involving larger
numbers of samples will be necessary to examine in more detail the relationship between expression of restriction factors in different T cells subsets and their suscep-tibility to SIV infection.
DISCUSSION
We describe here precise expression measurements for 45 confirmed or putative
restriction factors in subsets of primary CD4⫹T cells from peripheral blood and the
jejunum, a critical site for SIV/HIV pathogenesis, under a variety of different conditions. Memory differentiation induced a high dynamic range of expression of restriction
factors. For example, we observed a⬎22-fold average upregulation ofAPOBECfamily
genes in the jejunum relative to their expression in naive CD4⫹T cells. Paired
com-parison of the jejunum with peripheral blood CD4⫹T cells demonstrated
unappreci-ated differences in expression of restriction factors that could underlie differences in
on November 7, 2019 by guest
http://jvi.asm.org/
their susceptibility to SIV infection. Specifically, CCR5⫹CD4⫹T cells from the jejunum
showed reduced expression of restriction factors relative to the CCR5⫹CD4⫹T cells
from peripheral blood. In general, memory differentiation had similar effects on the expression of restriction factors in both tissue compartments, increasing the average
Naiv e
CM TM EM
0.01 0.1 1 10
Peripheral Blood
CD4+ T cell subset
Ga g R N A c o p ie s / c e ll Nai
ve CM TM EM 0.01 0.1 1 10 Jejunum
CD4+ T cell subset
Ga g R N A co p ies / c e ll 157-11 D10 190-11 D10 226-11 D10 227-11 D10 global
-4 0 4
Naïve CM TM EM
Gene APOBEC3A APOBEC3C APOBEC3D APOBEC3F APOBEC3G * APOBEC3H * APOL1 APOL6 * BST2 * CD164 CDKN1A - P21 CTR9 * EXOSC10 * EXOSC2 * EXOSC3 GSN HERC5 * IFITM1 * IFITM3A * IFITM3B * ISG15 * MICB MOV10 * MX2 * PAF1 * PARP1 PRMT6 * RPRD2 - REAF * RTF1 * SAMHD1 SETDB1 * SLFN11 TNFRSF10A * TNFRSF10D TRIM14 * TRIM19 - PML * TRIM22 * TRIM25 * TRIM26 * TRIM28 * TRIM32 * TRIM34 TRIM38 * TRIM5 EXON 3-4 * TRIM5a EXON 7-8 * ZC3H12A *
global
-4 0 4
Naïve CM TM EM
Gene APOBEC3A APOBEC3C APOBEC3D * APOBEC3F APOBEC3G APOBEC3H * APOL1 APOL6 * BST2 * CD164 CDKN1A - P21 * CTR9 * EXOSC10 * EXOSC2 EXOSC3 GSN HERC5 * IFITM1 * IFITM3A * IFITM3B * ISG15 * MICB MOV10 * MX2 * PAF1 * PARP1 PRMT6 * RPRD2 - REAF * RTF1 SAMHD1 * SETDB1 * SLFN11 * TNFRSF10A * TNFRSF10D TRIM14 TRIM19 - PML * TRIM22 * TRIM25 * TRIM26 * TRIM28 * TRIM32 TRIM34 TRIM38 * TRIM5 EXON 3-4 * TRIM5a EXON 7-8 * ZC3H12A *
D
A
B
E
F
G
AP OB EC3 H BS T2 HER C5 ISG 15 MX 2 TR IM5 α TRI M1 9 TRIM 25 1 10 100 Peripheral Blood F o ld Ch a n g e ov e r Uninfected Naive CM TM EM AP OB EC 3H BST 2 HE RC5 ISG 15 MX2 TRIM5α TRI M19 TR IM2 5 1 10 100 Jejunum F o ld Ch a n g e ov e r Naive CM TM EM Uninfected
C
190 -11 227 -11 226 -11 157 -11 100 101 102 103 104 105 106 107 Plasm a v ir al lo a d (L o g co p ies/ m L )FIG 4Increased SIV infection in jejunum transitional memory CD4⫹T cells and changes in expression of confirmed and putative restriction factors during acute
infection. (A) Plasma viral load for each of the four SIV-infected animals at day 10 postinfection. (B and C) The Gag RNA copies per cell equivalent were quantified in sorted CD4⫹T cell subsets from peripheral blood (B) and the jejunum (C). (D and E) Heat map of⫺ΔΔC
Texpression values depicting memory subset expression in postinfection cells relative to uninfected animals for peripheral blood (D) and the jejunum (E).B2Mwas used as an endogenous control gene to normalize both uninfected and infected data. Means of four animals per group are shown (*, P⬍ 0.01 [two-way ANOVA with an extension of the Benjamini-Hochberg correction method testing differences due to infection]). (F and G) Mean fold change of selected restriction factors from CD4⫹T cell subsets postinfection relative to the same subset in uninfected animals for peripheral blood (F) and the jejunum (G).
on November 7, 2019 by guest
http://jvi.asm.org/
[image:9.585.45.543.71.597.2]restriction factor expression. Activation of bulk populations of CD4⫹T cells has been
shown to increase restriction factor expression (23), and both CD3/CD28 and IFN stimulation dynamically modulated expression of restriction factors. However, despite
the overall increased expression of restriction factors in memory CD4⫹T cells, these
cells are well documented to be more susceptible to SIV and HIV infection (9, 10). This increased susceptibility is likely to reflect factors other than restriction factors that modulate infection such as T cell activation, as well as the ability of SIV to counteract the effects of restriction factors by various mechanisms, including the effects of Vif on APOBEC3G, Nef on tetherin, and Vpx on SAMHD1 (27, 28).
The Fluidigm Biomark qRT-PCR system used in the present study allows for high-throughput, highly quantitative, and precise gene expression measurements with a wide dynamic range of 6 to 8 orders of magnitude, which is significantly wider than microarray-based systems (29). In addition, the specificity of the primer/probe real-time PCR assays permitted discrimination of specific transcript isoforms. TRIM5 is known to
be expressed as multiple isoforms in humans. Only theTRIM5␣isoform containing the
C-terminal SPRY domain is capable of restricting HIV/SIV, while other isoforms can act
in a dominant negative fashion to inactivate the␣isoform (22). Here, we found that the
␣isoform is present at about 50% of the abundance of totalTRIM5in primary CD4⫹T
cells from both the jejunum and peripheral blood. However, various forms of stimula-tion, including memory differentiastimula-tion, CD3/CD28, IFN, and SIV infecstimula-tion, did not
appreciably alter the relative abundance of the␣isoform to that of totalTRIM5despite
altering the total level of expression.
Prior studies have demonstrated that mRNA levels generally correlate well with protein expression, especially for immune response genes (such as restriction factors) that are dynamically modulated following cell stimulation (30–32). While efforts to address this issue for macaque restriction factors are complicated by the paucity of validated reagents, we did observe a significant correlation between surface CCR5 and CD28 protein expression with their respective mRNA levels in subsets of macaque
CD4⫹T cells (data not shown). However, it is important to bear in mind that a number
of factors, including the potential for posttranslational regulation (33), can modulate expression of restriction factors, and future studies will be necessary to correlate the protein expression of individual restriction factors with the susceptibility to SIV
infec-tion in different CD4⫹ T cell subsets. Since we examined expression of restriction
factors in defined phenotypic subsets of CD4⫹T cells, the observed changes in the
relative expression of restriction factors after SIV infection are likely to reflect true
upregulation of restriction factors in specific populations of CD4⫹T cells rather than the
confounding effects of redistribution of CD4⫹T cells among different compartments
during acute infection.
Mean -∆∆Ct Jej relative to PB (uninfected animals)
A
B
mean Gag RNA copies/cell
in jejunum
-0.4 -0.3 -0.2 -0.1 0.0 0
2 4 6 8 10
Naive CM
TM
EM
R2 = 0.98
P = 0.0096
-1.0 -0.5 0.0 0.5
0 2 4 6 8 10
Naive CM TM
EM
R2 = 0.81
P = 0.10
mean Gag RNA copies/cell
in jejunum
Mean -∆∆Ct Jej relative to PB (SIV-infected animals)
FIG 5Correlation of expression of confirmed and putative restriction factors with the outcome of
infection in subsets of CD4⫹T cells. The relatively lower levels of expression of confirmed and putative restriction factors in CD4⫹T cell subsets in the jejunum compared to peripheral blood (PB) in uninfected animals (ΔΔCT) (A) and in SIV-infected animals (B) correlated with the level of SIV infection in jejunal CD4⫹ T cell subsets. Data for each CD4⫹subset represent the means of four uninfected animals and four infected animals.R2andPvalues were calculated using a two-tailed Pearson correlation.
on November 7, 2019 by guest
http://jvi.asm.org/
[image:10.585.44.369.72.208.2]This study utilized the advantages of the rhesus macaque/SIV model to understand the expression changes of confirmed and putative restriction factors in primary cells and cells from tissues that are difficult to study in humans, especially during acute infection. In particular, mucosal tissues are the primary site of transmission and the
major site for replication and CD4⫹T cell depletion in HIV/SIV infection (11–14). SIV
infection of CD4⫹T cells in peripheral blood is relatively infrequent (0.1 to 1%) during
acute SIV infection, whereas up to 60% of mucosal CD4⫹T cells can be infected during
this time (9, 13). Here, we observed increased levels of infection in each CD4⫹T cell
subset in the jejunum compared to peripheral blood, verifying mucosal CD4⫹T cells as
particularly susceptible targets. Although the precise mechanisms remain unclear, multiple hypotheses have been proposed to explain this increased susceptibility to SIV/HIV infection, including a greater proportion of CCR5-expressing cells, fewer naive cells, more activated cells with higher levels of transcription, the closer proximity of
target cells facilitating cell-cell spread, and additional factors, such as increased␣47
expression facilitating the binding of virions (34). We show here that in the CCR5-expressing transitional memory subset with the same phenotype from peripheral blood and the jejunum, cells from the jejunum expressed relatively lower levels of restriction factor genes, potentially contributing to their increased levels of infection.
Previous studies have measured the expression of a subset of the restriction factors included in this study under certain conditions. For example, PBMCs from HIV-naive
subjects stimulated with PHA induced upregulation of genes such asISG15,APOBEC3G,
and TRIM5(23). IFN-␣ treatment of HIV/HCV-coinfected patients resulted in the
up-regulation of a subset of restriction factor genes such asISG15 andTRIM19(PML), a
finding in agreement with our results (35, 36). However, these studies measured
restriction factor expression in either total PBMCs or total CD4⫹T cells. As shown in the
present study, restriction factor expression can vary significantly among different memory subsets. Therefore, analysis of the expression of specific restriction factors in specific populations of target cells may be more informative than analysis in bulk
populations of CD4⫹T cells.
We demonstrated dynamic modulation of restriction factor expression in CD4⫹T
cells due to differentiation, activation, IFN stimulation, and SIV infection. All forms of stimulation induced different patterns of expression of restriction factors. For example,
memory differentiation increased expression of allAPOBECfamily members, whereas
anti-CD3/CD28, IFN, and SIV infection increased the expression of only selectedAPOBEC
genes. Differential effects of stimulation suggest different mechanisms of regulation. Acute SIV infection is known to induce robust upregulation of interferon expression (16,
17). However, in vitro IFN stimulation induced the expression of only 32% of the
measured target genes, whereas acute SIV infection increased the expression of nearly every gene, suggesting that type I IFN alone is insufficient to account for the full range of expression modulation during infection. Previous studies have found a wide range of cytokine/chemokine production during acute SIV/HIV infection (37, 38), and future studies will be required to determine the specific contributions of these signals to regulation of expression of restriction factors.
Recent research shows that innate immune responses may be suppressed in the first days postinfection, allowing viral replication to progress (39). We showed here that nearly all of the analyzed confirmed and putative restriction factors increased in
expression in both peripheral blood and jejunum CD4⫹T cells at 10 days postinfection,
with ISGs exhibiting the greatest extent of upregulation. Although these restriction factors may play a role in inhibiting SIV replication, this dramatic upregulation does not occur until after systemic infection has been established. The kinetics of restriction factor expression changes during the earliest phases of acute pathogenic infection are still unknown, including whether cells at the earliest sites of viral replication display gene expression changes before peripheral cells. In addition, it is still unknown whether differences in restriction factor expression may underlie differences in susceptibility to infection at the organismal level.
Taken together, these data highlight the dynamic regulation of expression of
on November 7, 2019 by guest
http://jvi.asm.org/
restriction factors, which can be modulated by multiple factors, including cell differ-entiation, anatomic compartment, T cell activation, and acute SIV infection. Although other factors clearly play a role, modulation of expression of restriction factors is likely
to play a significant role in the wide range of differential susceptibility of distinct CD4⫹
T cell subsets to SIV infection. Future studies will be necessary to better to define the
roles of individual restriction factors to the susceptibility of primary CD4⫹T cells to SIV
infection.
MATERIALS AND METHODS
Animals.The eight Indian-origin rhesus macaque monkeys (Macaca mulatta) described in this study
were housed at the New England Primate Research Center (NEPRC) in accordance with the regulations of the American Association of Accreditation of Laboratory Animal Care and the standards of the Association for Assessment and Accreditation of Laboratory Animal Care International. All protocols and procedures were approved by the relevant Institutional Animal Care and Use Committee. Care met the guidance of the Animal Welfare Regulations, OLAW reporting, and the standards set forth inThe Guide for the Care and Use of Laboratory Animals(40). Euthanasia took place at 10 days postinfection using protocols consistent with the American Veterinary Medical Association (AVMA) guidelines.
Infection of four animals was performed intravenously with 500 50% tissue culture infective doses (TCID50) of SIVmac239 (generously provided by Francois Villinger, Emory University). The use of an intravenous route of inoculation ensured a reliable and synchronous infection with a well-studied disease course. Euthanasia took place at 10 days postinfection using protocols consistent with the AVMA guidelines.
Lymphocyte isolation.Peripheral blood samples were collected from unvaccinated healthy rhesus
macaques for purification of CD4⫹T cells. Blood was collected in EDTA Vacutainer tubes (Becton Dickinson, Franklin Lakes, NJ), and PBMCs were separated by density gradient centrifugation (lymphocyte separation medium; MP Biomedicals, Inc., Solon, OH). Jejunum tissue was isolated at time of euthanasia, washed with phosphate-buffered saline, separated into small pieces with a scalpel, incubated with 5 mM EDTA for 30 min, washed, and incubated with 15 U of type II collagenase (Sigma-Aldrich)/ml, followed by mechanical disruption with an 18-gauge feeding needle and filtration through 70-m-pore size cell strainers (BD Biosciences). Lymphocytes were then enriched by bilayer (35%/60%) isotonic Percoll density gradient centrifugation (1,000⫻g, 20 min), and the interface containing the lymphocytes was collected (41).
Antibodies and cell sorting.To purify naive and memory phenotypes, PBMCs were stained with
CD3 (SP34)-Pacific Blue, CD4 (L200)-FITC; CD8 (RPA-T8)-Alexa 700, CD28 (28.2)-ECD (Beckman Coulter), CD95 (DX2)-APC, CCR5 (3A9)-PE, and CCR7 (2D12)-PE-Cy7. Antibodies were obtained from BD Pharmin-gen unless specified otherwise. PBMCs were initially labeled with Live/Dead viability stain (Life Technol-ogies) and washed, followed by incubation with CCR7 antibody for 15 min at 37°C, then incubation with all other antibodies was done for 20 min at room temperature, and finally, the PBMCs were washed prior to sorting. Cell sorting was performed using a FACSAria II cell sorter (BD Biosciences). Sorts were⬎99% pure for all populations.
In vitrocell stimulation.CD4⫹T cell enrichment prior to stimulation with␣CD3/␣CD28 or IFN was performed using the CD4⫹T cell nonhuman primate isolation kit (Miltenyi Biotec). As verified by flow cytometry, purity was⬎95%. For anti-CD3/CD28 stimulation,␣CD3/␣CD28 beads were generated by coupling␣CD3 (FN-18) and␣CD28 (L293) antibodies with Dynabeads M-450 tosyl-activated (Thermo Fisher Scientific) in a 1:1 ratio according to the manufacturer’s instructions. Beads were added to cells in a 3:1 ratio for stimulation. For IFN stimulation, recombinant human IFN-␣A/D (Sigma-Aldrich) was added to cultures of freshly isolated and enriched CD4⫹T cells at a concentration of 1,000 U/ml. In both stimulation experiments, paired samples of unstimulated cells were used as controls.
Gene expression analysis.Real-time PCR assays specific for the indicated rhesus macaque genes
were purchased from Applied Biosystems (ABI) (Table 1). When not available, macaque-specific custom assays with FAM-MGB probes were designed using Primer Express 3.0 (ABI). The sequences for the custom assays were as follows:APOBEC3D, F-TCCCTGCACTGCAAGCTAAA, R-TGTGTGTGGATACATTGCCT TCA, and P-AGATTCTCAGAAACCC; APOL1, F-CTGGAGGCATCTTGCTTGTG, R-TCTTGCAAGTGCTTTGACTC GTA, and P-ATGTGGTCAGCCTTGT;APOL6F-AGGCAGAGGAAGAAAGTGAAGCT, R-TCGTCTTCACACAGAGG AACATCT, and P-TTGGTTTGGAAAGGGATGAG;HERC5, F-GGACATACAGATTATGATTGGAAAACA, R-TCACT ATGGTGGGATGTGAACTG, and P-TTGAAAAGAATGCACGTTATG;IFITM3A, F-GGCCAGCCTCCCAACTATG, R-GGGCGCCCCCATCAT, and P-AAGAGCACGATGTGGC;IFITM3B, F-AAACCGTCTTCCCTCCTGTCA, R-GCTACC TCATGCTCTTCCTTGAG, and P-CCCCCCAGCTATGAG;SLFN14, F-GAGGGTCTGCAACGACATTTG, R-GCTTCTT ACAGAGGGATTCTGGTT, and P-TTCCAGTGACACAGCAA;TRIM14, F-CAGCCAGGAGCCTGATCCT, R-CCGCT GCATCTCCTGCTT, and P-AGAGGCTTCAGGCATACA; andTRIM32, F-GGCCTCAATCTGGAGAATCG, R-AACC AATGGAAAAGCCACCTT, and P-CAGAATGAGCACCACCTG. The primer sequences for the SIVgagcustom assay were as follows: F-GUCUGCGUCAUCUGGUGCAUUC, R-CAAAACAGAUAGUGCAGAGACACCUAGUG, and P-CGCAGAAGAGAAAGUGAAACACACUGAGGAAG. All assays were confirmed to exhibit linear ampli-fication in an eight-point, 3-fold dilution series of rhesus PBMC cDNA.
Sorted cells were immediately frozen at ⫺80°C in RNA extraction buffer. RNA extraction was performed on thawed samples using a Qiagen RNeasy Plus Micro kit, RNA purity was confirmed using an Agilent RNA 6000 Pico Bioanalyzer kit, and conversion to cDNA was performed using ABI high-capacity RT with random hexamer primers. cDNA samples were diluted to 200 cell equivalents, linearly
on November 7, 2019 by guest
http://jvi.asm.org/
plified with gene-specific primers with an ABI Preamp master mix kit and pooled TaqMan assays, and analyzed on a Fluidigm BioMark microfluidic real-time PCR system using 96.96 dynamic arrays. This system allows for the simultaneous measurement of up to 96 assays in 96 different cDNA samples. Initial calculations of cycle thresholds (CT) were performed using the Fluidigm BioMark software version 4.1.3, and further analysis was carried out using GenEx software version 6 (MultiD Analyses [http://www
.multid.se]). Calculated ΔCTvalues, which were normalized to expression of a stable endogenous control
gene, for CD4⫹T cell subsets from uninfected and SIV-infected animals are presented in Dataset S1 in the supplemental material.
For SIV RT-PCR quantification, an eight-point 5-fold standard curve was constructed ofin vitro -transcribed SIVmac239gagRNA and used to interpolate the number ofgagRNA copies in each cell sample. Copies per cell were calculated based on the number of cells in the reaction.
Plasma viral loads.Plasma viral RNA levels were quantitated using real-time PCR, and SIV RNA copy
number was determined by comparison to an external standard curve (73, 74).
Statistical analysis. Statistics and graphing were performed using Prism (v6.05 for Windows;
GraphPad Software, La Jolla, CA) or R (75). Naive and memory CD4⫹T cell restriction factor expression was compared using repeated-measures ANOVA with an extension of the Benjamini-Hochberg correc-tion for multiple comparisons (76). PCA was performed using R and the funccorrec-tion hclust (75) with resulting axis coordinates and loading factors visualized in GraphPad Prism. Peripheral blood and jejunum memory subsets were compared using two-way ANOVA with an extension of the Benjamini-Hochberg correction method (77, 78). Aggregate peripheral blood and jejunum expression differences were assessed with a paired Studentttest. Pre- and postinfection differences were assessed using a two-way ANOVA with an extension of the Benjamini-Hochberg correction.
For all multiple comparison corrections, the R function p.adjust(), written by Gordon Smyth and implemented in the R package limma (77), was used. It is an extension of the original Benjamini-Hochberg methods, as updated by Storey (78).
SUPPLEMENTAL MATERIAL
Supplemental material for this article may be found at https://doi.org/10.1128/
JVI.02189-16.
DATA SET S1, XLSX file, 0.04 MB.
ACKNOWLEDGMENTS
We thank Francois Villinger (Emory University) for providing the SIVmac239 virus stock; Arnaud Colantonio for study coordination, Jackie Gillis and Michelle Connole for flow cytometry support, and Thomas Vanderford, Benton Lawson, and the Emory CFAR Virology Core for plasma viral load determinations. We thank Jeffrey Lifson (NCI-Frederick) for providing advice on the SIV PCR primers. We also thank Amber Hoggatt and other members of the NEPRC Division of Veterinary Resources for their expert animal care, and we thank Elizabeth Curran and other members of the NEPRC Pathol-ogy Division for their assistance.
This study was supported by National Institutes of Health (NIH) grants P51 OD011103 and P51 OD011132 and the Emory Center for AIDS Research (P30AI050409), as well as
funding from the Mucosal Immunology Group (http://public.hivmucosalgroup.org), which
is supported by a supplement to the HVTN Laboratory Program (UM1AI068618).
REFERENCES
1. Sheehy AM, Gaddis NC, Malim MH. 2003. The antiretroviral enzyme APOBEC3G is degraded by the proteasome in response to HIV-1 Vif. Nat Med 9:1404 –1407.https://doi.org/10.1038/nm945.
2. Stremlau M, Perron M, Lee M, Li Y, Song B, Javanbakht H, Diaz-Griffero F, Anderson DJ, Sundquist WI, Sodroski J. 2006. Specific recognition and accelerated uncoating of retroviral capsids by the TRIM5␣restriction factor. Proc Natl Acad Sci U S A 103:5514 –5519.https://doi.org/10.1073/
pnas.0509996103.
3. Neil SJ, Zang T, Bieniasz PD. 2008. Tetherin inhibits retrovirus release and is antagonized by HIV-1 Vpu. Nature 451:425– 430. https://doi.org/
10.1038/nature06553.
4. Van Damme N, Goff D, Katsura C, Jorgenson RL, Mitchell R, Johnson MC, Stephens EB, Guatelli J. 2008. The interferon-induced protein BST-2 restricts HIV-1 release and is downregulated from the cell surface by the viral Vpu protein. Cell Host Microbe 3:245–252.https://doi.org/10.1016/
j.chom.2008.03.001.
5. Laguette N, Sobhian B, Casartelli N, Ringeard M, Chable-Bessia C, Segeral E, Yatim A, Emiliani S, Schwartz O, Benkirane M. 2011. SAMHD1 is the
dendritic- and myeloid-cell-specific HIV-1 restriction factor counteracted by Vpx. Nature 474:654 – 657.https://doi.org/10.1038/nature10117. 6. Liu L, Oliveira NM, Cheney KM, Pade C, Dreja H, Bergin AM, Borgdorff V,
Beach DH, Bishop CL, Dittmar MT, McKnight A. 2011. A whole-genome screen for HIV restriction factors. Retrovirology 8:94.https://doi.org/
10.1186/1742-4690-8-94.
7. McLaren PJ, Gawanbacht A, Pyndiah N, Krapp C, Hotter D, Kluge SF, Gotz N, Heilmann J, Mack K, Sauter D, Thompson D, Perreaud J, Rausell A, Munoz M, Ciuffi A, Kirchhoff F, Telenti A. 2015. Identification of potential HIV restriction factors by combining evolutionary genomic signatures with functional analyses. Retrovirology 12:41.https://doi.org/10.1186/
s12977-015-0165-5.
8. Tripathi SK, Lahesmaa R. 2014. Transcriptional and epigenetic regulation of T-helper lineage specification. Immunol Rev 261:62– 83. https://
doi.org/10.1111/imr.12204.
9. Brenchley JM, Hill BJ, Ambrozak DR, Price DA, Guenaga FJ, Casazza JP, Kuruppu J, Yazdani J, Migueles SA, Connors M, Roederer M, Douek DC, Koup RA. 2004. T-cell subsets that harbor human immunodeficiency
on November 7, 2019 by guest
http://jvi.asm.org/
virus (HIV) in vivo: implications for HIV pathogenesis. J Virol 78: 1160 –1168.https://doi.org/10.1128/JVI.78.3.1160-1168.2004.
10. Chun TW, Chadwick K, Margolick J, Siliciano RF. 1997. Differential sus-ceptibility of naive and memory CD4⫹T cells to the cytopathic effects of infection with human immunodeficiency virus type 1 strain LAI. J Virol 71:4436 – 4444.
11. Veazey RS, DeMaria M, Chalifoux LV, Shvetz D, Pauley D, Knight HL, Rosenzweig M, Johnson RP, Desrosiers RC, Lackner AA. 1998. The gas-trointestinal tract as a major site of CD4 T lymphocyte depletion and viral replication in SIV infection. Science 280:427– 431.https://doi.org/
10.1126/science.280.5362.427.
12. Li Q, Duan L, Estes JD, Ma ZM, Rourke T, Wang Y, Reilly C, Carlis J, Miller CJ, Haase AT. 2005. Peak SIV replication in resting memory CD4⫹T cells depletes gut lamina propria CD4⫹T cells. Nature 434:1148 –1152. 13. Mattapallil JJ, Douek DC, Hill B, Nishimura Y, Martin M, Roederer M. 2005.
Massive infection and loss of memory CD4⫹T cells in multiple tissues during acute SIV infection. Nature 434:1093–1097. https://doi.org/
10.1038/nature03501.
14. Lackner AA, Mohan M, Veazey RS. 2009. The gastrointestinal tract and AIDS pathogenesis. Gastroenterology 136:1965–1978.
15. Veazey RS, Rosenzweig M, Shvetz DE, Pauley DR, DeMaria M, Chalifoux LV, Johnson RP, Lackner AA. 1997. Characterization of gut-associated lymphoid tissue (GALT) of normal rhesus macaques. Clin Immunol Im-munopathol 82:230 –242.https://doi.org/10.1006/clin.1996.4318. 16. Rahmberg AR, Neidermyer WJ, Jr, Breed MW, Alvarez X, Midkiff CC,
Piatak M, Jr, Lifson JD, Evans DT. 2013. Tetherin upregulation in simian immunodeficiency virus-infected macaques. J Virol 87:13917–13921.
https://doi.org/10.1128/JVI.01757-13.
17. Sandler NG, Bosinger SE, Estes JD, Zhu RT, Tharp GK, Boritz E, Levin D, Wijeyesinghe S, Makamdop KN, del Prete GQ, Hill BJ, Timmer JK, Reiss E, Yarden G, Darko S, Contijoch E, Todd JP, Silvestri G, Nason M, Norgren RB, Jr, Keele BF, Rao S, Langer JA, Lifson JD, Schreiber G, Douek DC. 2014. Type I interferon responses in rhesus macaques prevent SIV infection and slow disease progression. Nature 511:601– 605. https://doi.org/
10.1038/nature13554.
18. Pitcher CJ, Hagen SI, Walker JM, Lum R, Mitchell BL, Maino VC, Axthelm MK, Picker LJ. 2002. Development and homeostasis of T cell memory in rhesus macaque. J Immunol 168:29 – 43. https://doi.org/10.4049/
jimmunol.168.1.29.
19. Picker LJ, Reed-Inderbitzin EF, Hagen SI, Edgar JB, Hansen SG, Legasse A, Planer S, Piatak M, Jr, Lifson JD, Maino VC, Axthelm MK, Villinger F. 2006. IL-15 induces CD4 effector memory T cell production and tissue emi-gration in nonhuman primates. J Clin Invest 116:1514 –1524.https://
doi.org/10.1172/JCI27564.
20. Livak KJ, Schmittgen TD. 2001. Analysis of relative gene expression data using real-time quantitative PCR and the 2⫺ΔΔCT method. Methods 25:402– 408.https://doi.org/10.1006/meth.2001.1262.
21. Andersen CL, Jensen JL, Orntoft TF. 2004. Normalization of real-time quantitative reverse transcription-PCR data: a model-based variance estimation approach to identify genes suited for normalization, applied to bladder and colon cancer data sets. Cancer Res 64:5245–5250.https://
doi.org/10.1158/0008-5472.CAN-04-0496.
22. Battivelli E, Migraine J, Lecossier D, Matsuoka S, Perez-Bercoff D, Sara-gosti S, Clavel F, Hance AJ. 2011. Modulation of TRIM5␣ activity in human cells by alternatively spliced TRIM5 isoforms. J Virol 85: 7828 –7835.https://doi.org/10.1128/JVI.00648-11.
23. Raposo RA, Abdel-Mohsen M, Bilska M, Montefiori DC, Nixon DF, Pillai SK. 2013. Effects of cellular activation on anti-HIV-1 restriction factor expres-sion profile in primary cells. J Virol 87:11924 –11929.https://doi.org/
10.1128/JVI.02128-13.
24. Parlato S, Romagnoli G, Spadaro F, Canini I, Sirabella P, Borghi P, Ramoni C, Filesi I, Biocca S, Gabriele L, Belardelli F. 2010. LOX-1 as a natural IFN-alpha-mediated signal for apoptotic cell uptake and antigen presen-tation in dendritic cells. Blood 115:1554 –1563.https://doi.org/10.1182/
blood-2009-07-234468.
25. Henig N, Avidan N, Mandel I, Staun-Ram E, Ginzburg E, Paperna T, Pinter RY, Miller A. 2013. Interferon-beta induces distinct gene expression response patterns in human monocytes versus T cells. PLoS One 8:e62366.https://doi.org/10.1371/journal.pone.0062366.
26. Sanda C, Weitzel P, Tsukahara T, Schaley J, Edenberg HJ, Stephens MA, McClintick JN, Blatt LM, Li L, Brodsky L, Taylor MW. 2006. Differential gene induction by type I and type II interferons and their combination. J Interferon Cytokine Res 26:462– 472. https://doi.org/10.1089/
jir.2006.26.462.
27. Harris RS, Hultquist JF, Evans DT. 2012. The restriction factors of human immunodeficiency virus. J Biol Chem 287:40875– 40883.https://doi.org/
10.1074/jbc.R112.416925.
28. Rahm N, Telenti A. 2012. The role of tripartite motif family members in mediating susceptibility to HIV-1 infection. Curr Opin HIV AIDS 7:180 –186.https://doi.org/10.1097/COH.0b013e32835048e1.
29. Wang Y, Barbacioru C, Hyland F, Xiao W, Hunkapiller KL, Blake J, Chan F, Gonzalez C, Zhang L, Samaha RR. 2006. Large-scale real-time PCR vali-dation on gene expression measurements from two commercial long-oligonucleotide microarrays. BMC Genomics 7:59. https://doi.org/
10.1186/1471-2164-7-59.
30. Jovanovic M, Rooney MS, Mertins P, Przybylski D, Chevrier N, Satija R, Rodriguez EH, Fields AP, Schwartz S, Raychowdhury R, Mumbach MR, Eisenhaure T, Rabani M, Gennert D, Lu D, Delorey T, Weissman JS, Carr SA, Hacohen N, Regev A. 2015. Immunogenetics: dynamic profiling of the protein life cycle in response to pathogens. Science 347:1259038.
https://doi.org/10.1126/science.1259038.
31. Schwanhausser B, Busse D, Li N, Dittmar G, Schuchhardt J, Wolf J, Chen W, Selbach M. 2011. Global quantification of mammalian gene expres-sion control. Nature 473:337–342.https://doi.org/10.1038/nature10098. 32. Wang J, Wu G, Chen L, Zhang W. 2016. Integrated analysis of transcrip-tomic and proteomic datasets reveals information on protein expressiv-ity and factors affecting translational efficiency. Methods Mol Biol 1375: 123–136.https://doi.org/10.1007/7651_2015_242.
33. Cribier A, Descours B, Valadao AL, Laguette N, Benkirane M. 2013. Phosphorylation of SAMHD1 by cyclin A2/CDK1 regulates its restriction activity toward HIV-1. Cell Rep 3:1036 –1043.https://doi.org/10.1016/
j.celrep.2013.03.017.
34. Lackner AA, Lederman MM, Rodriguez B. 2012. HIV pathogenesis: the host. Cold Spring Harb Perspect Med 2:a007005.https://doi.org/10.1101/
cshperspect.a007005.
35. Abdel-Mohsen M, Deng X, Liegler T, Guatelli JC, Salama MS, Ghanem Hel D, Rauch A, Ledergerber B, Deeks SG, Gunthard HF, Wong JK, Pillai SK. 2014. Effects of alpha interferon treatment on intrinsic anti-HIV-1 immu-nity in vivo. J Virol 88:763–767.https://doi.org/10.1128/JVI.02687-13. 36. Pillai SK, Abdel-Mohsen M, Guatelli J, Skasko M, Monto A, Fujimoto K,
Yukl S, Greene WC, Kovari H, Rauch A, Fellay J, Battegay M, Hirschel B, Witteck A, Bernasconi E, Ledergerber B, Gunthard HF, Wong JK; Swiss HIV Cohort Study. 2012. Role of retroviral restriction factors in the interferon-alpha-mediated suppression of HIV-1 in vivo. Proc Natl Acad Sci U S A 109:3035–3040.https://doi.org/10.1073/pnas.1111573109.
37. Stacey AR, Norris PJ, Qin L, Haygreen EA, Taylor E, Heitman J, Lebedeva M, DeCamp A, Li D, Grove D, Self SG, Borrow P. 2009. Induction of a striking systemic cytokine cascade prior to peak viremia in acute human immunodeficiency virus type 1 infection, in contrast to more modest and delayed responses in acute hepatitis B and C virus infections. J Virol 83:3719 –3733.https://doi.org/10.1128/JVI.01844-08.
38. Xu H, Wang X, Morici LA, Pahar B, Veazey RS. 2011. Early divergent host responses in SHIVsf162P3 and SIVmac251-infected macaques correlate with control of viremia. PLoS One 6:e17965.https://doi.org/10.1371/
journal.pone.0017965.
39. Barouch DH, Ghneim K, Bosche WJ, Li Y, Berkemeier B, Hull M, Bhattacharyya S, Cameron M, Liu J, Smith K, Borducchi E, Cabral C, Peter L, Brinkman A, Shetty M, Li H, Gittens C, Baker C, Wagner W, Lewis MG, Colantonio A, Kang HJ, Li W, Lifson JD, Piatak M, Jr, Sekaly RP. 2016. Rapid inflammasome activation following mucosal SIV in-fection of rhesus monkeys. Cell 165:656 – 667. https://doi.org/
10.1016/j.cell.2016.03.021.
40. National Research Council. 2011. Guide for the care and use of labora-tory animals, 8th ed. National Academies Press, Washington, DC. 41. Abdel-Motal UM, Gillis J, Manson K, Wyand M, Montefiori D,
Stefano-Cole K, Montelaro RC, Altman JD, Johnson RP. 2005. Kinetics of expansion of SIV Gag-specific CD8⫹T lymphocytes following chal-lenge of vaccinated macaques. Virology 333:226 –238. https://
doi.org/10.1016/j.virol.2004.12.030.
42. Desimmie BA, Delviks-Frankenberrry KA, Burdick RC, Qi D, Izumi T, Pathak VK. 2014. Multiple APOBEC3 restriction factors for HIV-1 and one Vif to rule them all. J Mol Biol 426:1220 –1245.https://doi.org/10.1016/
j.jmb.2013.10.033.
43. Schmitt K, Guo K, Algaier M, Ruiz A, Cheng F, Qiu J, Wissing S, Santiago ML, Stephens EB. 2011. Differential virus restriction patterns of rhesus macaque and human APOBEC3A: implications for lentivirus evolution. Virology 419:24 – 42.https://doi.org/10.1016/j.virol.2011.07.017. 44. Hultquist JF, Lengyel JA, Refsland EW, LaRue RS, Lackey L, Brown WL,
![FIG 3 Differences in expression of confirmed and putative restriction factors in peripheral blood and jejunum CD4correction method])](https://thumb-us.123doks.com/thumbv2/123dok_us/141328.18472/7.585.45.407.70.428/differences-expression-conrmed-putative-restriction-factors-peripheral-correction.webp)