The views expressed in this report are the authors’ and do not necessarily reflect those of the Department for Education and Employment. © Crown Copyright 2001. Published with the permission of DfEE on behalf of the Controller of Her Majesty’s Stationery Office. Applications for
Pre-16 Work
Experience Practice
in England:
An Evaluation
Jim Hillage, Jenny Kodz, Institute for Employment Studies
and Geoff Pike, Employment Research
Acknowledgements
Contents
Summary v
1. Introduction 1
1.1 Aims of the study 1
1.2 Research approach 2
1.3 Report structure 5
2. Volume, Length and Timing 7
2.1 Volume of work experience and non-participation 7
2.2 Length of placement 9
2.3 It’s all in the timing 16
2.4 Conclusions 20
2.5 Key points 21
3. Organisation of Work Experience 23
3.1 The main approaches to providing work experience 23
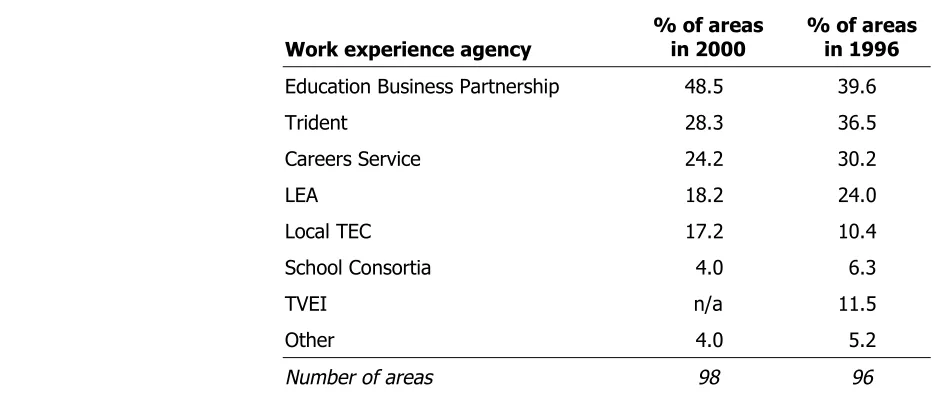
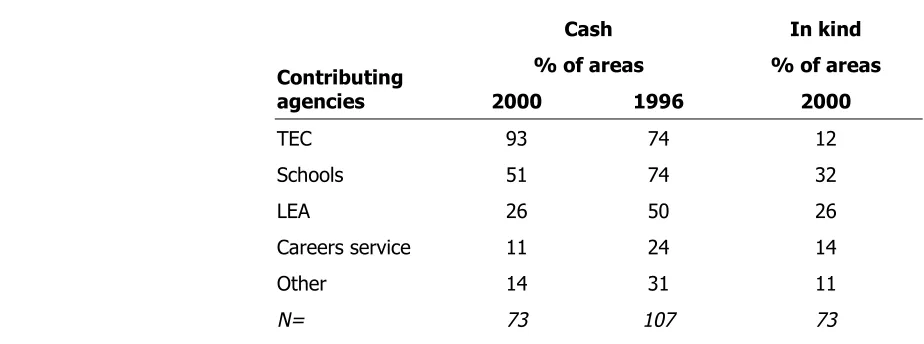
3.2 Role of external agencies 28
3.3 Management of work experience within schools 32
3.4 Costs of work experience 34
3.5 Conclusions 39
3.6 Key points 40
4. Finding, Checking, Matching and Preparation 43
4.1 Finding placements 43
4.2 Management of health and safety 53 4.3 Matching students to placements 59 4.4 Preparation for work experience 66
4.5 Effects of introducing GNVQ 73
4.6 Conclusion 73
4.7 Key points 74
5. Work Experience Placements 77
5.1 Pre-placement visits 77
5.2 Placements by sector 78
5.3 Tasks undertaken on placement 80
5.4 Placement quality 83
5.5 Teacher visits 84
5.6 Placement completion 87
5.7 Conclusions 89
6. Debriefing and Follow-up 93 6.1 Debriefing after work experience 93
6.2 Assessment and accreditation 96
6.3 Links to the wider curriculum 97
6.4 Changes since 1996 99
6.5 Conclusions 101
6.6 Key points 102
7. Value, Quality and Impact 105
7.1 Priority 105
7.2 Evidence of a better quality approach 106
7.3 Use of quality frameworks 107
7.4 Evaluation of work experience 109
7.5 The impact of work experience 109
7.6 Conclusions 118
7.7 Key points 118
8. Work Experience and Part-Time Work 121
8.1 Extent of part-time working 121
8.2 Differences between part-time work and work
experience 122
8.3 Conclusion 124
8.4 Key points 124
9. Conclusions 125
9.1 Good quality placements 125
9.2 Timing flexibility does not prevent summer bunching127 9.3 Are block placements still appropriate? 127
9.4 The best approach 128
9.5 What’s the impact? 129
9.6 Recommendations 130
Appendix 1: Research Methodology 133
A1.1 School co-ordinators survey 133
A1.2 Area based co-ordinators survey 137
A1.3 Case study research 137
A1.4 Student surveys 139
Appendix 2: Questionnaires 143
Summary
Background
The Department for Education and Employment (DfEE) commissioned the Institute for Employment Studies in partnership with Employment Research to undertake an evaluation of pre-16 work experience in England. The main aims of the evaluation were to assess current practice and particularly the effect of the policy changes implemented since the last major evaluation in 1996. The evaluation is based on surveys of school work experience ordinators and area work experience co-ordinators, surveys of students to assess the impact and experience of their placement and qualitative interviews of students, school staff, employers and intermediaries in five case study areas. The fieldwork was completed in the autumn of 2000 and the main findings of the study are summarised below.
Volume, length and timing
We found that over 95 per cent of students have been out on work experience in either Year 10 or 11 — around the same proportion as in 1996. Schools with intakes from higher socio-economic groups tend to get higher proportions of their students on placements.
The most common length of work experience remains two weeks — occurring in two-thirds of schools, with a quarter organising one week. The school survey data indicate that average placement length has risen slightly in recent years. Around 14 per cent of schools said that they had changed the length of placements over the past four years. Two-thirds of these (ie ten per cent of the total) had increased the length mainly from one week to two, normally with the aim of improving the quality of the placement. The student data indicate that there are some benefits to be gained from longer placements.
Most students (70 per cent) go on placements in Year 10, a higher proportion than in 1996. Nine in ten schools were aware that students were now allowed to go on work experience from the start of Year 10. Few schools had taken advantage of the new arrangements. The bunching of placements in the summer term of Year 10 is becoming more intense, with consequent problems for schools and employers trying to offer the maximum range of placements.
Organisation of work experience
The main methods of organising work experience are either a ‘joint’ approach, whereby schools and external agencies work together on finding, health and safety checking, and matching placements, or a more ‘centralised’ approach whereby a central agency is mainly responsible for these services. Very few schools take sole responsibility for organising work experience.
Since 1996, there has been an increase in the proportion of schools relying on a central agency to provide a health and safety checking service and also maintaining a database of employers. The main advantage of a centralised service is in reducing the burden on schools in terms of workload. A joint approach better enables schools to tailor placements to individual student needs. In centralised areas, work experience placements tend to be longer and less clustered in the summer of Year 10. The most common co-ordinating agency for work experience is the local Education Business Partnership.
Nearly half of the schools in the survey have a written policy on work experience and most of the rest include work experience within a careers education policy. More schools have developed work experience policy statements in recent years. There appears to be a positive link between the existence of a separate policy and more extensive preparation and debriefing.
The level of the person in school responsible for work experience varies. For instance, in one-fifth of cases, work experience is managed by a teacher with no or just one responsibility point, while at the other end of the scale in a further fifth it is the responsibility of a senior teacher. On average, the teacher responsible spends around 70 hours school time organising work experience and a further 50 hours outside school time. In addition, administration staff spend around 40 hours on work experience. The more time spent, the greater the time spent on preparation and the higher the proportion of students getting their preferred placement. Schools tend to spend less time organising work experience when they are part of a central system.
Finding placements
On average, just under half of the placements are found by a central body and around a further quarter each by schools and by students/families. Schools in more affluent areas are more likely to rely on students and their families to find placements. Our student survey data suggest that higher ability students are more likely to find their placements through their own contacts.
Nationally there appears to have been a general shift towards centralisation in terms of finding placements. The main advantage identified to schools of using a centrally held area database of placements, is that it reduces the workload for schools. It also avoids disadvantaging students who do not have contacts with employers, for example through their families. The advantage of students finding their own placement is that it helps develop job search skills. ‘Own find’ placements are also often thought to be of better quality and better tailored to individual needs.
A number of issues were raised in relation to finding placements, in particular: limited range of placements available, lack of good quality or challenging placements for high ability students, schools being in competition with each other for placements at peak times, and the increased demands on employers for placements.
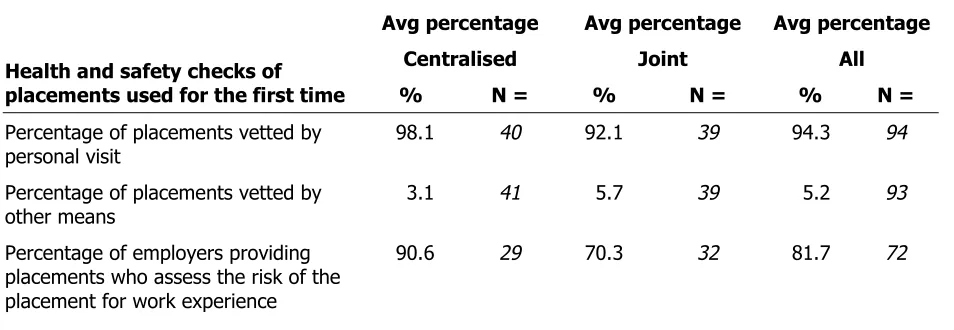
Health and safety checking
In most areas (approximately 80 per cent) a central agency is responsible for health and safety checking. On average, for over ninety per cent of placements an initial health and safety check is conducted by means of a personal visit. Since 1996, the proportion of health and safety checkers who have health and safety qualific-ations (IOSH and NEBOSH) has increased significantly. There was a general consensus that health and safety checking has improved over the past four years — although ten per cent of area and school co-ordinators still do not think arrangements are adequate.
Matching students to places
average, 70 per cent of students get their first choice of placements, but where a central agency is involved, a lower proportion of students get their first choice. Overall, schools and co-ordinators are satisfied with the range of choice students have. Just over half of area co-ordinators have taken positive measures to avoid students taking gender stereotypical placements. Further, over half of area co-ordinators report that most or all schools in their area took such measures. Despite this effort, 69 per cent of schools reported no change in the number of students taking non-gender stereotypical placements.
Pre-placement preparation
In most cases responsibility for work experience preparation lies jointly with careers and PSHE departments within schools or is an integral part of PSHE. On average seven lessons are used by schools for preparation activity; a typical lesson is one hour in length. School and area co-ordinators think that the quality of preparation in the school is good. Similarly, amongst students, there is a high level of satisfaction with pre-placement preparation. Most preparation time is devoted to health and safety. One in six schools do not discuss learning objectives with students prior to placements. Employers are rarely involved in placement preparation. Two-thirds of students visit the workplace prior to their placement — more where the placements are organised centrally.
Placements
The pattern of placements appears to have changed little since 1996. While there has been a decline in the proportion of placements taken in some sectors (eg banks, offices and health) there are rises in others (notably production, retail and leisure). There has been a slight narrowing of the gender gap in some sectors, eg production, legal and media. However, large differences remain in education and health, where placements are predominantly taken by girls. Higher ability students tended to be clustered in professional, legal, media and office environments. Students of lower academic abilities are more likely to be found in the education and production sectors.
While on their placement most students complete a daily diary and a log book. Fewer gather key skills evidence or interview people in the workplace. The more pre-placement preparation students do, the more likely they are to undertake a wider range of formal learning activities on placement.
Most respondents from schools and area agencies were satisfied with the quality of the placements provided. Four out of five students said that they were happy with their placement. Students who did an actual job and those with access to a computer were significantly happier than those who did not. The more challenging the placement, the more students were satisfied. Students on retail and leisure placements tended to be the least satisfied.
Most, but not all, students are visited by a teacher while on their placement; fewer where students find the placement themselves, probably because of the distance involved. Visits generally focus on ensuring diaries etc. are being completed, health and safety and on whether the placement matches up to the job description. Nearly all (98 per cent) of placements are completed, with lower proportions in schools with higher absence or exclusion levels. The main reason for non-completion was ‘inappropriate student behaviour’.
Debriefing and follow-up
In most schools, post-placement debriefing lasts at least two lessons, although rarely more than half a day. Six per cent do not conduct any formal debriefing. The more time a school allocates for preparation, the more time is spent on debriefing. Employers are included in debriefing arrangements in only a minority of cases.
Most students use their placement experience in their Record of Achievement and there is some form of assessment linked to the completion of their log book or diary.
Impact
Most schools attach a high priority to work experience and think the process worthwhile. While two-thirds of area co-ordinators believe that the priority given to work experience has remained the same since 1996, a quarter think it has risen.
We have some general evidence that the quality of work experience is improving, at least in terms of inputs, as schools have a larger number of practices associated with a good quality work experience process. Schools where work experience is centralised are likely to have a greater number of practices associated with a good quality work experience process than schools in other areas. Awareness and use of quality guidelines and frameworks is extensive among schools. There was widespread awareness of most of the main publications and they were generally felt to be useful. Although less prevalent, local quality standards were rated particularly highly.
Around 70 per cent of schools had evaluated their work experience programmes, commonly involving an assessment of staff and students’ views.
Schools generally felt that work experience promoted students’ personal and social development, enhanced their maturity and helped them develop an understanding of the world of work. Fewer saw impacts in terms of broadening students’ career horizons or helping their GCSE coursework. Schools with higher GCSE attainment rates saw greater impact than those with lower scores, particularly in relation to promoting students’ personal and social development, enhancing their maturity and motivating students to work harder in school.
Students also thought that work experience had an effect, particularly in terms of giving them a good idea of what work was like in their placement and, to a lesser extent, helping them decide about their career. Just over half (52 per cent) said that after their placement they felt more interested in doing well at school. Only one-fifth felt their placement was relevant to their school work. Comparing students’ views and attitudes to work and school before and after they went on work experience showed few differences apart from increases in the proportions who:
! felt it was important to sort things out and solve problems on their own at work
! were confident of working with adults and making friends at work
! recognised that having to use the telephone was a difficult task
Work experience versus part-time work
Three-fifths of students in our survey had some form of part-time job, generally something other than a paper round or baby-sitting. Most students thought work experience gave them a better idea of what work was like and more opportunities for skill development than part-time work. Teachers agreed, arguing that part-time jobs tended to be more narrowly focussed and much less interesting than work experience.
However, few students sought to capitalise on students’ experiences of part-time work and work-related learning activities.
Conclusions
The study was asked to address a number of key issues including: the quality of work experience; the timing of work placements; the value of block placements compared with more flexible arrangement or part-time work; and the overall impact of work experience on students. We concluded that:
! Most participants involved in pre-16 work experience are satisfied that placements and the pre- and post-placement processes are of good quality.
! We further conclude that quality has been improving, particularly in terms of pre-placement preparation, health and safety checking, teacher visits and placement completion rates.
! However, a minority of placements were not of good quality and there was still scope for improvement in many areas, especially:
• employer involvement in preparation and debriefing • integrating work experience within the curriculum • health and safety, and
• equal opportunities.
! The two-week block is generally felt to be the most appropriate way of delivering work experience to most students and is relatively organisationally efficient. Extended work placement, where provided, appeared to work well. Placements appear to offer a more wide-ranging experience of work and offer more learning opportunities than part-time work, although few schools capitalise on the potential of the latter in work-related learning.
vocational skill development. While it offers the opportunity to do so, positive outcomes were not picked up by this study. We were also asked to make recommendations for the enhancement of future work experience policy and practice. We would like to see:
! sustained funding and support for the organisation of placements in schools and through their partners in agencies
! wider recognition of work experience achievements through existing or (only if necessary) new mechanisms
! further guidance to teachers on the integration of work experience into the wider curriculum
! a more coherent approach to work-related learning in schools up to and beyond work experience
! further development of different models of experience, particularly for higher achievers, within the framework of a block approach
! employers in IT, design and other segments of the ‘new economy’ encouraged to offer places
! central agencies develop and regularly update databases of placement providers (ie employers) in their area — providing access to them on-line to schools
! further guidelines and best practice models disseminated showing employers, particularly smaller ones, easy ways to enhance placements
! employers encouraged to participate in the whole work experience programme, not just placement provision
! employers encouraged to provide access to IT, with schools or work experience agencies developing materials for students to do on computer
! schools encouraged, with funding if available, to avoid placements at the end of Year 10
! local education business link organisations organise good practice exchanges between school (and area) co-ordinators
! central agencies identify and work with schools where provision remains inadequate.
1.
Introduction
In this opening chapter we set out the aims of the study, outline our approach and describe how the rest of this report is structured.
1.1
Aims of the study
In January 2000, the Department for Education and Employment (DfEE) commissioned the Institute for Employment Studies, in partnership with Employment Research, to undertake an evaluation of pre-16 work experience with the aims of:
! assessing current work experience policy and practice in England, particularly the impacts of policy changes implemented since the last major evaluation in 1996 (Hillage et al., 1996)
! informing the development of policies to further enhance the quality of work experience.
More specifically, a number of detailed objectives were agreed for the evaluation, involving making assessments of:
! the quality of work experience placements
! awareness and impact of QCA/DfEE guidance
! the new flexibility on the timing of work placements
! the relationship between the ‘traditional’ block placements and other similar activities
! the impact of work experience
! the costs and benefits and drawbacks of various approaches to the organisation of work experience, and
! recommendations for the enhancement of future work experience policy and practice.
During the course of the evaluation a further specific area of interest was identified and it was agreed that the evaluation would also assess:
! the value of block work experience compared with more flexible placements tailored to individual needs.
1.2
Research approach
So that we could build up a comprehensive picture of pre-16 work experience, we used a number of research methods including qualitative interview based research, and quantitative survey based methodologies, and collected data from a range of people involved in the provision of work experience.
The main methods involved:
! a nationwide survey of school work experience co-ordinators
! a nationwide survey of area work experience co-ordinators
! comprehensive case studies in five areas of England, each involving:
• interviews with teaching staff in five schools
• interviews/discussion groups with students in the five schools
• three separate surveys with the students • interviews with intermediaries and employers.
Below we briefly discuss each of the approaches in turn. More details of our methodology appear in Appendix 1.
1.2.1
The school co-ordinators survey
The sample for the survey of work experience co-ordinators in schools (henceforth referred to as the school co-ordinators survey) was taken from the Register of Education Establishments (REE) and comprised:
! one in three randomly selected secondary schools
! all the schools in the five case study areas being visited during the course of the qualitative fieldwork research.
The final total sample included 1,091 schools. In the absence of a database giving names of school work experience co-ordinators all questionnaires were mailed to ‘The Work Experience Co-ordinator’.
The survey asked questions about:
! the provision of work experience, when it took place and for how long
! the preparation and debriefing programmes
! the costs of organising the placement
! support received from central agencies
! quality issues and outcomes, and the perceived value of work experience.
Nearly two-thirds (63 per cent) of all schools in the sample returned their questionnaire. We compared the characteristics of the schools that responded with the whole population. We found that schools with a high proportion of students eligible for free school meals were significantly less likely to have responded to the survey, and conversely those schools with low free school meal eligibility were more likely to have responded.
Free school meals (FSM) is clearly a key variable and is demonstrably correlated with a number of other school back-ground variables and school outcome variables. For this reason, and the fact that some important research issues are associated with issues of disadvantage, there is a potential bias in the data. To compensate for this difference between the respondents and the population of schools in England it was decided to weight the data. This results in a response set that much more closely reflects the population of schools in England. All data presented for the school co-ordinators survey in the remainder of this report are weighted to account for these differences.
1.2.2
Area co-ordinators survey
! background information about the area covered
! provision of work experience placements
! the number and timing of placements
! approaches to organising work experience placements
! management of health and safety
! support provided by central agencies to schools
! costs and funding of placements
! quality issues and outcomes, and
! changes to work experience since 1996.
1.2.3
The case studies
Five area-based case studies were conducted. The five areas were the same as those used in the 1996 study (with the exception of the area in Wales, as this study covered England only). It was agreed at the outset that the identity of the areas would not be disclosed, to maximise the confidentiality of the interviewees. Between them the areas represent a mix of communities (eg urban/rural with a geographical spread), and different lengths and forms of organising work experience.
In each area we visited five schools, where possible the same schools involved in the previous research. In each school we interviewed the work experience co-ordinator, a senior school manager responsible for the work-related curriculum, one or two year 10/11 teachers (eg head of year or a form tutor) and a selection of pupils who had recently been out on work experience (either separately or in a mini focus group). In all we collected data from approximately 80 teaching staff and 130 students.1
In addition, two surveys of students were administered.
! A student impact survey was developed comprising:
• a ‘before’ survey distributed to a sample of students in each case study school, generally in March 2000, prior to the students going out on work experience asking for their attitudes to work and school, and knowledge and experience of a range of work-related issues. Responses were received from 1,154 students from 24 of the 25 participating schools. Schools were asked to provide some background biographical data for each student participating in the study. This included SAT scores and, as an indicator of socio-economic status, free school meal information (data were received for 750 students). We
asked for absence data but these were provided by only a small number of schools and have not been used in the subsequent analyses.
• an ‘after’ work experience survey which was administered in early July. Schools were sent batches of questionnaires addressed individually to each participating student, for completion before the end of term. Four schools where work experience was timed for autumn Year 11 acted as a control group for the research, completing both surveys prior to their work experience. In total, 826 students completed the after survey, of which 666 completed their work experience before the survey and 120 were yet to do their work experience (the control group).
! finally, 801 students completed a third questionnaire seeking information about their period of work experience — the work experience student process survey.
In all, 742 students completed all three questionnaires.
The final element of the case studies involved interviews with representatives from five intermediaries (such as EBPs, LEAs, TECs, Careers Services etc.) and five employers in each area. The case study visits and interviews took place between May and November 2000. The case study data have been used thematically, to explore issues raised by the two co-ordinator surveys. The case studies have not been written up separately.
1.3
Report structure
Findings from all aspects of the research are presented in the following eight chapters. It is worth noting that all differences between groups of schools presented in this report are statistically significant to at least 95 per cent confidence level. The rest of the report is structured as follows:
Chapter 2 explores the numbers involved and organisation of work experience, giving an idea of the survey coverage, the proportion going out on work experience, when and for how long, reasons for non-participation and briefly looks at the extent of ‘extended work experience’.
Chapter 3 discusses the organisation of work experience at area level and at school level. On the former we examine different forms of organisation from centralised systems to school based. At school level we explore the management and costs involved in organising pre-16 work experience, looking at the nature of school policies and how it is co-ordinated within schools.
lies for these activities, how much preparation takes place and the degree of choice students receive in selecting their placements. Chapter 5 looks at the actual work placements themselves; the range of tasks asked of students by their schools, school views of the quality of work experience placements. Also covered are issues around placement monitoring and completion of placements. Chapter 6 presents data on the extent of debriefing and integration of work experience in schools, who is involved in this process, what is done and how much.
Chapter 7 looks at three important issues underpinning the evaluation and draws together our data on the value, quality and impact of work experience.
Chapter 8 is devoted to the specific issue of the different learning experiences gained by students from their part-time work compared with work placements.
2.
Volume, Length and Timing
In this chapter we look at the overall scale of work experience — the numbers of students involved, why some students do not participate, and the length and timing of placements. The chapter also briefly discusses extended work experience.
2.1
Volume of work experience and non-participation
Respondents to the school co-ordinators survey reported that on average 97.2 per cent of the relevant year group went out on work experience. The average number of students going out from each school is 170, with 25 per cent of schools sending out less than 125 each year and 25 per cent sending out more than 200. The most any school responding to the survey reported sending out is 400 students.The area co-ordinators survey found that the average proportion of the cohort going out on work experience was 95 per cent, ie slightly lower than that estimated by the school data. This is likely to be a more reliable estimate as schools providing less work experience were probably less inclined to respond to the school co-ordinators survey. Based on this average of 95 per cent, we estimate that of the Year 11 cohort covered by the survey, 407,500 will have been on a work experience placement by the end of the academic year, and 20,000 will have not.
2.1.1
Changes since 1996
These data are not directly comparable with the responses from the 1996 survey of area co-ordinators’ as in the last survey special and independent schools were included. The 2000 survey also received a higher response rate — 79 per cent as compared with 70 per cent. Nevertheless, the two surveys show similar proportions of the year group taking work experience, as the average proportion reported in 1996 was 95 per cent.
2.1.2
Students not going out on work experience
likely to be in schools in areas of social disadvantage — as indicated by eligibility for FSM. Also, schools with lower GCSE attainment, higher absence rates, EAL and SEN support needs tend to have higher non-participation rates. Variation here is also apparent by school size and type.1
To present the data, the non-attendance has been conflated into three categories — schools reporting 100 per cent attendance, schools reporting low non-attendance of one to two per cent, and schools reporting higher non-attendance at more than two per cent. Table 2.1 highlights the main findings.
Schools with higher proportions of students eligible for free school meals (FSM) reported significantly higher proportions of students not going out on work experience. Schools with fewer than ten per cent of students eligible for FSM reported 1.8 per cent of their students not going out, while those with 30 per cent or more eligible for FSM reported an average of 5.6 per cent of students not going out. A similar difference was apparent between schools with low absence rates compared to those with high absence levels. It would therefore seem that schools with higher socio-economic intakes get a higher proportion of students out on placement. These data are given further clarification when we look at the reasons schools give for work experience non-attendance. The main ones are:
1 Schools in more deprived areas with high proportions of disadvantaged students are more likely to be smaller schools, 11-16, not surprisingly in Special Measures or an Education Action Zone and comprehensive. It is worth noting when considering the main features of any variation displayed.
Table 2.1: Proportion of students not going on work experience — percentages of schools in Special Measures with high eligibility for FSM and high absence rates
Percentage of students NOT going out on work experience
None
(0%) 1-2% than 2%More Base =100%
All Schools 35 35 30 669
Large schools (more than 200 to place) 28 42 30 216
Schools offering GNVQ 25 38 37 291
Schools with more than 22% students with SEN 25 32 43 215
Less than 35% gaining 5 A-C grades 20 26 54 196
Schools with more than 30% eligible for FSM 19 26 55 124
Schools with more than 10% sessions missed in 1998/9 16 28 56 169
Schools in Special Measures 0 45 55 11
! Inappropriate student: this included disapplied, disaffected, behavioural problems etc. — 42 per cent of all reasons given for non-participation. Schools in more deprived areas with more problematic student intakes and with high absence rates are much more likely to give this reason.
! Student/parent decision: this might include illness, holiday, parental prerogative or simply student refusal — cited more often by schools in more affluent areas — 31 per cent of all reasons given.
! Simple absence: failing to meet deadlines, apply or not turning up — 17 per cent.
! School decision: four per cent — eg interfering with coursework or GCSEs or the cost involved, and
! Employer decision: five per cent, cancellation or placement falling through.
As reported in the next section, schools with two-week placements appear to have better participation rates than those lasting one week. It is notable that the students most likely to miss out on work experience are those perhaps most likely to benefit, ie students who are disaffected from school but could be motivated by an appropriate placement.
Finally there appeared from the case studies to be a correlation between the commitment in the school to work experience and the number of students experiencing a satisfactory placement. One of the schools visited had chosen to adopt an increasingly low key approach to the provision of work experience. In practice this meant that students were required to manage their own work experience process more and more. Last year, 25 per cent of students found their own placements. The remainder were given deadlines for the completion of forms (including placement preferences) and a number of general reminders. If they failed to supply the necessary paperwork they lost their opportunity for work experience. This has meant that the numbers of pupils not going out on work experience doubled in the last two years (from six or seven to 20).
2.2
Length of placement
This section of the chapter deals with the length of work experience placements and in the next we look at timing. In both sections we highlight where any changes have taken place over the last four years.
2.2.1
Length of work experience
one-week block and five per cent use a three-one-week block. A further three per cent use a combination and two per cent have some other format for organising their work experience.
The area co-ordinators questionnaire also asked respondents what proportion of students in their area had placements of one, two or three weeks. Reflecting the school data, on average just over two-thirds of students had placements of two weeks, just over a quarter had one week and six per cent had three-week placements (Table 2.2).
The school survey data show that schools with higher absence rates, poorer GCSE performance, in more deprived neighbour-hoods with higher proportions of SEN, in EAZs and with comprehensive admissions policies are all more likely to offer two-week placements than is the case for schools in more affluent areas.
2.2.2
Alternative arrangements
The surveys found a few schools (under one per cent) with alternative ways of organising placements including two one-week blocks at separate times in Years 10 and 11, two consecutive but different one-week blocks and eight-day placements.
For example, one of the schools in the case studies organised two one-week placements, normally in May/June of Year 10 and one in the October of Year 11. However, this year, the Year 10 block took place in February due to timetabling commitments, which meant finding and setting up placements over the Christmas period. The school believes that two separate weeks offers a much wider experience of the world of work.
2.2.3
Extended work experience
Since 1996, schools have been permitted to organise ‘extended work experience’ where students undertake a period of work experience, sometimes in harness with work related training, for a Table 2.2: Average percentage of students undertaking work experience by length of
placement, in 2000 and 1996
Length of placement
Mean proportion of students
2000
Mean proportion of students
1996
One week 26.0 25.5
Two weeks 67.9 67.8
Three weeks 5.7 5.8
Other 0.4 0.8
Based on 99 areas Based on 102 areas
day or more per week for several weeks or more during their last two years of compulsory schooling. Schools were asked to indicate firstly whether or not they operate such a programme, and secondly the numbers of students involved and reasons for their involvement.
Over half the schools responding (55 per cent) said that they organise a programme of extended work experience. Use of extended work experience is, on average, concentrated in those schools with: high proportions of white and SEN students, mixed sex (only 24 per cent of girls’ schools offer extended work experience, compared to 32 per cent of boys and 60 per cent of mixed schools) and non-denomination schools. A similar pattern is also noticeable for schools with higher absence rates and numbers of exclusions. Schools in Education Action Zones and in Special Measures are also more likely to offer this form of work experience, although the numbers in these cases are still small. Interestingly, the socio-economic environment, in terms of free school meal (FSM) eligibility, of the school has little or no bearing on whether or not the school offers this form of work experience. Only four per cent of selective schools offer extended work experience.
In those schools offering extended work experience, 70 per cent offer traditional ‘block’ work experience to these students in all cases and a further 24 per cent indicate that they offer it in some cases. Here there was little variation by type of school, although schools with lower proportions of students with FSM were significantly more likely to offer both forms of work experience to all students. In the case study schools, extended work experience students generally found a block placement at the workplace they already attended.
In terms of the numbers involved, over 2,200 extended placements were provided by the 370 schools — an average of around six per school. Two schools provided more than 100 placements. The most common reason for offering extended placements was to address disaffection and disillusionment among students who were not achieving in school and at risk of exclusion or motivational problems. Some schools were also providing it for GNVQ provision and, more generally, as an alternative curriculum.
Example of an extended work experience scheme
and practical. In school students are in groups of seven and much time is spent monitoring and mentoring students. A Youth Awards Scheme is being introduced next year. The school thought the scheme was working well and one respondent said that:
‘We think the scheme is very successful and has an impact in many different ways. Main visible change is that the students show huge improvements in social skills in Year 10 and seem more interested in school. But also it has the advantage of taking out some of the more difficult students from class so the remainder of the year group is also starting to do better’.
Other schools in the area operated other systems of extended work experience. For example, one runs a programme where students are identified during Year 10 with block work experience being used as a means to determine suitability and an appropriate partner for the work experience element of the package. In Year 11 these students (12) are disapplied from parts of the National Curriculum, doing a separate course in school focusing on work skills, life skills, CVs etc. They spend two days on placement, two days in school and one day at college. This is a pilot scheme and so far the school has found the two days undertaken in school to be somewhat problematic. Issues for the future include the cost of college places, and funding it properly so that it has credibility and is not just a way to deal with difficult students.
In another of the case study areas a similar programme has been in operation for the past three years. Students with behavioural or attendance problems who are ‘doing nothing for themselves nor for others around them’ are identified in Year 9 or Year 10 for an alternative programme outside the National Curriculum. This involves a part-time timetable at school, covering the core subjects, courses provided by a local training provider and one or two days per week at an employer. These students go out on block work experience at the same time as all others in the schools. Each student has the choice whether their block work experience takes place at the same employer as their extended placement. In two of the other case study areas, none of the schools visited offer extended placements. This is either due to lack of demand in high academic achieving schools or the small size of the school, or because a programme of extended placements is still in the planning stage.
2.2.4
More flexible options
The key advantage of the universal block placement approach over other more flexible arrangements was that it was relatively easy to organise. More tailored arrangements, eg involving more regular or longer visits to employers were felt to be difficult to organise with employers (who would need to provide a more structured programme) and in school — in maintaining a timetable to meet GCSE requirements.
2.2.5
Changes in length of placement since 1996
As shown in Table 2.2, the average lengths of placements by area have changed little since the previous area co-ordinators survey was conducted in 1996. However, these general figures may mask a degree of change at school level. Our school survey data show that overall, 14 per cent of schools had changed the length of their work experience placement since 1996. Of these schools, 36 per cent had reduced the length of their placement and 64 per cent had increased the length. Thus the school data suggest a slight shift towards longer placements which may not have been yet picked up at area level.
Approximately one-half of those that had reduced the length of their placement had moved from a three-week placement to a two-week placement, the remainder going from two to one or making only minor changes to the length. Of those that had increased the length, 78 per cent had moved from one week to two weeks, one school had moved from two- to three-week placements, and the others had made minor changes to the length (one day). One in ten schools that had altered the length of their placements had changed to a combination of lengths.
There was very little difference between different types of schools in whether or not they had changed the length of the placement offered. Schools with better GCSE scores were slightly more likely to have changed the length of placement, but those changing the length were equally likely to have increased the length as those schools with lower GCSE scores.
The reasons given by schools increasing the length of placement, centred on:
! improving the quality of experience (53 per cent of cases mentioning aspects of placement quality)
! central body decision (40 per cent) especially if Trident have assumed control of the school’s organisation of work experience.
placements as a reason for reducing the length. In the words of one school:
‘[Work experience is] a very valuable experience. Disappointed that we have gone from 15 days to ten days — GCSE pressure for time and Trident pressure for placements.’
Schools with a central body are less likely to have changed the length of placement since 1996, but where a change has occurred, are more likely to have reduced the length compared to those not using a central agency.
In one case study area there has been a concerted effort in increasing the proportion of two-week placements (in the last four years the proportion has increased from five to 25 per cent). The LEA (contract holder) and the TEC are keen to see a further increase, and three of the schools visited seem close to introducing two-week placements. Schools in the area are highly autonomous and the LEA sees the most appropriate way forward to:
‘gently encourage and persuade and slowly more will shift to two weeks — the national agenda is also persuading more schools to go to two-week placements and we think that once a certain number convert the rest will soon follow.’
In another area where three-week placements were the norm schools reported increasing pressure to cut the length to two weeks to accommodate other curriculum priorities. One school was thinking of having a two-week placement for all and an optimal third week for those who would benefit.
2.2.6
Is longer better?
Schools tend to defend the length of their placement quite vigorously. Although we did find some evidence of a trend towards a two-week norm, those with one week tended to argue that:
! during one week pupils become motivated, and do not lose interest as they may do if the placement were any longer:
‘There is nothing better than a pupil leaving a placement and wanting more.’
! pupils are not going to learn any more in two weeks than in one. Work experience is about key skills and not learning a job. Proper training takes months
! pupils can soldier on to the end of one week, if they are unhappy, or the placement is not suitable
! employers are better able to structure a week, and there are more places to go round.
view of work and a workplace. One week is ‘too much of an initiation experience and not enough of a work experience’.
Similar arguments are applied to three-week placements, ie the first week is used to ‘settle in’, the second to ‘get to grips with the job’ and week three ‘to get the benefit’. The general argument was that a longer placement was more like ‘real work’ and less of a ‘taster’ and that students were more likely to undertake real tasks in longer placements. That said, some of the schools we visited with three-week placements were questioning the marginal utility of the extra week.
In the school survey, schools offering two-week placements report lower non-participation rates than schools providing one week placements (Table 2.3). This is despite the fact that the main cause of non-participation is considered to be ‘inappropriate students’, ie behavioural problems, special needs and disaffection, more prevalent in schools from deprived neighbourhoods which tended to show higher non-participation rates. This suggests that schools operating two-week placements are much more likely to get all their students out than is the case for one week placements — whoever the students are — and may be indicative of the priority attached to the process.
There is little difference between the levels of satisfaction with their placement reported by students on one, two- or three-week assignments. However, the data do suggest that those on longer placements are more likely to ‘have an opportunity to show people what they can do’ and to ‘find the placement challenging’ and to think that their placement gave them ‘an idea of what work is like’. On the other hand, students on one week placements were more likely to think their placements were ‘not long enough’, compared with those who went out for two or three weeks (55 per cent compared with 40 per cent and 42 per cent respectively). In one area where a number of schools only go out for one week, the students interviewed wanted to stay out longer:
‘One week is not really enough. You don’t get to do anything or apply what you’ve learnt. You’re just getting used to it and start to get some responsibility and then its over.’
Table 2.3: Proportion of students not participating in work experience by length of placement (percentages)
Length of Placement
1 week 2 weeks 3 weeks Other All Schools
All went out 30 39 37 12 35
1-2 % did not go out 37 33 43 51 35
More than 2 % did not go out 33 28 20 37 29
Base N = 100 % 158 447 35 33 673
Two-week placements are more likely to occur in the summer term of Year 10 than one or three-week placements (see Section 2.3).
2.3
It’s all in the timing
Looking at when placements occur, it is apparent that the summer term of Year 10 is becoming increasingly popular.
Figure 2.1 shows the weeks students return to school after work experience by year group. This is based on the school co-ordinator survey data and clearly shows the peak in work experience placements during the summer of Year 10.
From the area co-ordinators data (Table 2.4), we estimate that of the Year 11 group of students covered by the survey:
! one per cent take work experience in the autumn of Year 10
! five per cent in the spring of Year 10
! 64 per cent in the summer of Year 10
! 27 per cent in the autumn of Year 11
! three per cent in the spring of Year 11, and
! two per cent in the summer of Year 11.
[image:28.595.60.526.529.757.2]While there are some minor differences between the two surveys (due to sampling differences and the nature of the questions asked) they indicate the same overall pattern with a concentration at the end of Year 10, seeping into the beginning of Year 11. However, the proportion of students going out in the summer term has risen from 55 per cent to 64 per cent.
Figure 2.1: Percentage of work experience students returning to school by weeks of the academic year
0% 5% 10% 15% 20% 25% 30% 35%
Jan Yr10 Feb Yr10 Mar Yr10 Apr Yr10 May Yr10 Jun Yr10 Jul Yr10
Aug
Sep Yr11 Oct Yr11 Nov Yr11 Dec Yr11 Jan Yr11 Feb Yr11 Mar Yr11 Apr Yr11 May Yr11 Jun Yr11 Jul Yr11 Week students returned to school
Percentage of work experience students
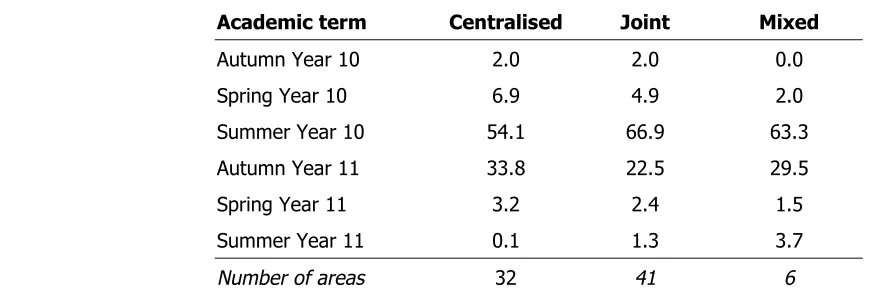
The school survey data show that schools providing a two-week placement were most likely to conduct work experience in Year 10 while schools doing it in Year 11 were more likely to provide one week placements or, interestingly, three-week placements (Table 2.5).
2.3.1
Awareness of law change in timing
Two years ago schools were allowed to start sending students on work experience from the beginning of Year 10. Previously they had had to wait until after Easter in Year 10 before being able to go on work experience. The surveys aimed to establish firstly the awareness of this change in the law, and secondly how schools had responded to the change.
All area co-ordinators except one (99 per cent) were aware of the change in the law. In the school co-ordinators survey, nearly nine out of ten respondents (89 per cent) were aware at the time of the survey that the law had changed with little or no difference between types of schools. Schools which had increased the length of their placement were slightly more aware of the law change Table 2.4: Average proportion of students undertaking work experience, by academic term, in 1996 and 2000
Timing of placement
Mean proportion of students
2000 %
Mean proportion of students
1996 %
Autumn term Year 10 1.2 n/a
Spring term Year 10 4.5 n/a
Summer term Year 10 63.6 55.4
Autumn term Year 11 26.5 34.6
Spring term Year 11 2.6 6.7
Summer term Year 11 1.5 3.8
Based on 84 areas Based on 98 areas
Source: Pre-16 Work Experience — Survey of Area Co-ordinators, IES/ER 2000 and Survey of Area Co-ordinators, IES, 1995/96
Table 2.5: Proportion of students participating in work experience by academic term and length of placement (percentages)
Length of Placement
1 week 2 weeks 3 weeks Combination All Schools
Year 10 55 78 57 61 71
Year 11 45 22 43 39 29
Base N = 100% 156 448 37 23 664
than those which had decreased the length or made no change (97 per cent compared to 82 per cent of those that had decreased the length of placement).
Over one-third (39 per cent) of area co-ordinators reported that one or more schools in their area had responded to the change in the law by moving work experience to earlier in Year 10. However, in most areas (80 per cent) it was only three schools or fewer that had responded in this way. The average proportion of schools in each area that had moved work experience to earlier in Year 10 was less than ten per cent (9.7 per cent).
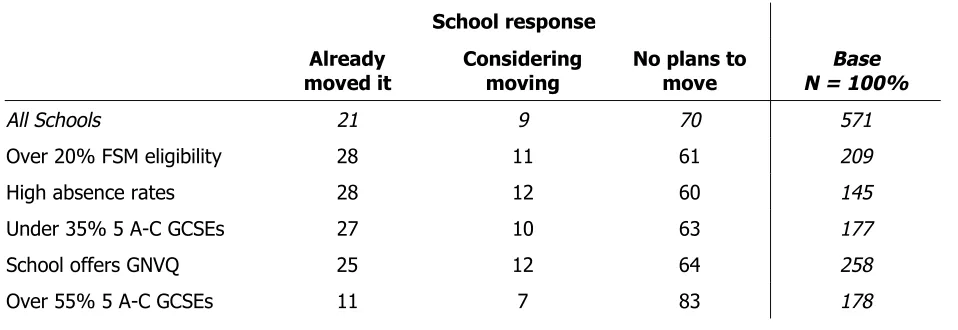
The school survey found significant variation between schools which were aware of the law change in their response to it (Table 2.6). Those schools offering GNVQs, with lower GCSE attainment, higher absence levels and in more deprived neighbourhoods were most likely to have changed the timing of their work experience, with the proportion of students eligible for free school meals seemingly the main associated variable.
A number of interviewees were sceptical about the maturity of young people earlier in Year 10 and whether they would gain maximum benefit from a placement. Some of the students who went out in Year 11 felt that to go out earlier would not have been beneficial. One said that:
‘I don’t think a lot of us are mature enough in Year 10 for work experience. I’m glad we do it now. It also gives us a break from the pressure of GCSEs.’
2.3.2
Changes in timing since 1996
[image:30.595.52.531.87.252.2]Table 2.4 compares findings from the 2000 area co-ordinators survey with that of 1996, with regard to timing of work experience. Caution should be taken in interpreting these data, in that the 1996 survey included responses relating to independent and Table 2.6: School responses to the change in law allowing earlier work experience:
percentages by school characteristics
School response Already
moved it Consideringmoving No plans tomove N = 100%Base
All Schools 21 9 70 571
Over 20% FSM eligibility 28 11 61 209
High absence rates 28 12 60 145
Under 35% 5 A-C GCSEs 27 10 63 177
School offers GNVQ 25 12 64 258
Over 55% 5 A-C GCSEs 11 7 83 178
special schools, whereas in 2000 these were excluded. This inconsistency notwithstanding, it appears that work experience is generally being conducted earlier. The comparison indicates that the proportion of students taking work experience in the summer of Year 10 has increased. We estimate that the proportion of the year group taking work experience in Year 10 has increased from 55 per cent to 64 per cent.
2.3.3
Why change the time?
Most of the schools who had changed the timing of their work experience had moved to earlier in Year 10, although no schools responding to the survey had moved to the autumn term.
About one in four schools who had changed their dates in response to the law change had moved to the spring term in Year 10, one-third had moved to the first half of the summer term and a further third had moved to the second half of the summer term. About one in ten had moved to autumn/winter Year 11.
Those schools who had changed the length of their work experience were more likely to have changed the timing (Table 2.7 highlights this).
The reasons for moving work experience were very similar to those presented for changing the length. Those that had decreased the length and changed timing tended to identify curriculum and GCSE pressures as the main reasons, more often than not going for a shorter placement in Summer Year 10. Those that had increased the length and changed timing were more likely to identify issues of quality and placement availability and were more likely to move to early Summer/Spring Year 10.
One school in the case studies had moved away from the end of the summer term to the first few weeks in June to allow more time for debriefing and review on return to school. Another had moved its three-week placements from Year 11 to Year 10 to avoid a clash with mock GCSEs.
Table 2.7: School responses to the change in law allowing earlier work experience by change in length of work experience (percentages)
Change in length? Yes,
decreased increasedYes, changeNo All schools awareof change in law
Already changed timing 43 32 19 21
Considering changing 0 8 9 9
No plans to change 57 60 72 70
Base N= 100% 21 50 493 564
The data, therefore, suggest that while some schools have taken advantage of the change in the law to organise placements earlier in Year 10, the net effect appears to have intensified the pressure on the Summer of Year 10. From a school’s point of view there are many advantages of organising work experience for Year 10 students particularly while Year 11 are on study leave or involved with GCSEs. Many schools also believe that the students are not sufficiently mature (mentally or physically) early in Year 10 to gain the full benefit from a placement. As a result, the issue of bunching of schools in the summer of Year 10 highlighted in the 1996 report (Hillage etal., 1996), has worsened. This can clearly put pressure on employers taking part and lead to places being over-subscribed, a point made by a number of respondents to the area co-ordinators survey:
‘The constant problem of “bunching” in June and July is a worry — if only four or five schools could be moved to the September to February period all schools would enjoy a wider choice of placements.’
‘In one of our areas, we have been pressured by the schools to send all students out in the summer of Year 10. However, this puts unreasonable pressure on local employers and adversely affects the quality of the placements on offer, because many companies have their own staff on holiday at this time and can therefore offer fewer places.’
‘Schools are still very stereotypical and haven’t really moved away from traditional times — namely July. This brings a really heavy burden on companies.’
These comments were echoed by some of the employers we interviewed:
‘It would be easier if placements were staggered as we could offer placements more easily. Rotating the timing of placements across schools would be good for employers.’
‘It’s a big problem that all schools in the area want placements at the same time. Basically the best organised schools will get the places or the more enthusiastic pupils. This means that people who could really benefit from the experience can miss out.’
2.4
Conclusions
The changes that have taken place do however present a mixed message. The fact that two weeks appears to be becoming the norm suggests that work experience is perhaps being taken more seriously. On the other hand, the intensifying concentration in the summer term of Year 10 may be indicative of a triumph of administrative convenience over maximising the range of placements and therefore the learning opportunities available.
2.5
Key points
! Our surveys suggest that over 95 per cent of students have been out on work experience in either Year 10 or 11 — around the same proportion as in 1996.
! Students not going out on work experience tend to be in areas of disadvantage, in selective schools or those under Special Measures. Schools with intakes from higher socio-economic groups tend to get a higher proportion of their students on placements.
! The most common length of work experience is two weeks, occurring in two-thirds of schools, with a quarter organising one week.
! The school survey data indicate that average placement length has risen slightly in recent years. Around 14 per cent of schools said that they changed the length of placements over the past four years, two-thirds of whom (ie ten per cent of the total) had increased the length mainly from one week to two and with the aim of improving the quality of the placement.
! The student data indicate that there are some benefits to be gained from longer placements.
! Over half the schools in the survey organise a programme of extended work experience — mainly those either with a mixed sex intake or with boys only and with higher than average levels of absence or exclusions. Where offered, the average number of extended placements was six per school.
! Most students (70 per cent) go on placements in Year 10, a higher proportion than in 1996.
! Nine in ten schools were aware that students were now allowed to go on work experience from the start of Year 10. The area co-ordinators survey suggests that some six per cent of schools had taken advantage of the new arrangements, although this was not picked up by the school co-ordinators survey.
3.
Organisation of Work Experience
This chapter looks at three related issues:
! the way work experience is organised in areas across England,
! the way it is managed within schools, and
! what it costs.
3.1
The main approaches to providing work experience
The 1996 survey of area co-ordinators distinguished between three main approaches to work experience:! a school based system, where all aspects of work experience are organised in-house within each school in the area
! a centralised system, where an external agency is responsible for finding employers and matching students to places, and
! joint systems where external agencies and schools work more closely together.
In the 2000 survey we also categorised areas by these main approaches. In the first part of this chapter we look at the nature of the areas, and the provision of work experience and the services provided by the area co-ordinator. We also look at whether timing and length of placements vary with the type of organisation.
3.1.1
The nature of the work experience areas
taking over, and two neighbouring LEAs delivering work experience jointly.
The average number of secondary schools per work experience area (excluding independent and secondary schools) was 27, but this ranged from one area with only three schools, to another with 127. Half of the areas had between ten and 30 schools within their area. The average number of pupils in each of Year 10 and Year 11 was around 4,500 per work experience area. The numbers in each year group ranged from 600 to 18,000. The total number of Year 11 students covered by responses from this area co-ordinators survey is 427,553.
3.1.2
Approaches to organising work experience
The 1996 study (Hillage etal., 1996) found that there was no single system of work experience provision. A key factor determining the nature of the provision was the extent to which individual schools take on all the administrative and organisational responsibilities of organising placements themselves, or use an external agency to provide some of the elements.
The 2000 area co-ordinators questionnaire asked whether placements were predominantly organised at school level, centrally, or some combination of the two. The different approaches were defined in the questionnaire as follows:
! centralised is where an external agency is mainly responsible for finding, health and safety checking, and matching placements
! school based is where the organisation for finding, health and safety checking, and matching placements takes place mainly in school
! joint is where schools and external agencies work together on finding, health and safety checking, and matching placements; and
! mixed is where an external agency is responsible for finding, health and safety checking, and matching placements for some schools in the area, while other schools organise their own placements.
The area co-ordinators survey found that joint and centralised systems predominate, covering over 85 per cent of the areas between them in roughly equal proportions. Weighting the data by the number of schools in each area, we found that nationally within the areas which responded to the survey:
! 33 per cent of schools are in an area where there is a centralised approach to work experience
! 47 per cent of schools use a joint system, and
! 18 per cent of schools are in an area where there are a mixture of approaches being used.
In the case study areas the IES team of researchers visited, two of the area co-ordinators described the approach as school based, two of the areas operated centralised systems, and one of the areas responded that theirs was a joint approach. However, within both of the areas which described themselves as having a school based approach, the central agencies are now taking on a more active role. For example, in one of the areas, the Careers Service is responsible for health and safety checking; in the other, the schools are increasingly reliant upon the county LEA database of employers providing placements. As such, we would categorise these areas as joint.
In one of the case study areas operating a centralised system, the co-ordinating agency is the EBP, in the other it is Trident. In the Trident area, two systems are in operation: in the urban area, Trident is responsible for all the finding, health and safety checking and matching, whereas in the neighbouring rural area the Careers Service, which is affiliated to Trident, maintains a database of placements and carries out health and safety checks, but the matching takes place within the schools.
In the case study area, described as ‘joint’, the work experience central agency was a newly created EBP. Previously, in this area, the Education Team within the TEC had been responsible for work experience. Now, the EBP funds the health and safety checking system, but the matching and finding of placements takes place in the schools.
3.1.3
Changes in approaches since 1996
Our survey and case study findings suggest that there is a convergence towards an approach whereby schools are more reliant upon central agencies for health and safety checking and finding placements, but the matching of students to placements is more likely to take place in schools. Nearly three-quarters of respondents to the area co-ordinators survey (71 per cent) reported that since 1996, reliance of schools on a centralised service for organising work experience has increased. A further 25 per cent indicated that this reliance on a centralised agency has remained the same, and very few said it has reduced. Similarly, over one-third of schools (35 per cent) indicated that their reliance on a centralised service had increased, around one-half (52 per cent) indicated no change, and some 13 per cent said it had decreased.
of questions were asked about which services were provided by which organisation, ie school or external agency. The responses were then used to categorise the areas at the analysis stage. Nevertheless, it is interesting to note that many fewer areas were categorised as joint (28 per cent) in 1996 and more were school based (19 per cent) in 1996 as compared with 2000. This seems to bear out the increased reliance on a centralised agency reported by respondents in 2000. However, fewer of the areas in 2000 are categorised as centralised than they were in 1996 (42 per cent in 2000, comparing with 53 per cent in 1996).
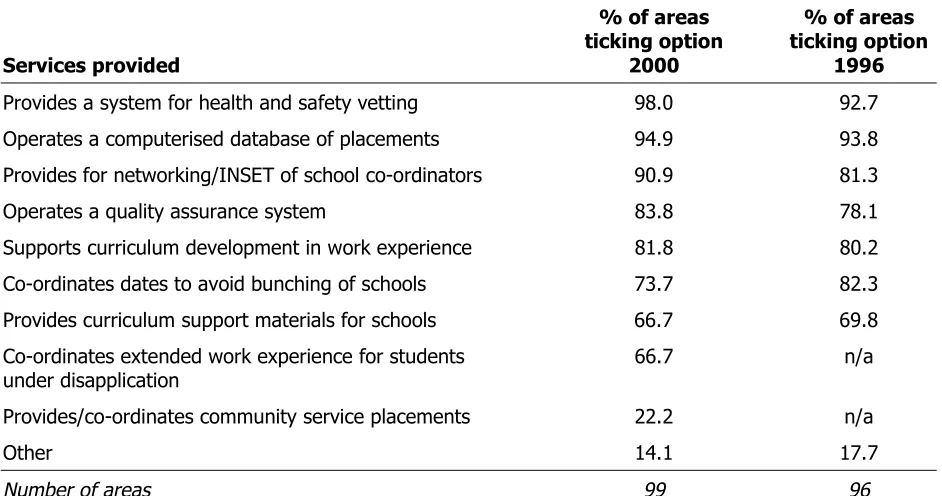
The changes generally related to a greater involvement of the central agency in the organisation of work experience. The main ways in which the central agencies’ involvement increased were:
! the central agency taking over responsibility for health and safety checking
! creation of an area database of employers, and in two areas this is shortly to be available to schools on-line
! local quality standards developed by the central agency, backed up by support services
! central agency area becoming more involved in assessing schools and employers for quality standards
! growth of interest in work experience generally, with the central agency in one area organising work experience for some schools in a neighbouring LEA, and
! in another area, provision of work experience Record of Achievement folders.
It appears, therefore, that since 1996 the driving forces behind a tendency for central agencies to become more involved are an increased focus on health and safety checking, and the quality of work experience placements, particularly through the application of quality standards.
3.1.4
Advantages and disadvantages of each type of
approach
The qualitative case study research gathered views on the advantages and disadvantages of the different approaches.
Centralised approach
Within the centralised Trident area, the main advantage identified was reducing the burden of organising work experience within the schools. For example, a typical comment from school work experience co-ordinators was:
This finding relating to workload in schools is borne out by the schools responding to the questionnaire survey. Within this Trident area, only 18 per cent of schools agreed with a statement: ‘there is too much work involved for the school in arranging work experience’. This compared with just under half (48 per cent) of schools agreeing with this statement within the other four case study areas and 42 per cent in the country as a whole. Trident in this centralised area also appears to be reasonably flexible and often was reported to do more for schools than they needed to. However, the disadvantages of the centralised approach related to the matching of students to placements. Where the central agency has sole responsibility for this, some schools complain about the lack of individual matching of students to placements and students not getting their preferred choice of placement.
Joint approach
In the ‘joint’ areas, schools value the balance between school ownership and matching of placements, and a lightening of workload through the central agency having responsibility for health and safety checking. For example, in one of the case study areas where schools have responsibility for finding placements, our findings show that while it is recognised that the onus on teachers to find placements creates a great deal of work for them, the ability of schools to tailor placements to individual student needs is felt to be more important. The central agency feels this is an economical way of organising the process. However, the disadvantages of this approach relate to a lack of resources within some schools. The system works well where work experience is given high priority and resources are ring-fenced for work experience, but less well in schools where work experience is less of a priority and where less time and resources are made available.
In another of the areas where schools are responsible for matching placements, schools again welcomed the maximum flexibility towards the needs of the student which this approach allows. However, at the time of the research there were teething problems with the central agency’s recently introduced database of employers, and health and safety system. Delays and disappointments have resulted. In another area, where the central agency has recently taken over the health and safety vetting procedure, they had also developed a database of employers which schools would soon be able to access on-line.
3.1.5
Length of placements by type of provision
three weeks) in areas where wo