Open Access
Short Report
Global gene expression profiling of oral cavity cancers suggests
molecular heterogeneity within anatomic subsites
Patricia Severino
1, Adriana M Alvares
2, Pedro Michaluart Jr
3,
Oswaldo K Okamoto
4, Fabio D Nunes
5, Carlos A Moreira-Filho
6,
Eloiza H Tajara*
7,8and Head and Neck Genome Project GENCAPO
Address: 1Centro de Pesquisa Experimental, Instituto Israelita de Ensino e Pesquisa Albert Einstein, São Paulo, SP, Brazil, 2Laboratório de Biologia
Molecular, Hospital Heliópolis, São Paulo, SP, Brazil, 3Departamento de Cirurgia de Cabeça e Pescoço do Hospital das Clínicas, Faculdade de
Medicina da Universidade de São Paulo, São Paulo, SP, Brazil, 4Departamento de Neurologia e Neurocirurgia, Universidade Federal de São Paulo,
São Paulo, SP, Brazil, 5Departamento de Estomatologia, Faculdade de Odontologia da Universidade de São Paulo, São Paulo, SP, Brazil, 6Departamento de Pediatria, Faculdade de Medicina da Universidade de São Paulo, São Paulo, SP, Brazil, 7Departamento de Biologia Molecular,
Faculdade de Medicina de São José do Rio Preto, São José do Rio Preto, SP, Brazil and 8Departamento de Genética e Biologia Evolutiva, Instituto
de Biociências da Universidade de São Paulo, São Paulo, SP, Brazil
Email: Patricia Severino - [email protected]; Adriana M Alvares - [email protected]; Pedro Michaluart - [email protected]; Oswaldo K Okamoto - [email protected]; Fabio D Nunes - [email protected]; Carlos A Moreira-Filho - [email protected]; Eloiza H Tajara* - [email protected]; Head and Neck Genome Project GENCAPO - [email protected]
* Corresponding author
Abstract
Background: Oral squamous cell carcinoma (OSCC) is a frequent neoplasm, which is usually aggressive and has unpredictable biological behavior and unfavorable prognosis. The comprehension of the molecular basis of this variability should lead to the development of targeted therapies as well as to improvements in specificity and sensitivity of diagnosis.
Results: Samples of primary OSCCs and their corresponding surgical margins were obtained from male patients during surgery and their gene expression profiles were screened using whole-genome microarray technology. Hierarchical clustering and Principal Components Analysis were used for data visualization and One-way Analysis of Variance was used to identify differentially expressed genes. Samples clustered mostly according to disease subsite, suggesting molecular heterogeneity within tumor stages. In order to corroborate our results, two publicly available datasets of microarray experiments were assessed. We found significant molecular differences between OSCC anatomic subsites concerning groups of genes presently or potentially important for drug development, including mRNA processing, cytoskeleton organization and biogenesis, metabolic process, cell cycle and apoptosis.
Conclusion: Our results corroborate literature data on molecular heterogeneity of OSCCs. Differences between disease subsites and among samples belonging to the same TNM class highlight the importance of gene expression-based classification and challenge the development of targeted therapies.
Published: 13 November 2008
BMC Research Notes 2008, 1:113 doi:10.1186/1756-0500-1-113
Received: 24 June 2008 Accepted: 13 November 2008
This article is available from: http://www.biomedcentral.com/1756-0500/1/113
© 2008 Tajara et al; licensee BioMed Central Ltd.
Background
Head and neck squamous cell carcinomas (HNSCC) rank among the top ten most common cancers worldwide, with increasing rates in certain areas of the world [1]. They can occur at different subsites, often invading more than one, each one with their own particular problems regard-ing management. In this study, we focused on oral squa-mous cell carcinoma (OSCC), a frequent neoplasm, which is usually aggressive and has unpredictable biolog-ical behavior and unfavorable prognosis. The accumula-tion of genetic alteraaccumula-tions during oral tumorigenesis, leading to qualitative and quantitative changes in gene expression, is currently known but still largely unexplored [2,3]. Unlike estrogen receptor or HER2 in breast cancer, no biomarkers are currently available for HNSCC progno-sis, which depends largely on the stage at presentation, with the most important prognostic factor being the pres-ence of neck node metastases [4]. Improvements in specif-icity and sensitivity of diagnosis and in disease monitoring depend on the elucidation of the biological and molecular mechanisms underlying tumor develop-ment. In this context, large-scale transcriptome analysis may be used to assess patterns of gene expression, provid-ing an opportunity to investigate the complex cascade of molecular events leading to tumor development and pro-gression [5,6].
Two recent publications have examined the global gene expression profiles of OSCC, both addressing the impor-tance of understanding the molecular complexity of this malignancy [7,8]. Unlike those authors, we did not focus on molecular differences between OSCC and normal mucosa, but we compared gene expression profiles of OSCC samples from different anatomic subsites. The bio-logic behavior of OSCC cannot be predicted and clinical reports suggest that molecular heterogeneity of anatomic subsites could play an important role in this scenario. For instance, cancer of the tongue seems to grow faster than other oral cavity cancers, with cervical metastases occur-ring more frequently in such cancers[9]. Moreover, signif-icant differences between floor of the mouth and tongue cancers in response to combined surgery and radiotherapy have been reported [10].
In order to evaluate molecular differences between OSCC anatomic subsites, we investigated samples of primary tongue and floor of the mouth tumors, and their corre-sponding surgical margins, in respect to their gene expres-sion profile by means of DNA microarrays.
Methods
We selected samples of primary tongue and floor of the mouth tumors, and their corresponding surgical margins, from 9 male patients during surgery for squamous cell
car-already with evidences of metastasis (T2N+), or larger, non-metastatic samples (T3N0). Patients had a history of tobacco and alcohol abuse and no prior cancer treatment. A full description of the clinical data, including tumor stage is provided in Additional File 1. All participants pro-vided written consent and the research protocol was approved by review boards of all involved institutions. Analysis of haematoxylin and eosin-stained sections indi-cated that each OSCC sample contained at least 70% tumor cells and the corresponding surgical margins were reported "tumor-free". Total RNA was extracted with TRI-ZOL Reagent (Invitrogen). Tissues adjacent to resected tumors were grouped into two pools of RNA for microar-ray analysis, corresponding to T2N+ and T3N0 samples, due to the limited amounts of tumor-free margin availa-ble in most cases.
Microarray experiments were carried out using CodeLink Whole Genome Bioarrays (GE Healthcare) and arrays were scanned on a GenePix 4000B Array Scanner (Axon Instruments), according to the recommended scanning procedures and settings. The data were treated with Code-Link feature extraction software v.4.0. A normalized signal for each transcript was obtained through quantile normal-ization [11]. The array design and raw data files are avail-able at the Gene Expression Omnibus database (GEO) under the accession number GSE9792. For global gene expression visualization, we used hierarchical clustering and Principal Components Analysis (PCA). Hierarchical clustering was performed using the Euclidean distance and the average linkage algorithm. One-way ANOVA was used to identify significant differences in the dataset. All the above-mentioned analyses were generated using Partek® software version 6.3 Copyright© 2007 Partek Inc.,
St. Louis, MO, USA. Functional annotations of differen-tially expressed genes were performed using Database for Annotation, Visualization and Integrated Discovery [12] using the parameters Gene Ontology (GO) Molecular Process term level 5 and KEGG Pathways (Kyoto Encyclo-pedia of Genes and Genomes)[13].
Results and Discussion
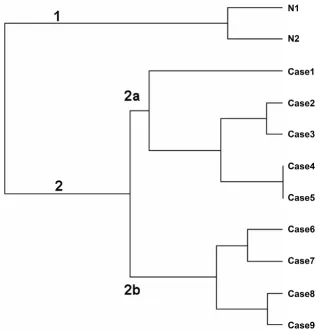
By analyzing the dendogram resulting from hierarchical clustering and the PCA, we observed that OSCC samples did not group according to their pathological stages (Fig-ures 1 and 2, respectively). In agreement with previous reports [14,15], two major clusters reflected differences in global gene expression between non-tumoral tissues (cluster 1) and tumor samples (cluster 2). Tumor samples clustered mostly, but not exclusively, according to disease anatomic subsites. This result suggests molecular hetero-geneity within TNM classes and corroborates previous data published by Ziober et al. [15] and Chung et al[16]. In the later study, there were no consistent differences in gene expression among HNSCC subsites, but samples from oral cavity seemed more heterogeneous than sam-ples from other sites when expression patterns were eval-uated. Few studies have aimed to understand the molecular background of OSCC. In the context of molec-ular target therapies, drugs are designed to interact with
specific molecules present in certain types or subtypes of tumors. Due to the heterogeneity within HNSCC, a thor-oughly comprehension of the molecular characteristics underlying its subsites is needed before efficient therapy can be achieved.
Differential gene expression profiles
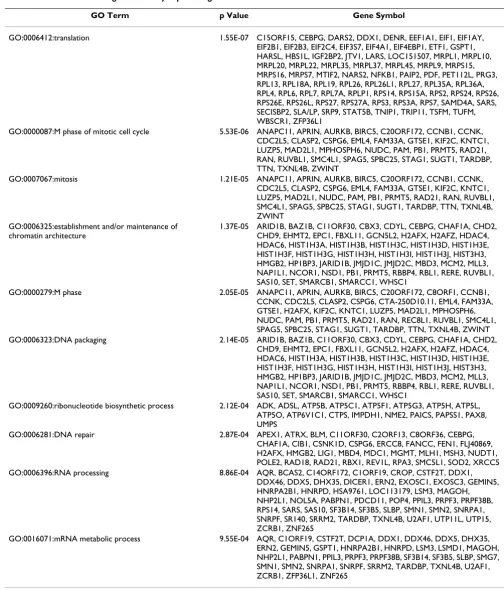
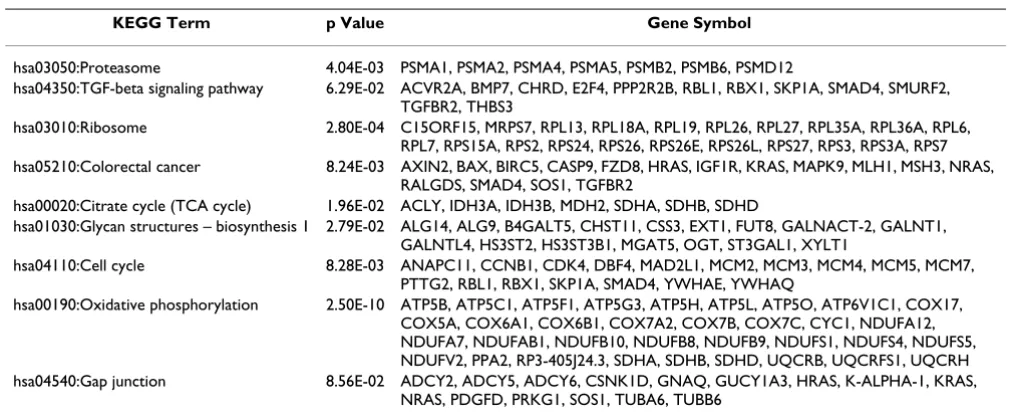
Using hierarchical clustering and PCA, two main groups of tumor samples (2a and 2b) were observed (Figure 1). Each group contained, mostly, either tongue or floor of the mouth samples. Differentially expressed genes between the two clusters were identified using ANOVA (Additional File 4). These genes (total number 1579) were functionally annotated using Gene Ontology (GO) and KEGG terms in an attempt to understand major molecular differences between the groups (Tables 1 and 2). Due to our small sample number, our results were compared with two additional OSCC microarray datasets, GSE3524 and TABM302. Despite broad differences in experimental
[image:3.612.146.465.328.659.2]Hierarchical clustering
Figure 1
design, probe sets, and possibly genetic background, some findings were consistent and are pointed out below.
Extensive differences in gene expression between clusters 2a and 2b were observed in respect to translation and mitosis-related GO terms (GO:0006412:translation, GO:0000087:M phase of mitotic cell cycle; GO:0007067:mitosis; GO:0000279:M phase). Transla-tion initiaTransla-tion is regulated in response to mitogenic
stim-growth. Several alterations in translational control occur in cancer, but there is still much to be discovered about their role in cancer development and progression [17]. Changes in the expression or availability of components of the translational machinery can lead to global changes, such as an increase in the overall rate of protein synthesis and translational activation of the mRNA molecules involved in cell growth and proliferation. In agreement, differences between the two clusters were enriched in GO
Three-dimensional Principal Components Analysis
Figure 2
Table 1: GO terms containing differentially expressed genes between OSCC subsite-related clusters
GO Term p Value Gene Symbol
GO:0006412:translation 1.55E-07 C15ORF15, CEBPG, DARS2, DDX1, DENR, EEF1A1, EIF1, EIF1AY, EIF2B1, EIF2B3, EIF2C4, EIF3S7, EIF4A1, EIF4EBP1, ETF1, GSPT1, HARSL, HBS1L, IGF2BP2, JTV1, LARS, LOC151507, MRPL1, MRPL10, MRPL20, MRPL22, MRPL35, MRPL37, MRPL45, MRPL9, MRPS15, MRPS16, MRPS7, MTIF2, NARS2, NFKB1, PAIP2, PDF, PET112L, PRG3, RPL13, RPL18A, RPL19, RPL26, RPL26L1, RPL27, RPL35A, RPL36A, RPL4, RPL6, RPL7, RPL7A, RPLP1, RPS14, RPS15A, RPS2, RPS24, RPS26, RPS26E, RPS26L, RPS27, RPS27A, RPS3, RPS3A, RPS7, SAMD4A, SARS, SECISBP2, SLA/LP, SRP9, STAT5B, TNIP1, TRIP11, TSFM, TUFM, WBSCR1, ZFP36L1
GO:0000087:M phase of mitotic cell cycle 5.53E-06 ANAPC11, APRIN, AURKB, BIRC5, C20ORF172, CCNB1, CCNK, CDC2L5, CLASP2, CSPG6, EML4, FAM33A, GTSE1, KIF2C, KNTC1, LUZP5, MAD2L1, MPHOSPH6, NUDC, PAM, PB1, PRMT5, RAD21, RAN, RUVBL1, SMC4L1, SPAG5, SPBC25, STAG1, SUGT1, TARDBP, TTN, TXNL4B, ZWINT
GO:0007067:mitosis 1.21E-05 ANAPC11, APRIN, AURKB, BIRC5, C20ORF172, CCNB1, CCNK, CDC2L5, CLASP2, CSPG6, EML4, FAM33A, GTSE1, KIF2C, KNTC1, LUZP5, MAD2L1, NUDC, PAM, PB1, PRMT5, RAD21, RAN, RUVBL1, SMC4L1, SPAG5, SPBC25, STAG1, SUGT1, TARDBP, TTN, TXNL4B, ZWINT
GO:0006325:establishment and/or maintenance of chromatin architecture
1.37E-05 ARID1B, BAZ1B, C11ORF30, CBX3, CDYL, CEBPG, CHAF1A, CHD2, CHD9, EHMT2, EPC1, FBXL11, GCN5L2, H2AFX, H2AFZ, HDAC4, HDAC6, HIST1H3A, HIST1H3B, HIST1H3C, HIST1H3D, HIST1H3E, HIST1H3F, HIST1H3G, HIST1H3H, HIST1H3I, HIST1H3J, HIST3H3, HMGB2, HP1BP3, JARID1B, JMJD1C, JMJD2C, MBD3, MCM2, MLL3, NAP1L1, NCOR1, NSD1, PB1, PRMT5, RBBP4, RBL1, RERE, RUVBL1, SAS10, SET, SMARCB1, SMARCC1, WHSC1
GO:0000279:M phase 2.05E-05 ANAPC11, APRIN, AURKB, BIRC5, C20ORF172, C8ORF1, CCNB1, CCNK, CDC2L5, CLASP2, CSPG6, CTA-250D10.11, EML4, FAM33A, GTSE1, H2AFX, KIF2C, KNTC1, LUZP5, MAD2L1, MPHOSPH6, NUDC, PAM, PB1, PRMT5, RAD21, RAN, REC8L1, RUVBL1, SMC4L1, SPAG5, SPBC25, STAG1, SUGT1, TARDBP, TTN, TXNL4B, ZWINT GO:0006323:DNA packaging 2.14E-05 ARID1B, BAZ1B, C11ORF30, CBX3, CDYL, CEBPG, CHAF1A, CHD2,
CHD9, EHMT2, EPC1, FBXL11, GCN5L2, H2AFX, H2AFZ, HDAC4, HDAC6, HIST1H3A, HIST1H3B, HIST1H3C, HIST1H3D, HIST1H3E, HIST1H3F, HIST1H3G, HIST1H3H, HIST1H3I, HIST1H3J, HIST3H3, HMGB2, HP1BP3, JARID1B, JMJD1C, JMJD2C, MBD3, MCM2, MLL3, NAP1L1, NCOR1, NSD1, PB1, PRMT5, RBBP4, RBL1, RERE, RUVBL1, SAS10, SET, SMARCB1, SMARCC1, WHSC1
GO:0009260:ribonucleotide biosynthetic process 2.12E-04 ADK, ADSL, ATP5B, ATP5C1, ATP5F1, ATP5G3, ATP5H, ATP5L, ATP5O, ATP6V1C1, CTPS, IMPDH1, NME2, PAICS, PAPSS1, PAX8, UMPS
GO:0006281:DNA repair 2.87E-04 APEX1, ATRX, BLM, C11ORF30, C2ORF13, C8ORF36, CEBPG, CHAF1A, CIB1, CSNK1D, CSPG6, ERCC8, FANCC, FEN1, FLJ40869, H2AFX, HMGB2, LIG1, MBD4, MDC1, MGMT, MLH1, MSH3, NUDT1, POLE2, RAD18, RAD21, RBX1, REV1L, RPA3, SMC5L1, SOD2, XRCC5 GO:0006396:RNA processing 8.86E-04 AQR, BCAS2, C14ORF172, C1ORF19, CROP, CSTF2T, DDX1,
DDX46, DDX5, DHX35, DICER1, ERN2, EXOSC1, EXOSC3, GEMIN5, HNRPA2B1, HNRPD, HSA9761, LOC113179, LSM3, MAGOH, NHP2L1, NOL5A, PABPN1, PDCD11, POP4, PPIL3, PRPF3, PRPF38B, RPS14, SARS, SAS10, SF3B14, SF3B5, SLBP, SMN1, SMN2, SNRPA1, SNRPF, SR140, SRRM2, TARDBP, TXNL4B, U2AF1, UTP11L, UTP15, ZCRB1, ZNF265
ing and mRNA Metabolic Process as well as in KEGG Pro-teasome, Cell Cycle, TGFB Signaling and Ribosome Pathways. Components of the translation machinery and related pathways represent good targets for cancer therapy [18,19]. The differential expression of a number of genes involved in such processes suggests that the efficacy of oral cancer therapy should vary depending on the tumor sub-site. Molecular mechanisms leading to differences in gene expression (i.e variations in mRNA sequences, changes in the availability of the translational machinery compo-nents, and activation of translation through abnormally activated signal transduction pathways) deserve to be investigated.
Differences in the expression of cell cycle progression-related genes were also observed in both GEO (GSE3524) and ArrayExpress (TABM302) datasets. In respect to the former, several genes associated with the KEGG MAPK Signaling Pathway presented differential expression when tongue samples were compared with floor of the mouth samples. Similar results were observed for GO terms con-cerning transcriptional regulation and apoptosis (Addi-tional File 5). In agreement with our results, TABM302 dataset showed differential expression in genes associated with the GO terms Maintenance of Chromatin Architec-ture and DNA Packaging, both essential in cell cycle-related processes, and with the KEGG Ribosome Pathway (Additional File 6). Proliferation and cell death are also regulated by genes associated with the GO terms Small GTPase Mediated Signal Transduction and Regulation of Ras Protein Signal Transduction, both represented several times in the list of differentially expressed genes of the TABM302 dataset.
With respect to cell cycle and apoptosis, we also observed the over-expression in cluster 2b of three genes involved in the regulation of p27 phosphorylation during cell cycle progression (CKS1B, RBX1 and SKP1A) and genes from the MCM complex (minichromosomal maintenance genes), including MCM7 (Additional File 4). MCM7 pro-tein is a marker for proliferation and it is upregulated in different tumors including neuroblastoma, prostate, cervi-cal and hypopharyngeal carcinomas [20]. SKP1A, MCM3, MCM6 and MCM7 were also differentially expressed in TABM302 dataset (Additional File 3), however, their over-expression was observed in tongue samples.
[image:6.612.52.558.97.305.2]Widespread differences were also observed in oxidative phosphorylation pathways (Tables 2 and 3). Genes belonging to KEGG Oxidative Phosphorylation and Cit-rate Cycle (TCA cycle) Pathways were over-expressed in cluster 2b. Oxidative phosphorylation of ADP to ATP accompanies the oxidation of a metabolite through the operation of the respiratory chain. According to Warburg [21], alterations of respiratory machinery should result in compensatory increase in glycolytic ATP production and lead to carcinogenesis. In fact, malignant cells meet their energy (ATP) needs by glycolysis rather than through oxy-dative phosphorylation, probably an adaptation to hypoxia that develops as tumor grows [22]. In accordance with our results, some authors have recently found a bioenergetic signature in several human tumors [23]. Our observations suggest that distinct OSCC subsites differ on their glycolytic phenotype, a matter that deserves further investigation and may impact tumor progression manage-ment as well as therapy outcome.
Table 2: Major KEGG pathways containing genes differentially expressed between OSCC subsite-related clusters
KEGG Term p Value Gene Symbol
hsa03050:Proteasome 4.04E-03 PSMA1, PSMA2, PSMA4, PSMA5, PSMB2, PSMB6, PSMD12
hsa04350:TGF-beta signaling pathway 6.29E-02 ACVR2A, BMP7, CHRD, E2F4, PPP2R2B, RBL1, RBX1, SKP1A, SMAD4, SMURF2, TGFBR2, THBS3
hsa03010:Ribosome 2.80E-04 C15ORF15, MRPS7, RPL13, RPL18A, RPL19, RPL26, RPL27, RPL35A, RPL36A, RPL6, RPL7, RPS15A, RPS2, RPS24, RPS26, RPS26E, RPS26L, RPS27, RPS3, RPS3A, RPS7 hsa05210:Colorectal cancer 8.24E-03 AXIN2, BAX, BIRC5, CASP9, FZD8, HRAS, IGF1R, KRAS, MAPK9, MLH1, MSH3, NRAS,
RALGDS, SMAD4, SOS1, TGFBR2
hsa00020:Citrate cycle (TCA cycle) 1.96E-02 ACLY, IDH3A, IDH3B, MDH2, SDHA, SDHB, SDHD
hsa01030:Glycan structures – biosynthesis 1 2.79E-02 ALG14, ALG9, B4GALT5, CHST11, CSS3, EXT1, FUT8, GALNACT-2, GALNT1, GALNTL4, HS3ST2, HS3ST3B1, MGAT5, OGT, ST3GAL1, XYLT1
hsa04110:Cell cycle 8.28E-03 ANAPC11, CCNB1, CDK4, DBF4, MAD2L1, MCM2, MCM3, MCM4, MCM5, MCM7, PTTG2, RBL1, RBX1, SKP1A, SMAD4, YWHAE, YWHAQ
hsa00190:Oxidative phosphorylation 2.50E-10 ATP5B, ATP5C1, ATP5F1, ATP5G3, ATP5H, ATP5L, ATP5O, ATP6V1C1, COX17, COX5A, COX6A1, COX6B1, COX7A2, COX7B, COX7C, CYC1, NDUFA12, NDUFA7, NDUFAB1, NDUFB10, NDUFB8, NDUFB9, NDUFS1, NDUFS4, NDUFS5, NDUFV2, PPA2, RP3-405J24.3, SDHA, SDHB, SDHD, UQCRB, UQCRFS1, UQCRH hsa04540:Gap junction 8.56E-02 ADCY2, ADCY5, ADCY6, CSNK1D, GNAQ, GUCY1A3, HRAS, K-ALPHA-1, KRAS,
Genes related to KEGG Oxidative Phosphorylation Path-way also showed differences in expression in GSE3524 dataset when subsites were compared; the same was observed for genes related to the GO term Organelle ATP Synthesis Coupled Electron Transport (Additional File 5). The expression of several cytochrome oxidases and ATPases was also distinct between subsites in TABM302 (Additional File 3).
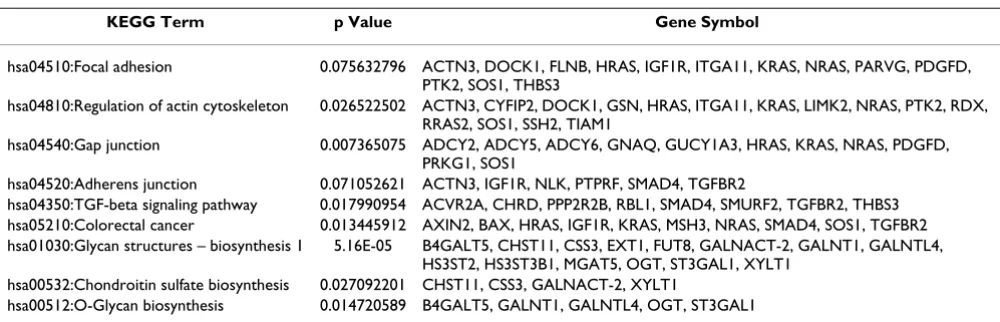
KEGG Pathway analysis revealed genes over-expressed in cluster 2a which are associated with gap junctions and adherens junctions, as well as cytoskeleton organization and biogenesis (Table 4), including ACTN, DOCK1, GSN, ITG, LIMK, RAS, SOS, SSH and TIAM1. In agreement with our data, genes related to KEGG Regulation of Actin Cytoskeleton and Adherens Junction Pathways were also found differentially expressed in TABM302 (Additional File 6). Cancer therapy has focused on such pathways. For example, microtubule-targeted drugs interfere with the ability of the cancer cells to divide and multiply by dis-rupting microtubules [24]. Gene-silencing may reduce expression of proteins involved in regulating the actin cytoskeleton, as LIMK, rendering cells more responsive to anticancer agents [25]. Therefore, molecular differences
between OSCC subsites may affect sensitivity to chemo-therapy.
In addition to the data presented above, several genes over-expressed in cluster 2b have been previously associ-ated with oral cancer, such as GSTM1, IL8, MGMT, NFKB1 and NUDT1; as well as with pancreatic cancer (APEX1, CDK4, FANCC, GSTM1, MGMT and SOD2), lung cancer (APEX1, CASP9, GSTM1, HSPA8, IL8, LIG1, MBD4, MGMT, MLH1, NUDT1 and SOD2), colorectal cancer (APEX1, BLM, GSTM1, IL8, MGMT, MLH1, NFKB1, NUDT1, RFC1, SOD2 and UMPS) and bladder cancer (APEX1, GSTM1, IL8, LIG1, MGMT and SOD2) (Addi-tional File 4). We believe the differential expression between anatomic subsites of genes known to be involved in tumorigenesis deserves further investigation.
Conclusion
[image:7.612.54.559.98.228.2]Gene expression profiling of lymph node positive and lymph node negative HNSCC has been addressed in the literature [14,15,26,27]. Besides the differences in study designs, the lack of consistency concerning HNSCC gene expression signatures could be due to gene expression var-iation related to subsites. This is a preliminary study and as such presents results on a small number of samples. Table 3: KEGG enriched terms containing genes over-expressed in cluster 2b
KEGG Term p Value Gene Symbol
hsa00190:Oxidative phosphorylation 6.84E-16 ATP5B, ATP5C1, ATP5F1, ATP5G3, ATP5H, ATP5L, ATP5O, COX17, COX5A, COX6A1, COX6B1, COX7A2, COX7B, COX7C, CYC1, NDUFA12, NDUFA7, NDUFAB1, NDUFB10, NDUFB8, NDUFB9, NDUFS1, NDUFS4, NDUFS5, NDUFV2, PPA2, RP3-405J24.3, SDHA, SDHB, SDHD, UQCRB, UQCRFS1, UQCRH
hsa03050:Proteasome 2.58E-04 PSMA1, PSMA2, PSMA4, PSMA5, PSMB2, PSMB6, PSMD12
hsa04110:Cell cycle 0.001169541 ANAPC11, CCNB1, CDK4, DBF4, MAD2L1, MCM2, MCM3, MCM5, MCM7, PTTG2, RBX1, SKP1A, YWHAE, YWHAQ
hsa00020:Citrate cycle (TCA cycle) 0.001533882 ACLY, IDH3A, IDH3B, MDH2, SDHA, SDHB, SDHD
hsa03010:Ribosome 9.30E-07 C15ORF15, MRPS7, RPL13, RPL18A, RPL19, RPL26, RPL27, RPL35A, RPL6, RPL7, RPS15A, RPS2, RPS24, RPS26, RPS26E, RPS26L, RPS27, RPS3, RPS3A, RPS7
Table 4: KEGG enriched terms containing genes over-expressed in cluster 2a
KEGG Term p Value Gene Symbol
hsa04510:Focal adhesion 0.075632796 ACTN3, DOCK1, FLNB, HRAS, IGF1R, ITGA11, KRAS, NRAS, PARVG, PDGFD, PTK2, SOS1, THBS3
hsa04810:Regulation of actin cytoskeleton 0.026522502 ACTN3, CYFIP2, DOCK1, GSN, HRAS, ITGA11, KRAS, LIMK2, NRAS, PTK2, RDX, RRAS2, SOS1, SSH2, TIAM1
hsa04540:Gap junction 0.007365075 ADCY2, ADCY5, ADCY6, GNAQ, GUCY1A3, HRAS, KRAS, NRAS, PDGFD, PRKG1, SOS1
hsa04520:Adherens junction 0.071052621 ACTN3, IGF1R, NLK, PTPRF, SMAD4, TGFBR2
hsa04350:TGF-beta signaling pathway 0.017990954 ACVR2A, CHRD, PPP2R2B, RBL1, SMAD4, SMURF2, TGFBR2, THBS3 hsa05210:Colorectal cancer 0.013445912 AXIN2, BAX, HRAS, IGF1R, KRAS, MSH3, NRAS, SMAD4, SOS1, TGFBR2 hsa01030:Glycan structures – biosynthesis 1 5.16E-05 B4GALT5, CHST11, CSS3, EXT1, FUT8, GALNACT-2, GALNT1, GALNTL4,
HS3ST2, HS3ST3B1, MGAT5, OGT, ST3GAL1, XYLT1 hsa00532:Chondroitin sulfate biosynthesis 0.027092201 CHST11, CSS3, GALNACT-2, XYLT1
[image:7.612.55.555.567.728.2]However, the idea of molecular heterogeneity within HNSCC is not new. We corroborate previously reported literature data and we suggest that differences between anatomic OSCC subsites could impact drug response and should be considered during the development of targeted therapies.
Competing interests
The authors declare that they have no competing interests.
Authors' contributions
PS carried out hybridization experiments, data analysis and drafted the manuscript; AMA coordinated sample col-lection and carried out clinical data analysis; PM carried out clinical data analysis for sample selection; OKO helped with data analysis and the study design; FDM par-ticipated in the study design and carried out clinical data analysis; GENCAPO team members were responsible for sample collection, initial on-site sample processing, pro-vided the pathological analysis of the cases, obtained the informed consent and discussed the findings. CAMF par-ticipated in the study design and coordination; EHT con-ceived the study, carried out data analysis and coordination. All authors read and approved the final manuscript.
Additional material
Acknowledgements
We are grateful to the authors of microarray datasets GEO GSE3524 and ArrayExpress TABM302. The GENCAPO group acknowledges the financial support from Fundação de Amparo à Pesquisa do Estado de São Paulo/ FAPESP (Grants 04/12054-9 and 04/14029-1) and Associação Beneficente Alzira Denise Hertzog Silva/ABADHS, and the researcher fellowships from Conselho Nacional de Pesquisas (CNPq), Coordenação de Aperfeiçoamen-to de Pessoal de Nível Superior (CAPES), InstituAperfeiçoamen-to Israelita de Ensino e Pesquisa Albert Einstein, and The Ludwig Institute for Cancer Research.
We also thank to the Head and Neck Genome Project GENCAPO mem-bers for data collection, study design, comments on the draft: Cury PM, Frizzera APZ (Departamento de Patologia, Faculdade de Medicina de São José do Rio Preto); de Carvalho MB, Silva AMA, Amar A, Barbieri RB, Bas-tos AU, Carvalho-Neto PB, Casemiro AF, Chedid H, Chiappini PBO, Cor-reia LA, Costa ACW, Curioni OA, Franzi SA, Gazito D, Gutierres AP, Lehn CN, Martins AE, Mercante AMC, Porsani AF, Rapoport A, Rossi L, Santos M, Souza TB, Takamori JT (Hospital Heliópolis, São Paulo); Dias-Neto E, Ojopi EPB, Dias THG (Departamento e Instituto de Psiquiatria, Faculdade de Medicina, USP, São Paulo); Figueiredo DLA, Mamede RCM (Serviço de Cirurgia de Cabeça e Pescoço, Faculdade de Medicina de Ribeirão Preto, USP); Fukuyama EE, Góis-Filho JF, Cerione M, Cicco R, Settani F, Valentim PJ, Yamagushi F, Cominato ML, Mendes GS, Paiva R, Silva MJ (Serviço de Cirurgia de Cabeça e Pescoço, Instituto do Câncer Arnaldo Vieira de Car-valho, São Paulo); Leopoldino AM, Silva FAM (Departamento de Análises Clínicas, Toxicológicas e Bromatológicas, Faculdade de Ciências Farmacêu-ticas de Ribeirão Preto, USP); Michaluart-Junior P, Moyses RA, Arap SS, Araújo NSS, Araújo-Filho V, Brandão LG, Cernea CR, Durazzo M, Ferraz AR, Gallo J, Guimarães PEM, Magalhães RP, Montenegro FLM, Silva-Filho GB, Smith RB, Stabenow E, Tavares MR, Turcano R, Volpi EM, Ramos O, Silva C (Departamento de Cirurgia de Cabeça e Pescoço, Faculdade de Medicina, USP, São Paulo); Moreira-Filho CA (Departamento de Pediatria, Faculdade de Medicina, USP, São Paulo); Nóbrega FG, Nóbrega MP, Canto AL, Macarenco R, Meneses C, Correa PMS, Bogossian AP (Departamento de Biociências e Diagnóstico Bucal, Faculdade de Odontologia, UNESP, São José dos Campos); Nunes FD, Souza SCOM, Rodini CO, Xavier FCA (Departamento de Estomatologia, Faculdade de Odontologia, USP, São Paulo); Okamoto OK (Departamento de Neurologia e Neurocirurgia, UNIFESP, São Paulo); Serafini LN (Departamento de Patologia, Faculdade de Medicina de Ribeirão Preto, USP); Severino P (Instituto de Ensino e Pesquisa Albert Einstein, São Paulo); Silva Jr WA, Brandão RM, Kaneto CM, Pinheiro DG, Santos ARD, Silva IT, Tarlá MVC (Departamento de
Genéti-Additional File 1
Clinicopathological features of patients in this study. Click here for file
[http://www.biomedcentral.com/content/supplementary/1756-0500-1-113-S1.doc]
Additional File 2
Differentially expressed genes between tongue and floor of the mouth samples from GEO dataset GSE3524 (p ≤ 0.05).
Click here for file
[http://www.biomedcentral.com/content/supplementary/1756-0500-1-113-S2.xls]
Additional File 3
Differentially expressed genes between tongue and oral cavity samples from ArrayExpress dataset TABM302 (p ≤ 0.05).
Click here for file
[http://www.biomedcentral.com/content/supplementary/1756-0500-1-113-S3.xls]
Additional File 4
Differentially expressed genes between OSCC clusters depicted by hierarchical clustering and PCA (p ≤ 0.05).
Click here for file
[http://www.biomedcentral.com/content/supplementary/1756-0500-1-113-S4.xls]
Additional File 5
KEGG and GO terms containing differentially expressed genes between tongue and floor of the mouth samples from dataset GSE3524.
Click here for file
[http://www.biomedcentral.com/content/supplementary/1756-0500-1-113-S5.doc]
Additional File 6
KEGG and GO terms containing differentially expressed genes between tongue and oral cavity samples from dataset TABM302. Click here for file
Publish with BioMed Central and every scientist can read your work free of charge
"BioMed Central will be the most significant development for disseminating the results of biomedical researc h in our lifetime."
Sir Paul Nurse, Cancer Research UK
Your research papers will be:
available free of charge to the entire biomedical community
peer reviewed and published immediately upon acceptance
cited in PubMed and archived on PubMed Central
yours — you keep the copyright
Submit your manuscript here:
http://www.biomedcentral.com/info/publishing_adv.asp
BioMedcentral Lisoni FC, Rodrigues RV, Polachini GM, Vidotto A, Cunha BR,
Carmona-Raphe J (Departamento de Biologia Molecular, Faculdade de Medicina de São José do Rio Preto;); Wünsch-Filho V, Costa A, Figueiredo RO, Fortes CS, Inamine R, López RVM, Rodrigues AN (Departamento de Epidemiolo-gia, Faculdade de Saúde Pública, USP, São Paulo); Zago MA (Departamento de Clínica Médica, Faculdade de Medicina de Ribeirão Preto, USP); SP, Bra-zil.
References
1. Shibuya K, Mathers CD, Boschi-Pinto C, Lopez AD, Murray CJ: Glo-bal and regional estimates of cancer mortality and incidence by site: II. Results for the global burden of disease 2000. BMC Cancer 2002, 2:37.
2. Scully C, Field JK, Tanzawa H: Genetic aberrations in oral or head and neck squamous cell carcinoma (SCCHN): 1. Car-cinogen metabolism, DNA repair and cell cycle control. Oral Oncol 2000, 36(3):256-263.
3. Scully C, Field JK, Tanzawa H: Genetic aberrations in oral or head and neck squamous cell carcinoma 3: clinico-patholog-ical applications. Oral Oncol 2000, 36(5):404-413.
4. Greenberg JS, Fowler R, Gomez J, Mo V, Roberts D, El Naggar AK, Myers JN: Extent of extracapsular spread: a critical prognos-ticator in oral tongue cancer. Cancer 2003, 97(6):1464-1470. 5. Huang E, Cheng SH, Dressman H, Pittman J, Tsou MH, Horng CF, Bild
A, Iversen ES, Liao M, Chen CM, et al.: Gene expression predic-tors of breast cancer outcomes. Lancet 2003, 361(9369):1590-1596.
6. van 't Veer LJ, Dai H, Vijver MJ van de, He YD, Hart AA, Mao M, Peterse HL, Kooy K van der, Marton MJ, Witteveen AT, et al.: Gene expression profiling predicts clinical outcome of breast can-cer. Nature 2002, 415(6871):530-536.
7. Sticht C, Freier K, Knopfle K, Flechtenmacher C, Pungs S, Hofele C, Hahn M, Joos S, Lichter P: Activation of MAP kinase signaling through ERK5 but not ERK1 expression is associated with lymph node metastases in oral squamous cell carcinoma (OSCC). Neoplasia 2008, 10(5):462-470.
8. Kondoh N, Ishikawa T, Ohkura S, Arai M, Hada A, Yamazaki Y, Kita-gawa Y, Shindoh M, Takahashi M, Ando T, et al.: Gene expression signatures that classify the mode of invasion of primary oral squamous cell carcinomas. Mol Carcinog 2008.
9. Ridge JA, Glisson BS, Horwitz EM, MN L: Cancers of the Head and Neck Region. In Textbook of cancer management: a multidisciplinary approach 10th edition. Melville, NY: PPR, Inc.; 2007:31-72. 10. Zelefsky MJ, Harrison LB, Fass DE, Armstrong J, Spiro RH, Shah JP,
Strong EW: Postoperative radiotherapy for oral cavity can-cers: impact of anatomic subsite on treatment outcome. Head Neck 1990, 12(6):470-475.
11. Bolstad BM, Irizarry RA, Astrand M, Speed TP: A comparison of normalization methods for high density oligonucleotide array data based on variance and bias. Bioinformatics 2003, 19(2):185-193.
12. Dennis G Jr, Sherman BT, Hosack DA, Yang J, Gao W, Lane HC, Lem-picki RA: DAVID: Database for Annotation, Visualization, and Integrated Discovery. Genome Biol 2003, 4(5):P3.
13. The Cancer Genome Anatomy Project [http://cgap.nci.nih.gov/ Pathways/]
14. Mendez E, Cheng C, Farwell DG, Ricks S, Agoff SN, Futran ND, Wey-muller EA Jr, Maronian NC, Zhao LP, Chen C: Transcriptional expression profiles of oral squamous cell carcinomas. Cancer
2002, 95(7):1482-1494.
15. Ziober AF, Patel KR, Alawi F, Gimotty P, Weber RS, Feldman MM, Chalian AA, Weinstein GS, Hunt J, Ziober BL: Identification of a gene signature for rapid screening of oral squamous cell car-cinoma. Clin Cancer Res 2006, 12(20 Pt 1):5960-5971.
16. Chung CH, Parker JS, Karaca G, Wu J, Funkhouser WK, Moore D, Butterfoss D, Xiang D, Zanation A, Yin X, et al.: Molecular classifi-cation of head and neck squamous cell carcinomas using pat-terns of gene expression. Cancer Cell 2004, 5(5):489-500. 17. Meric F, Hunt KK: Translation initiation in cancer: a novel
tar-get for therapy. Mol Cancer Ther 2002, 1(11):971-979.
18. Hidalgo M, Rowinsky EK: The rapamycin-sensitive signal trans-duction pathway as a target for cancer therapy. Oncogene
2000, 19(56):6680-6686.
19. Palakurthi SS, Fluckiger R, Aktas H, Changolkar AK, Shahsafaei A, Harneit S, Kilic E, Halperin JA: Inhibition of translation initiation mediates the anticancer effect of the n-3 polyunsaturated fatty acid eicosapentaenoic acid. Cancer Res 2000, 60(11):2919-2925.
20. Honeycutt KA, Chen Z, Koster MI, Miers M, Nuchtern J, Hicks J, Roop DR, Shohet JM: Deregulated minichromosomal mainte-nance protein MCM7 contributes to oncogene driven tumor-igenesis. Oncogene 2006, 25(29):4027-4032.
21. Warburg O: On the origin of cancer cells. Science 1956, 123(3191):309-314.
22. Assaily W, Benchimol S: Differential utilization of two ATP-gen-erating pathways is regulated by p53. Cancer Cell 2006, 10(1):4-6.
23. Cuezva JM, Krajewska M, de Heredia ML, Krajewski S, Santamaria G, Kim H, Zapata JM, Marusawa H, Chamorro M, Reed JC: The bioen-ergetic signature of cancer: a marker of tumor progression. Cancer Res 2002, 62(22):6674-6681.
24. Jordan MA: Mechanism of action of antitumor drugs that interact with microtubules and tubulin. Curr Med Chem Antican-cer Agents 2002, 2(1):1-17.
25. [http://www.library.unsw.edu.au/~thesis/adt-NUN/public/adt-NUN20070830.132800/index.html].
26. Mendez E, Fan W, Choi P, Agoff SN, Whipple M, Farwell DG, Futran ND, Weymuller EA Jr, Zhao LP, Chen C: Tumor-specific genetic expression profile of metastatic oral squamous cell carci-noma. Head Neck 2007, 29(9):803-814.