R E S E A R C H A R T I C L E
Open Access
Convergent validity of the EQ-5D-3L in a
randomized-controlled trial of the Housing
First model
Nicole Kozloff
1,2,3,4*, Andrew D. Pinto
2,5,6,7, Vicky Stergiopoulos
1,2,3,4, Stephen W. Hwang
2,4,7,8,9,
Patricia O
’
Campo
2,7and Ahmed M. Bayoumi
2,4,8,9Abstract
Background:Health utility assessments are important for economic evaluations but few instruments have been validated in homeless people with mental illness. We examined the convergent validity of the EuroQol-5 Dimension 3-level questionnaire (EQ-5D-3L) as a measure of quality of life in homeless adults with mental illness.
Methods:Data were from Toronto participants in At Home/Chez Soi, a 24-month randomized controlled trial of Housing First (immediate access to scattered site housing and mental health support services) compared to treatment as usual for homeless adults with a mental disorder (n= 575). Participants completed the EQ-5D-3L at 6 month intervals. We tested convergent validity, hypothesizing strong correlation (r> 0.6) with the Lehman Quality of Life Interview 20 (QOLI-20) index and moderate correlations (r> 0.3) with the Colorado Symptom Index (CSI), Recovery Assessment Scale (RAS), and number of comorbidities. We also examined correlations between EQ-5D-3L scores and the QOLI-20 over time using a linear mixed-effects model.
Results:The EQ-5D-3L was not strongly correlated with the QOLI-20 (r ranged from 0.31–0.52 at various time points). The EQ-5D-3L was moderately correlated with the CSI, RAS, and number of comorbidities. The Snijders/ Bosker r2for longitudinal validity between the EQ-5D-3L and QOLI-20 within subjects over time was 0.2094 (square-rootr= 0.4576).
Conclusions:The EQ-5D-3L did not demonstrate strong convergent validity in homeless people with mental illness but was moderately correlated with several instruments. Further research is warranted to determine the optimal method for measuring health utilities in this population.
Trial registration:International Standard Randomised Control Trial RegistryISRCTN42520374assigned on August 18, 2009.
Keywords:Vulnerable populations/access to care, Psychiatry, Utility measurement, EQ-5D, QOL in special populations
Background
Homelessness is associated with increased mortality and morbidity relative to the general population, including a high prevalence of mental health and sub-stance use disorders [1]. Evaluating programs to address homelessness requires accurate measurement of the asso-ciated health, social, and economic consequences. Because
such interventions can be expensive, demonstrating that programs are cost-effective is important for health policy decision makers. Cost-effectiveness analyses in health typ-ically rely on outcome measures such as quality adjusted life years, which integrate survival and quality of life mea-sured using preference-based instruments that produce utility scores [2]. Utilities are anchored at 0 (equivalent to death) and 1 (equivalent to best possible health), although utility scales can also have negative values for health states that are considered worse than death [3]. Utilities can be eliciteddirectlyfrom interviews with individuals using in-struments such as the standard gamble or time trade-off or estimatedindirectlyfrom generic health-related quality
© The Author(s). 2019Open Access This article is distributed under the terms of the Creative Commons Attribution 4.0 International License (http://creativecommons.org/licenses/by/4.0/), which permits unrestricted use, distribution, and reproduction in any medium, provided you give appropriate credit to the original author(s) and the source, provide a link to the Creative Commons license, and indicate if changes were made. The Creative Commons Public Domain Dedication waiver (http://creativecommons.org/publicdomain/zero/1.0/) applies to the data made available in this article, unless otherwise stated. * Correspondence:[email protected]
1
Centre for Addiction and Mental Health, 250 College Street, 7th floor, Toronto, ON M5T 1R8, Canada
of life questionnaires, in which individual responses to specific questions are transformed into utility scores based on weights, frequently derived from a sample of commu-nity members [4]. Indirect utilities are preferred by some economists who view community ratings as the most appropriate approach to capture preferences for societal-level decision making [5]. They may also require less cognitive effort [6] and cause less distress [7] than direct methods, so may be more acceptable to participants, par-ticularly those with mental illness.
The EuroQol-5 Dimension 3-level questionnaire (EQ-5D-3L) is a popular indirect utility instrument [8]. It has been recommended as the preferred method for measur-ing health-related quality of life by the UK’s National Institute for Health and Care Excellence (NICE), except in patient populations for which it performs poorly on tests of construct validity and responsiveness [9]. A re-cent comprehensive report on the use of generic preference-based measures of health in mental health populations concluded that the EQ-5D and 36-Item Short Form Survey (SF-36) (another indirect utility in-strument) achieve an adequate level of psychometric performance in patients with depression and, to some extent, in patients with anxiety and personality disorder; however, results were mixed in patients with serious mental illness such as schizophrenia and bipolar dis-order and the report concluded that further validation studies were needed [10]. While specific generic health status instruments have been tested in homeless popula-tions [11,12], there have been few efforts to validate in-direct health utility measures. The EQ-5D-3L has previously been administered to people who are home-less although its validity in this population is uncertain. A Swedish study demonstrated lower EQ-5D-3L scores among homeless adults compared to population norms, with significantly lower scores among those sleeping
“rough” (in a setting not intended for habitation) and those reporting symptoms of mental illness [13]. A To-ronto study examined the EQ-5D-3L in individuals accepted into supportive housing compared with those on a wait list over time [14]. However, neither study
examined its convergent validity with other measures of quality of life and health.
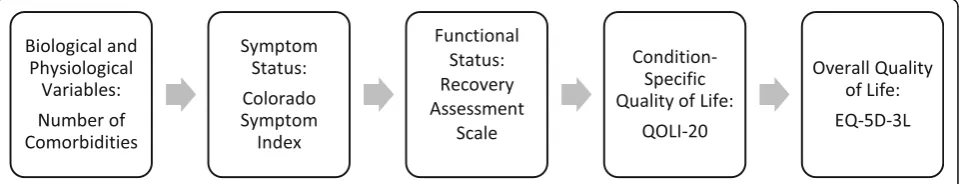
Convergent validity is a measure of how closely a scale relates to measures of other constructs to which it should be related [15]. One highly-cited conceptual model developed by Wilson and Cleary positions bio-logical and physiobio-logical variables, symptom status, functional status, and general health perceptions as be-ing causally associated with overall quality of life [16]. Thus, our objective was to test the convergent validity of the EQ-5D-3L with other health status instruments within the context of the Toronto, Ontario site of the At Home/Chez Soi study, a randomized controlled trial of Housing First in people who are homeless and have men-tal illness. The Housing First model provided access to scattered-site housing of the individual’s choice through the use of rent supplements and support services without mandating sobriety or psychiatric treatment. We used the Wilson and Cleary model to guide our hypotheses about the relationship between overall quality of life (as mea-sured with the EQ-5D-3L) and other measures in our population (Fig.1) [16]. We hypothesized that constructs that were more proximal to the EQ-5D-3L according to this conceptual framework should be more strongly correlated than constructs more distal in the model. Specifically, we hypothesized that the EQ-5D-3L would be strongly correlated with the Lehman Quality of Life Interview 20 (QOLI-20) index, a well-established qual-ity of life measure for this population [17], and moder-ately correlated with the Recovery Assessment Scale [18, 19], Colorado Symptom Index [20, 21], and num-ber of comorbidities. We also examined whether the EQ-5D-3L achieved longitudinal convergent validity by examining correlation over time with the QOLI-20.
Methods
Study overview and participants
At Home/Chez Soi trial participants were recruited be-tween 2009 and 2011. Each participant was followed for up to 24 months and the study terminated in 2013. Par-ticipants were eligible if they were aged 18 or older, were
Fig. 1Conceptual model guiding hypotheses about convergent validity of EQ-5D-3L with other measures in At Home/Chez Soi. Based on Wilson and Cleary’s model linking clinical variables with health-related quality of life, we hypothesized that the EuroQol-5 Dimension 3-level
[image:2.595.59.540.594.686.2]currently homeless or precariously housed, and had a mental disorder based on Diagnostic and Statistical Manual of Mental Disorders, 4th Edition criteria as de-termined by the Mini International Neuropsychiatric Interview (MINI) at study entry [22]. Absolute home-lessness was defined as having no fixed place to stay for 7 or more nights and little likelihood of obtaining ac-commodation in the upcoming month; precariously housed was defined as primarily residing in a Single Room Occupancy, rooming house, or hotel/motel, with 2 or more episodes of absolute homelessness in the past year. Individuals were excluded if they were already cli-ents of an assertive community treatment (ACT) or in-tensive case management (ICM) team, did not have legal status in Canada, or did not meet a strict definition of homelessness. Participants were recruited from commu-nity agencies that serve people who are homeless, insti-tutions (e.g., healthcare facilities, prisons and jails), and directly from the street.
All study participants were stratified by level of need.
“High needs” individuals: 1) scored below 62 on the Multnomah Community Ability Scale (MCAS) [23, 24], indicating poor community functioning; 2) had a MINI diagnosis of current psychotic or bipolar disorder or psychotic symptoms documented by the interviewer or referring provider at eligibility screening; and 3) had 2 or more hospitalizations for mental illness in any 1 of the 5 years prior to enrolment, comorbid substance use dis-order, or answered “yes,” “don’t know,” or declined to
answer a question about recent arrest or incarceration. All other eligible participants were classified as “ moder-ate needs.” Patients were randomized according to level of need using adaptive randomization procedures which continually adjust the probability of being assigned to intervention or treatment as usual based on the number of participants already assigned, to increase the likeli-hood of achieving a balanced number of participants between groups [25].
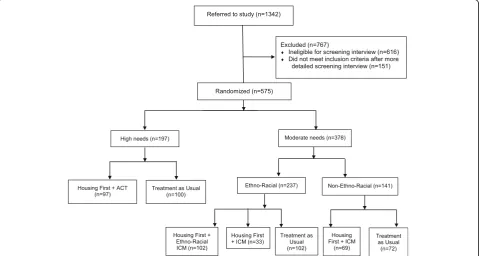
According to the study protocol, as part of the Hous-ing First model, participants received psychosocial sup-ports geared to their level of need: ACT for high needs participants, and ICM for moderate needs participants. ACT is a mental health treatment model delivered by a multidisciplinary team (including a psychiatrist, nurse, and peer specialist) with a participant to staff ratio of 10 to 1 or less. The ACT Team met daily and provided crisis coverage at all hours. ICM is a mental health treat-ment model delivered primarily by a single worker with a participant to staff ratio of 20 to 1 or less. Participants were discussed at weekly case conferences and crisis coverage was available 12 h per day, 7 days per week. In Toronto, moderate needs participants who self-identified as members of a minority ethno-racial group were given a choice to participate in a regular ICM program or an ethno-racial focused ICM program, as long as space was available in both groups. We analyzed data from partici-pants who received ACT, ICM, locally-adapted ethno-racial ICM, and treatment as usual (n= 575; Fig.2).
[image:3.595.59.539.446.702.2]Ethics, consent and permissions
Individuals provided verbal consent to be screened for eligibility and to hear more about the study. Those who met inclusion criteria were assessed for capacity to con-sent before written informed concon-sent was obtained from all individual participants included in the study. The study was approved by the Research Ethics Board of St. Michael’s Hospital and was prospectively registered with the International Standard Randomised Control Trial Registry (ISRCTN42520374). Full details of the study protocol have been published [25].
Measures
Our primary measure of interest was the EQ-5D-3L, which captures 5 dimensions (mobility, self-care, usual activities, pain/discomfort, and anxiety/depression). The EQ-5D-3L measures each dimension at 3 levels (no problems, some/moderate problems, and extreme prob-lems/unable to perform the activity), generating 243 dis-tinct health states. We used Canadian index values to calculate community-weighted utility scores [26].
The QOLI-20 index is a quality of life measure devel-oped for use in people with mental illness, which assesses satisfaction with family relationships, social relationships, finances, leisure, living situation, safety, and overall quality of life [17]. The QOLI-20 has demonstrated reliability and validity in people with severe mental illness, with lower scores in homeless compared with housed people with se-vere mental illness [27,28]. The CSI assesses presence and frequency of mental health symptoms [20,21], with dem-onstrated reliability, construct validity and responsiveness in homeless adults receiving treatment for mental illness or substance abuse [21,29]. The RAS assesses the extent to which participants live a satisfying life within the con-straints of a mental illness [18, 19]. In a recent trial of Housing First in homeless people with schizophrenia and bipolar disorder, it demonstrated satisfactory reliability and sensitivity to change, and strong correlation with the CSI and a quality of life measure [30]. Instruments were administered every 6 months except for the RAS which was administered at baseline and at 24 months.
At baseline, participants also reported which medical conditions they had experienced from a specified list of 29 health states (number of comorbidities) and answered questions about their demographic characteristics. At each 6-month visit, interviewers indicated their confi-dence in participants’ responses (rated as “completely confident,” “some doubts,” or “no confidence”) and assessed participants’apparent degree of thought process impairment based on an item from the MCAS.
Analysis and hypotheses
We characterized the study population and distribution of EQ-5D-3L index scores using descriptive statistics.
We pre-specified 4 convergent validity hypotheses. We hypothesized that the EQ-5D-3L would be strongly cor-related (absolute value of the correlation coefficient r> 0.60 at each measurement) [31–33] with the QOLI-20, the study instrument measuring condition-specific qual-ity of life, which we deemed to be most proximally re-lated to generic/overall quality of life, and that with the strongest evidence for validity in our study population [27,28]. We hypothesized that the EQ-5D-3L would be at least moderately correlated (absolute value ofr> 0.30 at each measurement) to each of the CSI, RAS, and number of comorbidities, measuring constructs that we consider more distally related to overall quality of life. We performed Pearson’s correlation tests for each pair of measures, which rely on the assumptions that variables compared must be interval or ratio measurements, that variables are approximately normally distributed, and that there is a linear relationship between the 2 variables. Based on the assumption that data for the EQ-5D-3L and the QOLI-20, CSI, RAS, and number of comorbidities were missing at random, and according to guidelines for reporting analysis potentially affected by missing data [34], we used multiple imputation to account for missing data in our correlation calculations. We used multivariate normal regression to impute missing values of the EQ-5D-3L, QOLI-20, CSI, RAS, and number of comorbid-ities using 10 datasets and including the following variables in the imputation model: age, gender, ethni-city, level of need as defined by the study protocol, baseline alcohol dependence, baseline substance use de-pendence, treatment assignment, and time. We calculated confidence intervals using bias-corrected bootstrap confi-dence intervals with 500 replications for each calculation. We also used complete case analysis to perform Pearson’s correlation tests as well as Spearman’s rank correlation tests, which do not assume a normal distribution or linear relationship.
We performed a linear mixed-effects repeated measure regression analysis to examine the association between EQ-5D-3L scores and QOLI-20 scores over time; this simple model accounted for the fact that measurements were repeated in the same individuals over time. We cal-culated the Snijders/Bosker r2, an established method for multilevel data [36,37]. The funding source had no role in the study. We conducted all analyses in Stata 15.1 and used ap-value threshold of 0.05 for significance testing.
Results
Most study participants (69%) were male, the median age was 41 years, the median lifetime duration of homeless-ness was 36 months, and the median longest period of homelessness was 12 months (Table1). Only 5% of partici-pants were employed and nearly all (95%) met criteria for
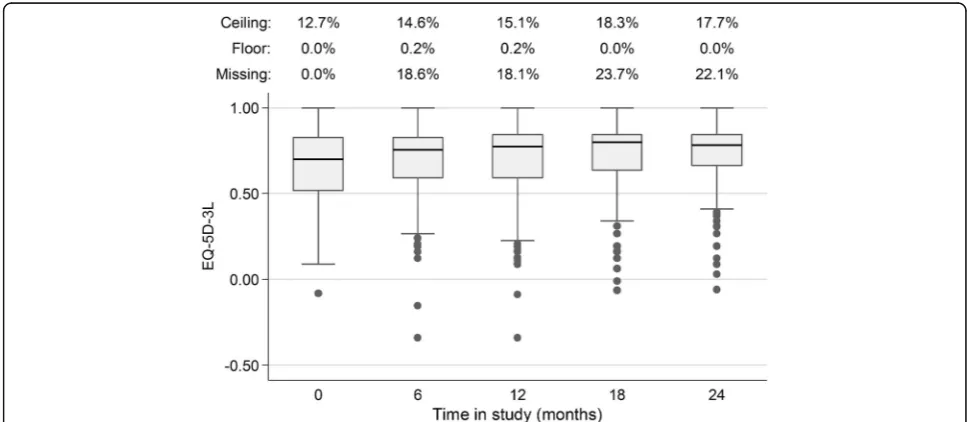
“absolute”homelessness, Baseline EQ-5D-3L index scores were similar across treatment groups with an overall mean score of 0.65 and median of 0.70. The Canadian scoring algorithm does not produce scores from 0.85 to 0.99, resulting in a discontinuity in the distribution of index scores (Fig. 3). Over time, median EQ-5D-3L index scores increased, distributions narrowed, more
participants reported scores at the ceiling, and the propor-tion of participants with missing data increased (Fig. 4). The median score for the entire sample was 0.70 (inter-quartile range, IQR 0.52–0.83) at baseline, 0.77 (IQR 0.59–0.84) at 12 months, and 0.78 (IQR 0.66–0.84) at 24 months. Across all time points, 15.7% of all EQ-5D-3L index scores were at the ceiling and 16.5% were missing.
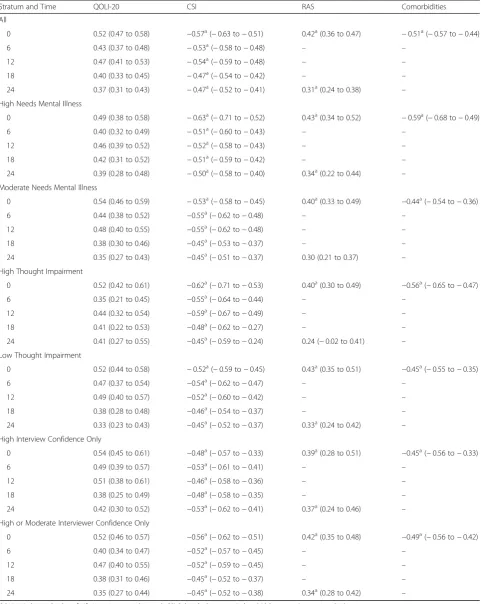
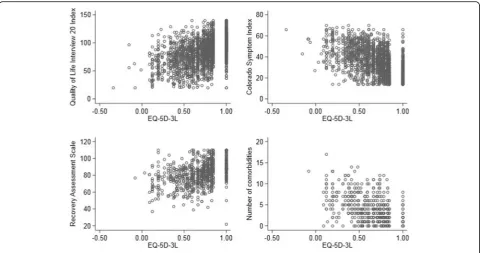
In correlation calculations using multiple imputation, the EQ-5D-3L did not meet our pre-specified hypothesis of strong correlation (|r| > 0.60) with the QOLI-20 at any time point (Table2 and Fig.5). The EQ-5D-3L was moderately correlated (|r| > 0.3) with the CSI and RAS at all time points and with the number of medical co-morbidities at baseline, meeting our pre-specified hy-potheses for tests of validity.
[image:5.595.54.543.392.707.2]Results were similar when we stratified analyses by level of need or degree of thought impairment or when we re-stricted analyses to only those instances in which the interviewer confidence in responses was at least high or at least moderate (Table 2). Similarly, analyzing the data using complete case analysis and a non-parametric test did not meaningfully change the results (Additional file1). Using complete case analysis, without multiple imputation
Table 1Baseline Characteristics of Toronto At Home/Chez Soi Participants
High needs (N= 197) Moderate needs (N= 378)
ACT (N= 97) Treatment as Usual (N= 100)
Ethno-Racial ICM (N= 102)
ICM (N= 102) Treatment as Usual (N= 174)
N % N % N % N % N %
Age, years–median (IQR) 39 (29–47) 41 (31–50) 35 (27–48) 44 (34–47) 41 (30–40)
Male 64 66.0 79 79.0 65 63.7 73 71.6 113 64.9
Ethnic identitya
Non-ethno-racial 43 44.3 > 40 > 40 0 0 59 57.8 64 36.8
Aboriginal 7 7.1 ≤5 ≤5 0 0 10 9.8 8 4.6
Other ethno-racial minority 47 48.5 54 54.0 102 100 33 32.4 102 58.6
Educationb
Less than high school 48 49.5 53 53.5 42 41.2 61 59.8 75 43.4
Completed high school 16 16.5 22 22.2 17 16.7 17 16.7 36 20.8
Some post-secondary school 33 34.0 24 24.2 43 42.2 24 23.5 62 35.8
Homelessness (months)
Lifetime: median (IQR) 41 (14–84) 60 (23–114) 18 (6–36) 48 (12–120) 36 (12–72)
Longest period: median (IQR) 18 (7–48) 24 (8–60) 11 (4–18) 18 (6–54) 12 (5–36)
Thought impairment 78 80.4 75 75 29 28.4 15 14.7 32 18.9
Baseline EQ-5D score
Mean ± SD 0.67 ± 0.26 0.67 ± 0.26 0.64 ± 0.23 0.62 ± 0.22 0.66 ± 0.21
Median (IQR) 0.73(0.49–0.83) 0.71(0.46–0.83) 0.70(0.52–0.83) 0.66 (0.49–0.78) 0.67(0.54–0.83)
Baseline EQ-5D score at floor 0 0 0 0 0 0 0 0 0 0
Baseline EQ-5D score at ceiling 18 18.6 22 22.0 10 9.8 7 6.9 16 9.2
ACTassertive community treatment,ICMintensive case management,IQRinterquartile range,SDstandard deviation a
The distribution of ethnic identity is suppressed to prevent small cells (N≤5) and preserve confidentiality b
to account for missing data, the EQ-5D-3L no longer sur-passed the threshold for moderate correlation with the RAS at 24 months.
The Snijders/Bosker r2 for longitudinal validity be-tween the EQ-5D-3L and QOLI-20 within subjects was 0.2094, indicating the proportion of variance in QOLI-20 scores for individuals explained by variance in EQ-5D-3L scores over time. The square root of this value, 0.4576, is analogous to the correlation coefficients, r, in the cross-sectional analyses.
Discussion
In a study of Housing First for homeless adults with men-tal illness, the EQ-5D-3L was moderately correlated with scores from the QOLI-20 at each study time point and in the longitudinal analysis. This finding did not support our pre-specified hypothesis that there would be a strong cor-relation with the QOLI-20, a condition-specific quality of life instrument that has been extensively evaluated. Never-theless, we found that the EQ-5D-3L met 3 tests of con-vergent validity, demonstrating moderate correlation with
Fig. 3Frequency distribution of baseline EQ-5D-3L index scores
[image:6.595.56.540.87.305.2] [image:6.595.55.539.470.681.2]Table 2Correlations between EQ-5D-3L and Other Outcome Measures Using Multiple Imputation
Stratum and Time QOLI-20 CSI RAS Comorbidities
All
0 0.52 (0.47 to 0.58) −0.57a(−0.63 to−0.51) 0.42a(0.36 to 0.47) −0.51a(−0.57 to−0.44)
6 0.43 (0.37 to 0.48) −0.53a(−0.58 to−0.48) – –
12 0.47 (0.41 to 0.53) −0.54a(−0.59 to−0.48) – –
18 0.40 (0.33 to 0.45) −0.47a(−0.54 to−0.42) – –
24 0.37 (0.31 to 0.43) −0.47a(−0.52 to−0.41) 0.31a(0.24 to 0.38) –
High Needs Mental Illness
0 0.49 (0.38 to 0.58) −0.63a(−0.71 to−0.52) 0.43a(0.34 to 0.52) −0.59a(−0.68 to−0.49)
6 0.40 (0.32 to 0.49) −0.51a(−0.60 to−0.43) – –
12 0.46 (0.39 to 0.52) −0.52a(−0.58 to−0.43) – –
18 0.42 (0.31 to 0.52) −0.51a(−0.59 to−0.42) – –
24 0.39 (0.28 to 0.48) −0.50a(−0.58 to−0.40) 0.34a(0.22 to 0.44) –
Moderate Needs Mental Illness
0 0.54 (0.46 to 0.59) −0.53a(−0.58 to−0.45) 0.40a(0.33 to 0.49) −0.44a(−0.54 to−0.36)
6 0.44 (0.38 to 0.52) −0.55a(−0.62 to−0.48) – –
12 0.48 (0.40 to 0.55) −0.55a(−0.62 to−0.48) – –
18 0.38 (0.30 to 0.46) −0.45a(−0.53 to−0.37) – –
24 0.35 (0.27 to 0.43) −0.45a(−0.51 to−0.37) 0.30 (0.21 to 0.37) –
High Thought Impairment
0 0.52 (0.42 to 0.61) −0.62a(−0.71 to−0.53) 0.40a(0.30 to 0.49) −0.56a(−0.65 to−0.47)
6 0.35 (0.21 to 0.45) −0.55a(−0.64 to−0.44) – –
12 0.44 (0.32 to 0.54) −0.59a(−0.67 to−0.49) – –
18 0.41 (0.22 to 0.53) −0.48a(−0.62 to−0.27) – –
24 0.41 (0.27 to 0.55) −0.45a(−0.59 to−0.24) 0.24 (−0.02 to 0.41) –
Low Thought Impairment
0 0.52 (0.44 to 0.58) −0.52a(−0.59 to−0.45) 0.43a(0.35 to 0.51) −0.45a(−0.55 to−0.35)
6 0.47 (0.37 to 0.54) −0.54a(−0.62 to−0.47) – –
12 0.49 (0.40 to 0.57) −0.52a(−0.60 to−0.42) – –
18 0.38 (0.28 to 0.48) −0.46a(−0.54 to−0.37) – –
24 0.33 (0.23 to 0.43) −0.45a(−0.52 to−0.37) 0.33a(0.24 to 0.42) –
High Interview Confidence Only
0 0.54 (0.45 to 0.61) −0.48a(−0.57 to−0.33) 0.39a(0.28 to 0.51) −0.45a(−0.56 to−0.33)
6 0.49 (0.39 to 0.57) −0.53a(−0.61 to−0.41) – –
12 0.51 (0.38 to 0.61) −0.46a(−0.58 to−0.36) – –
18 0.38 (0.25 to 0.49) −0.48a(−0.58 to−0.35) – –
24 0.42 (0.30 to 0.52) −0.53a(−0.62 to−0.41) 0.37a(0.24 to 0.46) –
High or Moderate Interviewer Confidence Only
0 0.52 (0.46 to 0.57) −0.56a(−0.62 to−0.51) 0.42a(0.35 to 0.48) −0.49a(−0.56 to−0.42)
6 0.40 (0.34 to 0.47) −0.52a(−0.57 to−0.45) – –
12 0.47 (0.40 to 0.55) −0.52a(−0.59 to−0.45) – –
18 0.38 (0.31 to 0.46) −0.45a(−0.52 to−0.37) – –
24 0.35 (0.27 to 0.44) −0.45a(−0.52 to−0.38) 0.34a(0.28 to 0.42) –
QOLI-20Lehman Quality of Life Interview 20 index total,CSIColorado Symptom Index,RASRecovery Assessment Scale a
the presence and frequency of mental health symptoms, recovery as measured by the RAS, and number of medical comorbidities.
There are three leading explanations for our finding that the EQ-5D-3L did not strongly correlate with the QOLI-20 in this sample. First, we observed large variation in baseline EQ-5D-3L index scores. Random measurement error is well-known to attenuate the correlation coefficient between two variables [38]. Error could be introduced in this sample if participants did not answer the EQ-5D-3L questionnaire accurately due to symptoms of their mental illness. Indeed, in previous studies, the content validity of the EQ-5D-3L compared with disorder-specific scales was lower among people with schizophrenia than among those with other mental disorders [35]. Thought impairment, a symptom of schizophrenia and other severe mental illness as well as intoxication, may be one cause of inaccurate reporting; importantly, 78% of high needs and 20% of moderate needs participants in our sample demonstrated thought impairment. Furthermore, 72% of the 1500 participants in the full At Home/Chez Soi sample who completed neuropsychological assessments dem-onstrated some degree of cognitive impairment [39]. However, sensitivity analyses in which we restricted our evaluations to individuals with lower degree of thought impairment or to those responses in which interviewers had high confidence did not significantly change our results, making it less likely that measure-ment error related to inaccurate reporting secondary to thought impairment fully explains our findings.
A second explanation for our findings is that the EQ-5D-3L and QOLI-20 are measuring different domains of quality of life. The EQ-5D-3L was developed as a generic utility instrument to be used across health states. Thus, its domains are general and include mobility, self-care, usual activities, pain and discomfort, and depression and anxiety; perhaps not surprisingly, we found that the cor-relation between the EQ-5D-3L and number of medical comorbidities exceeded our threshold for moderate cor-relation. However, qualitative research studies indicate that the domains of the EQ-5D-3L have only modest overlap with domains of quality of life identified as im-portant by people with mental health problems [10,40]. The domains included in the QOLI-20 (such as satisfac-tion with living situasatisfac-tion and finances) may be more relevant for people who are homeless and living with mental illness. Given the importance of effectively meas-uring health utility for cost effectiveness analysis in this population, it is critical to determine whether other in-direct utility instruments with a larger number of do-mains, such as the Health Utilities Index [41, 42], have better measurement properties than the EQ-5D-3L.
Finally, the levels included in the EQ-5D-3L may not be sufficiently discriminative to distinguish important quality of life effects. At any time, fewer than 4% of par-ticipants endorsed the most severe (third) level of the domains related to mobility (“I am confined to bed”), self-care (“I am unable to wash or dress myself”), or usual activities (“I am unable to perform my usual activ-ities”). These skewed distributions may lead to problems
[image:8.595.58.539.87.340.2]with discrimination for participants with varying degrees of difficulty in these dimensions who would all be grouped into the second level in the current response scale. Furthermore, the summary score of the EQ-5D-3L has a discontinuity at the upper range, further limiting its ability to discriminate between individuals at the high end of the scale. A newer version of the EQ-5D, released after our study was initiated, incorporates 5 levels for each domain, does not have a discontinuity and is less prone to ceiling effects [43–45].
Our study has some limitations. We had a large propor-tion of missing data, as high as 23.7% at 18 months, and it is possible that participants with poorer quality of life may have been more likely to be lost to follow-up (and that miss-ing EQ-5D-3L scores would have been systematically lower). However, convergent validity between the EQ-5D-3L and other instruments was not better at baseline, when data were complete, and did not change significantly when ana-lyzed using multiple imputation [34, 46]. Furthermore, the linear mixed effects model is robust to missing data under a missing at random assumption [47,48]. Second, although all of the interviewers were trained, they were not blinded to treatment assignment and we were not able to control for possible individual interviewer effects in our analyses. Fi-nally, we used data only from homeless adults with mental illness in Toronto, a large urban centre in Canada. Our find-ings may not be generalizable to other settfind-ings.
Conclusions
We know of no other study that has assessed the conver-gent validity of an indirect utility instrument in homeless adults with mental illness. We found only moderate sup-port for the EQ-5D-3L, suggesting that further psycho-metric testing, including with the EQ-5D-5L, is warranted to determine the optimal method for producing utility scores for this population. We urge caution when using the EQ-5D-3L as a measure of quality of life and also for the closely related concept of health utility, including in cost-utility analyses of health and social interventions for adults with severe mental illness and unstable social situa-tions. A finding of no difference in utility scores may be due to limitations of the instrument rather than lack of ef-fectiveness of the intervention. Until additional research is available, economic analyses should include a broad range of outcomes in sensitivity analyses.
Additional file
Additional file 1:Correlations between EQ-5D-3L and Other Outcome Measures Using Complete Case Analysis. (DOCX 16 kb)
Abbreviations
ACT:Assertive community treatment; CSI: Colorado Symptom Index; EQ-5D-3L: EuroQol-5 Dimension 3-level questionnaire; ICM: Intensive case management; IQR: Interquartile range; MCAS: Multnomah Community Ability
Scale; MINI: Mini International Neuropsychiatric Interview; NICE: National Institute for Health and Care Excellence; QOLI-20: Lehman Quality of Life Interview 20; RAS: Recovery Assessment Scale; SF-36: 36-Item Short Form Survey
Acknowledgements
The authors thank Jayne Barker Ph.D. (2008-11), Cameron Keller (2011-12), and Catharine Hume (2012-present) (Mental Health Commission of Canada At Home/Chez Soi National Project Leads), the National Research Team, the 5 site research teams, the site coordinators, and the numerous service and housing providers, as well as persons with lived experience, who have contributed to this project and the research. This research has been made possible through a financial contribution from Health Canada provided to the Mental Health Commission of Canada. The views expressed herein solely represent the authors.
Authors’contributions
NK collaborated on the analysis plan, analyzed the data, interpreted the findings and drafted the manuscript. ADP collaborated on the analysis plan, analyzed the data, interpreted the findings and critically revised the manuscript. VS, SWH, and PO are principal investigators on the At Home/ Chez Soi Trial and collaborated on the analysis plan and critically revised the manuscript. AMB oversaw all research activities including the analysis plan and data analysis, and contributed to the writing of the manuscript. All authors read and approved the final manuscript.
Funding
This research was made possible through a financial contribution from Health Canada provided to the Mental Health Commission of Canada. Dr. Kozloff was supported by a Canadian Institutes of Health Research Fellowship (Funding Reference Number 140822) and a NARSAD Young Investigator Award from the Brain & Behavior Research Foundation (Grant Number 23673). Dr. Bayoumi was supported by the Fondation Alma and Baxter Ricard Chair in Inner City Health at St. Michael’s Hospital, Toronto, Canada and the University of Toronto. This research has been made possible through a financial contribution from Health Canada provided to the Mental Health Commission of Canada. The funding body was not involved in the design of the study and collection, analysis and interpretation of data and in writing the manuscript.
Availability of data and materials
The At Home/Chez Soi project has a process by which interested investigators who would like to use the data for publication can make a formal request. The formal request is reviewed by a cross-site committee and as long as those particular analyses have not already been undertaken approval and data sharing can take place.
Ethics approval and consent to participate
The study was approved by the Research Ethics Board (REB) of St. Michael’s Hospital. Individuals provided verbal consent to be screened for eligibility and to hear more about the study. Those who met inclusion criteria were assessed for capacity to consent before written informed consent was obtained from all individual participants included in the study. These procedures were approved by the REB.
Consent for publication Not applicable.
Competing interests
The authors declare that they have no competing interests.
Author details
Medicine, Faculty of Medicine, University of Toronto, 500 University Avenue, 5th Floor, Toronto, ON M5G 1V7, Canada.7Dalla Lana School of Public Health, University of Toronto, Health Sciences Building, 155 College Street, 6th Floor, Toronto, ON M5T 3M7, Canada.8Department of Medicine, University of Toronto, Suite RFE 3-805, 200 Elizabeth Street, Toronto, ON M5G 2C4, Canada.9Division of General Internal Medicine, St. Michael’s Hospital, 30 Bond Street, Toronto, ON M5B 1W8, Canada.
Received: 21 February 2019 Accepted: 30 June 2019
References
1. Fazel S, Geddes JR, Kushel M. The health of homeless people in high-income countries: descriptive epidemiology, health consequences, and clinical and policy recommendations. Lancet. 2014;384:1529–40.
2. Weinstein MC, Siegel JE, Gold MR, Kamlet MS, Russell LB. Recommendations of the panel on cost-effectiveness in health and medicine. JAMA. 1996;276: 1253–8.
3. Brazier J, Ratcliffe J, Tsuchiya A, Solomon J. Measuring and valuing health for economic evaluation. Oxford: Oxford University Press; 2007. 4. Russell LB, Gold MR, Siegel JE, Daniels N, Weinstein MC. The role of
effectiveness analysis in health and medicine. Panel on cost-effectiveness in health and medicine. JAMA. 1996;276:1172–7. 5. Gold MR, Patrick DL, Torrance GW, Fryback DG, Hadom DC, Kamlet
MS, Daniels N, Weinstein MC. Identifying and valuing outcomes. In: Gold MR, Siegel JE, Russell LB, Weinstein MC, editors. Cost-effectiveness in health and medicine. New York: Oxford University Press; 1996.
6. Prosser LA, Grosse SD, Wittenberg E. Health utility elicitation: is there still a role for direct methods? Pharmacoeconomics. 2012;30:83–6.
7. Brazier J, Deverill M, Green C, Harper R, Booth A. A review of the use of health status measures in economic evaluation. Health Technol Assess. 1999;3:i-iv–1–164.
8. EuroQol Group. EuroQol--a new facility for the measurement of health-related quality of life. Health Policy. 1990;16:199–208.
9. National Institute for Health and Care Excellence. Guide to the methods of technology appraisal 2013. London: NICE; 2013.
10. Brazier J, Connell J, Papaioannou D, Mukuria C, Mulhern B, Peasgood T, Jones ML, Paisley S, O'Cathain A, Barkham M, et al. A systematic review, psychometric analysis and qualitative assessment of generic preference-based measures of health in mental health populations and the estimation of mapping functions from widely used specific measures. Health Technol Assess. 2014;18:vii-viii, xiii-xxv–1-188.
11. Garcia-Rea E, LePage JP. Reliability and validity of World Health Organization quality of Life-100 in homeless substance-dependent veteran population. J Rehabil Res Dev. 2008;45:619–25.
12. Riley ED, Bangsberg DR, Perry S, Clark RA, Moss AR, Wu AW. Reliability and validity of the SF-36 in HIV-infected homeless and marginally housed individuals. Qual Life Res. 2003;12:1051–8.
13. Sun S, Irestig R, Burstrom B, Beijer U, Burstrom K. Health-related quality of life (EQ-5D) among homeless persons compared to a general population sample in Stockholm County, 2006. Scand J Public Health. 2012;40:115–25.
14. Hwang SW, Gogosis E, Chambers C, Dunn JR, Hoch JS, Aubry T. Health status, quality of life, residential stability, substance use, and health care utilization among adults applying to a supportive housing program. J Urban Health. 2011;88:1076–90.
15. Streiner DL, Norman GR, Cairney J. Health measurement scales: a practical guide to their development and use. 5th ed. Oxford: Oxford University Press; 2014.
16. Wilson IB, Cleary PD. Linking clinical variables with health-related quality of life. A conceptual model of patient outcomes. JAMA. 1995;273:59–65. 17. Lehman AF. A quality of life interview for the chronically mentally ill. Eval
Program Plann. 1988;11:51–62.
18. Corrigan PW, Giffort D, Rashid F, Leary M, Okeke I. Recovery as a psychological construct. Community Ment Health J. 1999;35:231–9. 19. Corrigan PW, Salzer M, Ralph RO, Sangster Y, Keck L. Examining the factor
structure of the recovery assessment scale. Schizophr Bull. 2004;30:1035–41. 20. Boothroyd RA, Chen HJ. The psychometric properties of the Colorado
symptom index. Admin Pol Ment Health. 2008;35:370–8.
21. Conrad KJ, Yagelka JR, Matters MD, Rich AR, Williams V, Buchanan M. Reliability and validity of a modified Colorado symptom index in a national homeless sample. Ment Health Serv Res. 2001;3:141–53. 22. Sheehan DV, Lecrubier Y, Sheehan KH, Amorim P, Janavs J, Weiller E,
Hergueta T, Baker R, Dunbar GC. The Mini-international
neuropsychiatric interview (M.I.N.I.): the development and validation of a structured diagnostic psychiatric interview for DSM-IV and ICD-10. J Clin Psychiatry. 1998;59(Suppl 20):22–33;quiz 34-57.
23. Barker S, Barron N, McFarland BH, Bigelow DA. A community ability scale for chronically mentally ill consumers: part I. reliability and validity. Community Ment Health J. 1994;30:363–83.
24. Dickerson FB, Origoni AE, Pater A, Friedman BK, Kordonski WM. An expanded version of the Multnomah community ability scale: anchors and interview probes for the assessment of adults with serious mental illness. Community Ment Health J. 2003;39:131–7.
25. Goering PN, Streiner DL, Adair C, Aubry T, Barker J, Distasio J, Hwang SW, Komaroff J, Latimer E, Somers J, Zabkiewicz DM. The at home/ chez Soi trial protocol: a pragmatic, multi-site, randomised controlled trial of a housing first intervention for homeless individuals with mental illness in five Canadian cities. BMJ Open. 2011;1:e000323 002011-000323. Print 002011.
26. Bansback N, Tsuchiya A, Brazier J, Anis A. Canadian valuation of EQ-5D health states: preliminary value set and considerations for future valuation studies. PLoS One. 2012;7:e31115.
27. Lehman AF. Measures of quality of life among persons with severe and persistent mental disorders. Soc Psychiatry Psychiatr Epidemiol. 1996;31:78–88.
28. Lehman AF, Kernan E, DeForge BR, Dixon L. Effects of homelessness on the quality of life of persons with severe mental illness. Psychiatr Serv. 1995;46:922–6.
29. Greenwood RM, Schaefer-McDaniel NJ, Winkel G, Tsemberis SJ. Decreasing psychiatric symptoms by increasing choice in services for adults with histories of homelessness. Am J Community Psychol. 2005;36:223–38. 30. Girard V, Tinland A, el H M, French Housing First Study G, Boyer L, Auquier
P. Psychometric properties of the recovery measurement in homeless people with severe mental illness. Schizophr Res. 2015;169:292–7. 31. Mokkink LB, Terwee CB, Patrick DL, Alonso J, Stratford PW, Knol DL, Bouter
LM, de Vet HCW. The COSMIN checklist for assessing the methodological quality of studies on measurement properties of health status measurement instruments: an international Delphi study. Qual Life Res. 2010;19:539–49. 32. Nosyk B, Sun H, Bansback N, Guh DP, Li X, Barnett P, Bayoumi A, Griffin S, Joyce V, Holodniy M, et al. The concurrent validity and responsiveness of the health utilities index (HUI 3) among patients with advanced HIV/AIDS. Qual Life Res. 2009;18:815–24.
33. Swinscow TDV. Statistics at square one. Ninth ed. Southampton: BMJ Publishing Group; 1997.
34. Sterne JA, White IR, Carlin JB, Spratt M, Royston P, Kenward MG, Wood AM, Carpenter JR. Multiple imputation for missing data in epidemiological and clinical research: potential and pitfalls. BMJ. 2009;338:b2393.
35. Mulhern B, Mukuria C, Barkham M, Knapp M, Byford S, Soeteman D, Brazier J. Using generic preference-based measures in mental health: psychometric validity of the EQ-5D and SF-6D. Br J Psychiatry. 2014;205:236–43. 36. Snijders TAB, Bosker R. Multilevel analysis: an introduction to basic and
applied multilevel analysis. 2nd ed. London: Sage; 2012.
37. Snijders TAB, Bosker RJ. Modeled variance in two-level models. Sociol Methods Res. 1994;22:342–63.
38. Rosner B, Willett WC. Interval estimates for correlation coefficients corrected for within-person variation: implications for study design and hypothesis testing. Am J Epidemiol. 1988;127:377–86.
39. Stergiopoulos V, Cusi A, Bekele T, Skosireva A, Latimer E, Schutz C, Fernando I, Rourke SB. Neurocognitive impairment in a large sample of homeless adults with mental illness. Acta Psychiatr Scand. 2015; 131:256–68.
40. Connell J, O'Cathain A, Brazier J. Measuring quality of life in mental health: are we asking the right questions? Soc Sci Med. 2014;120:12–20.
41. Feeny D, Furlong W, Torrance GW, Goldsmith CH, Zhu Z, DePauw S, Denton M, Boyle M. Multiattribute and single-attribute utility functions for the health utilities index mark 3 system. Med Care. 2002;40:113–28.
43. Herdman M, Gudex C, Lloyd A, Janssen M, Kind P, Parkin D, Bonsel G, Badia X. Development and preliminary testing of the new five-level version of EQ-5D (EQ-EQ-5D-5L). Qual Life Res. 2011;20:1727–36.
44. Craig BM, Pickard AS, Lubetkin EI. Health problems are more common, but less severe when measured using newer EQ-5D versions. J Clin Epidemiol. 2014;67:93–9.
45. Feng Y, Devlin N, Herdman M. Assessing the health of the general population in England: how do the three- and five-level versions of EQ-5D compare? Health Qual Life Outcomes. 2015;13:171.
46. Madley-Dowd P, Hughes R, Tilling K, Heron J. The proportion of missing data should not be used to guide decisions on multiple imputation. J Clin Epidemiol. 2019;110:63–73.
47. Bell ML, Kenward MG, Fairclough DL, Horton NJ. Differential dropout and bias in randomised controlled trials: when it matters and when it may not. BMJ. 2013;346:e8668.
48. Detry MA, Ma Y. Analyzing repeated measurements using mixed models. JAMA. 2016;315:407–8.
Publisher’s Note