RESEARCH ARTICLE
Feature selection and validated
predictive performance in the domain
of
Legionella pneumophila
: a comparative study
Tjeerd van der Ploeg
1,2*and Ewout W. Steyerberg
2Abstract
Background: Genetic comparisons of clinical and environmental Legionella strains form an essential part of outbreak investigations. DNA microarrays often comprise many DNA markers (features). Feature selection and the development of prediction models are particularly challenging in this domain with many variables and comparatively few subjects or data points. We aimed to compare modeling strategies to develop prediction models for classifying infections as clinical or environmental.
Methods: We applied a bootstrap strategy for preselecting important features to a database containing 222 Legionella pneumophila strains with 448 continuous markers and a dichotomous outcome (clinical or environmental). Feature selection was done with 50 bootstrap samples resulting in a top 10 of most important features for each of four modeling techniques: classification and regression trees (CART), random forests (RF), support vector machines (SVM) and least absolute shrinkage and selection operator (LASSO). Validation was done in a second bootstrap re-sampling loop (200×) for evaluation of discriminatory model performance according to the AUC.
Results: The top 5 of selected features differed considerably between the various modeling techniques, with only one common feature (“LePn.007B8”). The mean validated AUC-values of the SVM model and the CART model were 0.859 and 0.873 respectively. The LASSO and the RF model showed higher validated AUC-values (0.925 and 0.975 respectively).
Conclusions: In the domain of Legionella pneumophila, which comprises many potential features for classifying of infections as clinical or environmental, the RF and LASSO techniques provide good prediction models. The identifica-tion of potentially biologically relevant features is highly dependent on the technique used, and should hence be interpreted with caution.
© 2016 van de Ploeg and Steyerberg. This article is distributed under the terms of the Creative Commons Attribution 4.0 Interna-tional License (http://creativecommons.org/licenses/by/4.0/), which permits unrestricted use, distribution, and reproduction in any medium, provided you give appropriate credit to the original author(s) and the source, provide a link to the Creative Com-mons license, and indicate if changes were made. The Creative ComCom-mons Public Domain Dedication waiver (http://creativecom-mons.org/publicdomain/zero/1.0/) applies to the data made available in this article, unless otherwise stated.
Background
The bacterium Legionella pneumophila, the causa-tive agent for Legionnaires’ disease, is omnipresent in both natural and man-made aquatic environments. The major route of transmission is inhalation of the bacte-rium, which is spread into the air as an aerosol from its reservoir [1]. Genetic comparisons of clinical and envi-ronmental Legionella strains form an essential part of outbreak investigations [2, 3]. Such investigations
previously showed that the distribution of genotypes within clinical strains significantly differed from the dis-tribution in environmental strains [4–6].
To develop reliable statistical models for the discrimi-nation between clinical and environmental strains, mod-eling techniques are required which can stabilize the feature selection. DNA microarrays may comprise thou-sands of DNA markers (features, p) and only a few hun-dred or even only a few dozen subjects (n; the “p > n” problem) [7].
Common statistical approaches for selecting features include filter methods, wrapper methods and embed-ded methods. Filter methods preselect features using a
Open Access
*Correspondence: [email protected]
1 Department of Science, Medical Center Alkmaar/Inholland University,
Alkmaar, The Netherlands
univariate technique with respect to the outcome (T test, Mann–Whitney-test, Pearson correlation coefficients), without being tuned to a specific type of modeling tech-nique. By contrast, wrapper methods use a specific mod-eling technique to select features, and subsequently each selected feature set is used to train a model built with that same modeling technique; the performance of the model is usually tested on a hold-out set, resulting in a score for a specific feature set. Embedded methods are a catch-all group of techniques that perform feature selec-tion as part of the model construcselec-tion process [8, 9].
Popular feature selection methods nowadays are the least absolute shrinkage and selection operator method (LASSO) [10], recursive feature elimination, which is commonly used with support vector machines (SVM RFE) [11], and a backward feature selection method based on random forests (VARSEL RF) [12]. For stabiliz-ing the feature selection, several authors proposed the use of ensemble feature selection based on bootstrap samples [13–15], a widely used technique in prediction research [16]. Several authors discussed double bootstrap or nested bootstrap procedures for both feature selection and performance estimation [17–22].
The aim of the present study was to compare statis-tical models that can be used to discriminate between clinical and environmental strains using a small num-ber of features. We compared modeling techniques for developing prediction models with relevant genomic features related to pathogenicity. We focused on four modeling techniques: classification and regression trees (CART) [23], random forests (RF) [24], support vec-tor machines (SVM) [25] and least absolute shrinkage and selection operator (LASSO) [26]. We used a nested bootstrap procedure, one for feature selection and one for predictive performance validation for a fair evalu-ation of a prediction model based on a relatively small data set.
Methods Data
We analyzed the database of the Dutch National Legionella Outbreak Detection Programme as used before [27]. The database contained 222 Legionella pneu-mophila strains with 448 continuous markers and a dichotomous outcome. Of these strains, 49 were patient-derived strains from notified cases in the Netherlands in the period 2002–2006, and 173 were environmental strains that were collected during the source investiga-tion for those patients. The 448 continuous markers were coded as LePn.###L## (e.g. LePn.032E12). The data were collected prospectively and anonymously. According to Dutch regulations, neither medical nor ethical approval was required to conduct the study, as no medical
interventions were initiated and the study had no influ-ence on medical care nor on decision making.
Modeling techniques
We evaluated the modeling techniques CART, RF, SVM and LASSO, which are described below.
Classification and regression trees (CART)
The CART model is a tree-based classification and pre-diction model that uses recursive partitioning to split the training records into segments with similar output vari-able values. The modelling starts by examining the input variables to find the best split, measured by the reduction in an impurity index that results from the split. The split defines two subgroups, each of which is subsequently split into two further subgroups and so on, until the stop-ping criterion is met [23].
Random forest (RF)
Random forest is an ensemble classifier that consists of many decision trees and outputs the class that is the mode of the classes output by individual trees [24].
Each tree is constructed using the following algorithm:
1. Let the number of training cases be N, and the num-ber of variables in the classifier be M.
2. We are told the number m of input variables to be used to determine the decision at a node of the tree; m should be much lower than M.
3. Choose a training set for this tree by choosing n times with replacement from all N available training cases (i.e. take a bootstrap sample). Use the rest of the cases to estimate the error of the tree, by predict-ing their classes.
4. For each node of the tree, randomly choose m vari-ables on which to base the decision at that node. Cal-culate the best split based on these m variables in the training set.
5. Each tree is fully grown and not pruned (as may be done in constructing a normal tree classifier).
For prediction a new sample is pushed down the tree. It is assigned the label of the training sample in the termi-nal node it ends up in. This procedure is iterated over all trees in the ensemble, and the mode of the votes over all trees is used as the random forest prediction.
Support vector machine (SVM)
may particularly be suited to analyze data with large numbers of predictor variables. SVM has applications in many disciplines, including customer relationship man-agement, image recognition, bioinformatics, text mining concept extraction, intrusion detection, protein structure prediction, and voice and speech recognition [25].
Least absolute shrinkage selection operator (LASSO)
Given a set of input measurements x1, x2,. . ., xp and an
outcome measurement y, the LASSO fits a linear model:
ˆ
y=b0+b1×x1+b2×x2+ · · · +bp×xp.
It uses the following criterion: Minimize sum((y−ŷ)2)
subject to sum(|bj|) ≤ s.
The first sum is taken over the cases in the dataset. The bound “s” is a tuning parameter. If “s” is large, the con-straint has no effect and the solution is just the usual maximum likelihood regression of y on Bi(B1,. . ., B50). For smaller values of s (s ≥ 0) the regression coefficients are shrunken versions of the maximum likelihood esti-mates. Often, some of the coefficients bj are shrunk to
zero. We used cross-validation to estimate the best value for “s” [26], and a logistic link function rather than linear regression.
Reference techniques
As reference points for this evaluation, we applied the commonly used techniques VARSEL RF and SVM RFE to our database, which are examples of embedded meth-ods. VARSEL RF is a feature selection technique based on random forests with backward stepwise elimination of features that are not important. SVM RFE is a recursive feature elimination technique. It is based on support vec-tor machines, which eliminate feature redundancy result-ing in compact feature sets.
Model performance
We evaluated the stability of the feature selection and the validated performance by means of bootstrap re-sam-pling from the original database. The performance of a model resulting from a modeling technique was assessed using the area under the Receiver Operator Curve (AUC).
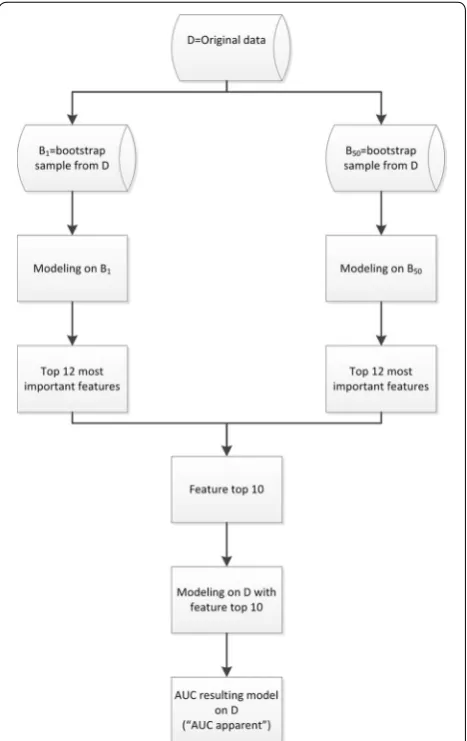
Modeling strategy
For a specific modeling technique, feature selection was done by bootstrap re-sampling from the original database D. We re-sampled 50 bootstraps Bi(B1,. . ., B50) from the original database D. We applied the specific modeling technique on each Bi and determined for each Bi the top
12 of most important features, leading to 50 × 12 = 600 important features. From these 600 features, the top 10 of features with the highest frequency was extracted. With this feature top 10, a model was developed on the original database D with the specific modeling technique. For the
resulting model the performance for the original data-base D was calculated (“AUC apparent”, Fig. 1).
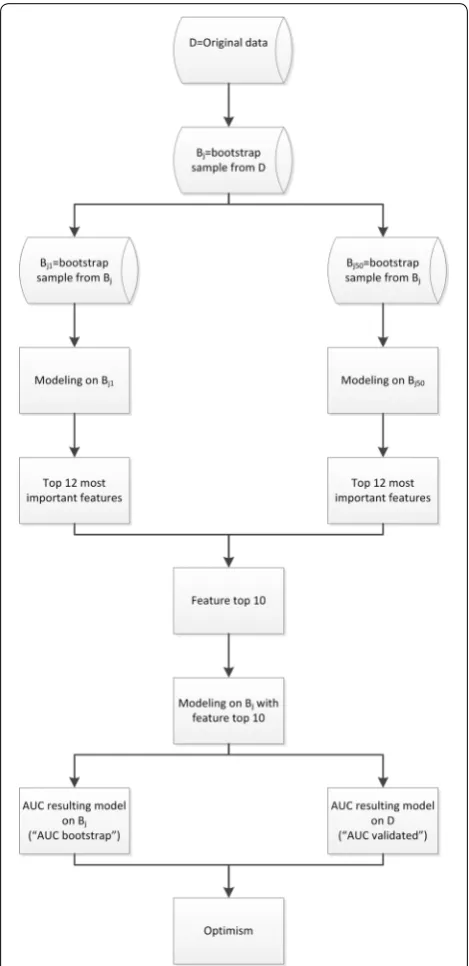
Validation of the strategy
To validate our strategy for a specific modeling tech-nique, we performed a bootstrap procedure. We re-sam-pled a bootstrap sample Bj from the original data base
D and from this bootstrap sample Bj, we re-sampled 50
independent bootstraps Bji
Bj1,. . ., Bj50
.
We applied the specific modeling technique on each Bji and determined for each Bji the top 12 of most
impor-tant features, leading to 50 × 12 = 600 important fea-tures. From these 600 features, the top 10 of features with the highest frequency was extracted. With this top 10 features, a model was developed on bootstrap sample Bj with the specific modeling technique. For the
result-ing model, the performance for Bj and the performance
for the original data base D were calculated (“AUC boot-strap” and “AUC validated” respectively). The optimism
[image:3.595.306.540.337.708.2]of the resulting model was calculated as “AUC bootstrap” minus “AUC validated”. This process was repeated 200 times (B1 to B200, Fig. 2).
Analysis
For the modeling and the analysis of these techniques, we used R 2.14, using default settings as far as possible. We used the libraries randomForest, caTools, rpart, caret, e1071, varSelRF and glmnet [28].
Results
Reference techniques
Feature selection with the reference techniques VARSEL RF and SVM RFE resulted in two different sets of fea-tures, only with LePn.007B8 as the common feature in the top 5 (Table 1). For the full list of features for each technique and for each bootstrap sample, we refer to Additional files 1 and 2. The mean validated AUC values of the models generated by these two techniques were 0.966 for VARSEL RF and 0.915 for SVM RFE (Table 2).
Other techniques
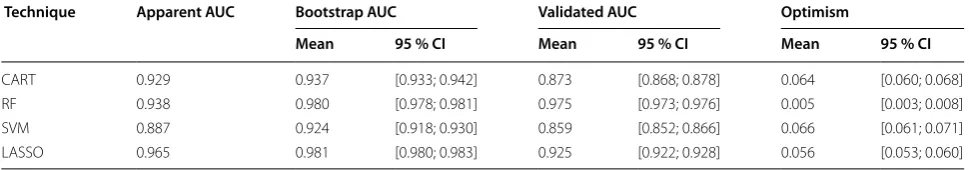
The top 5 of selected features differed among the other modeling techniques (CART, RF, SVM, LASSO). The only common feature in the top 5 of all four modeling techniques was feature LePn.007B8. Feature selection with RF resulted in four matches with feature selec-tion based on VARSEL RF, and feature selecselec-tion with LASSO resulted in three matches with feature selection with SVM RFE (Table 3). The selected features also dif-fered within the various modeling techniques. For the full list of selected features for each technique and for each bootstrap sample, we refer to Additional files 3, 4, 5 and 6. The RF model showed the highest mean vali-dated AUC value (0.975) followed by the LASSO model (0.925). The mean validated AUC values of the CART and the SVM models were 0.873 and 0.859 respectively (Table 4). The RF model showed a relatively low statis-tical optimism (0.005). Modeling with CART, SVM and LASSO resulted in prediction models with higher opti-mism (decrease in performance 0.064, 0.066 and 0.056 respectively, Table 4).
Discussion
Using a feature selection and validation strategy based on bootstrap procedures, we found that RF and LASSO modeling resulted in prediction models with high per-formance. The statistical optimism of the RF model was relatively low (0.005). By contrast, modeling with CART, SVM and LASSO resulted in prediction models which had a good validated performance, but with higher opti-mism in the apparent performance estimates (0.064, 0.066 and 0.056 respectively).
We applied two commonly used techniques as ref-erences: variable selection from random forests using backward variable elimination (VARSEL RF) and sup-port vector machines using recursive feature elimination (SVM RFE). We applied these techniques to the same database and validated the resulting models by means of bootstrap re-sampling. These analyses showed that VAR-SEL RF had a high validated performance (AUC 0.966), whereas modeling with SVM RFE resulted in a validated performance of 0.915 and an optimism of 0.076.
[image:4.595.57.292.225.709.2]We used the bootstrap procedure as described by Efron [16]. The original data set comprised 222 Legionella strains. Bootstrapping from that data set leads to 222 Legionella strains again in each bootstrap sample because it is based on simple re-sampling with replacement. We note than the 0.632+ variant of the standard bootstrap validation procedure uses only cases not used at model development. Empirical evaluations for binary prediction showed no advantage of this bootstrapping variant [29]. Hence, we did not use this approach in the estimation of the optimism of the models and the stability of the fea-ture set.
Our results are in line with earlier findings, which showed that RF and LASSO are suitable modeling tech-niques for feature selection and that the resulting mod-els have a good predictive performance [10, 11]. Our results with SVM modeling are in line with the work of
Guyon et al. who suggested SVM RFE for feature selec-tion [11]. However, the features selected with SVM and bootstrapping differed from the features selected with the SVM RFE approach. The validated predictive perfor-mance of our strategy with SVM modeling was inferior to the validated predictive performance with the SVM RFE approach (mean validated AUC 0.859 and 0.915 respectively).
We found that feature selection by means of VARSEL RF resulted in models with a high validated performance. This is in line with the findings of earlier studies that used a simpler validation procedure [27]. Likewise, RF mod-eling resulted in models with a very high performance (mean validated AUC 0.975). Feature selection with either of the two RF approaches resulted in four match-ing features (LePn.007B8, LePn.004E8, LePn.032E12 and LePn.035C6).
Table 1 Top 5 features VARSEL RF and SVM RFE and frequency of selection in 200 bootstrap resamples Technique Top 5 features and frequencies []
VARSELRF LePn.007B8 [196] LePn.032E12 [93] LePn.004E8 [71] LePn.015B2 [40] LePn.035C6 [40] SVMRFE LePn.007B8 [88] LePn.016E4 [80] LePn.033H2 [77] LePn.005H6 [60] LePn.033D7 [54]
Table 2 Mean AUC and mean optimism VARSEL RF and SVM RFE
Technique Apparent AUC Bootstrap AUC Validated AUC Optimism
Mean 95 % CI Mean 95 % CI Mean 95 % CI
VARSELRF 0.904 0.966 [0.963; 0.969] 0.966 [0.963; 0.969] 0.000 [−0.004; 0.004]
SVMRFE 0.964 0.991 [0.990; 0.992] 0.915 [0.911; 0.919] 0.076 [0.072; 0.080]
Table 3 Top 5 features CART, RF, SVM and LASSO and frequency of selection in 200 bootstrap resamples Technique Top 5 features and frequencies []
CART LePn.007B8 [200] LePn.026A7 [93] LePn.027A12 [76] LePn.028A11 [71] LePn.016E4 [66] RF LePn.007B8 [200] LePn.032E12 [168] LePn.004E8 [151] LePn.035C6 [141] LePn.016E4 [100] SVM LePn.007B8 [144] LePn.035G3 [111] LePn.009C5 [105] LePn.012C5 [97] LePn.024C3 [89] LASSO LePn.007B8 [187] LePn.033H2 [146] LePn.016E4 [131] LePn.010B12 [83] LePn.011B3 [77]
Table 4 Mean AUC and mean optimism CART, RF, SVM and LASSO
Technique Apparent AUC Bootstrap AUC Validated AUC Optimism
Mean 95 % CI Mean 95 % CI Mean 95 % CI
CART 0.929 0.937 [0.933; 0.942] 0.873 [0.868; 0.878] 0.064 [0.060; 0.068]
RF 0.938 0.980 [0.978; 0.981] 0.975 [0.973; 0.976] 0.005 [0.003; 0.008]
SVM 0.887 0.924 [0.918; 0.930] 0.859 [0.852; 0.866] 0.066 [0.061; 0.071]
[image:5.595.58.536.105.151.2] [image:5.595.60.540.199.261.2] [image:5.595.57.539.309.377.2] [image:5.595.56.541.419.504.2]Feature selection with LASSO modeling resulted in a top 3 that was identical to the top 3 based on feature selection with SVM RFE. The relevance of this match is reinforced by the fact that feature selection with both these techniques resulted in models with a fairly high per-formance (validated AUC 0.915 and 0.925 respectively).
One of the limitations of our study is that we used one single database with features of a specific bacterium to compare the performance of the various modeling tech-niques. Future research should apply strong validation methods, such as our double bootstrap method, when analyzing comparable databases, such as databases com-prising Legionella strains from other countries. An even stronger validation would be achieved by testing the mod-els on new, independent data. Another limitation is that we restricted our research to four modeling techniques (CART, RF, SVM and LASSO). Various other techniques might also be suitable for feature selection and prediction in a domain with many variables and few subjects.
Conclusions
In the domain of Legionella pneumophila, which com-prises many potential features for classifying of infections as clinical or environmental, the RF and LASSO tech-niques provide good prediction models. The identifica-tion of potentially biologically relevant features is highly dependent on the technique used, and should hence be interpreted with caution.
Abbreviations
DNA: deoxyribonucleic acid; LASSO: least absolute shrinkage and selection operator; SVM RFE: support vector machines recursive feature elimination; VARSEL RF: variable selection random forest; CART: classification and regres-sion trees; RF: random forests; SVM: support vector machines.
Authors’ contributions
TVDP conceived of the study, performed the simulations and analyses and wrote the manuscript. EWS participated in the design of the study and provided input into the interpretation of the results and writing of the manu-script. Both authors read and approved the final manumanu-script.
Author details
1 Department of Science, Medical Center Alkmaar/Inholland University,
Alk-maar, The Netherlands. 2 Department of Public Health, Erasmus MC–University
Medical Center Rotterdam, Rotterdam, The Netherlands.
Additional files
Additional file 1. Feature set VARSEL RF. Additional file 2. Feature set SVM RFE. Additional file 3. Feature set CART. Additional file 4. Feature set RF. Additional file 5. Feature set SVM. Additional file 6. Feature set LASSO.
Acknowledgements
The authors thank Michel Ossendrijver, Frank Schuren (Department of Micro-biology, The Netherlands Organisation of Applied Scientific Research TNO, Zeist, The Netherlands), Jeroen den Boer and Sjoerd Euser (Regional Public Health Laboratory Kennemerland, Haarlem, The Netherlands) and Nico Nagel-kerke (Erasmus Medical Center, Rotterdam, The Netherlands) for methodologi-cal and statistimethodologi-cal advice. The authors thank Lisette van Hulst (Medimethodologi-cal Center Alkmaar, Alkmaar, The Netherlands) for editorial support.
Competing interests
The authors declare that they have no competing interests. Financial support
The study was not supported financially in any way.
Received: 11 September 2015 Accepted: 21 February 2016
References
1. Fraser DW, Tsai TR, Orenstein W, Parkin WE, Beecham HJ, Sharrar RG, Harris J, Mallison GF, Martin SM, McDade JE, Shepard CC, Brachman PS. Legion-naires’ disease: description of an epidemic of pneumonia. N Engl J Med. 1977;297:1189–97.
2. Fry NK, Alexiou-Daniel S, Bangsborg JM, Bernander S. Castellani Pastoris M, Etienne J, Forsblom B, Gaia V, Helbig JH, Lindsay D, Christian Luck P, Pelaz C, Uldum SA, Harrison TG: a multicenter evaluation of genotypic methods for the epidemiologic typing of Legionella pneumophila serogroup 1: results of a pan-European study. Clin Microbiol Infect. 1999;5:462–77.
3. Chiarini A, Bonura C, Ferraro D, Barbaro R, Calà C, Distefano S, Casuc-cio N, Belfiore S, Giammanco A. Genotyping of Legionella pneumophila serogroup 1 strains isolated in Northern Sicily. Italy. New Microbiol. 2008;31:217–28.
4. Doleans A, Aurell H, Reyrolle M, Lina G, Freney J, Vandenesch F, Etienne J, Jarraud S. Clinical and Environmental Distributions of Legionella strains in France are different. J Clin Microbiol. 2004;42:458–60.
5. Den Boer JW, Bruin JP, Verhoef LPB, Van der Zwaluw K, Jansen R, Yzerman EPF. Genotypic comparison of clinical Legionella isolates and patient-related environmental isolates in The Netherlands, 2002–2006. Clin Micro-biol Infect. 2008;14:459–66.
6. Harrison TG, Afshar B, Doshi N, Fry NK, Lee JV. Distribution of Legionella pneumophila serogroups, monoclonal antibody subgroups and DNA sequence types in recent clinical and environmental isolates from England and Wales (2000-2008). Eur J Clin Microbiol Infect Dis. 2009;28:781–91.
7. McCarthy MI, Abecasis GR, Cardon LR, Goldstein DB, Little J, Ioannidis JP, Hirschhorn JN. Genome-wide association studies for complex traits: consensus, uncertainty and challenges. Nat RevGenet. 2008;9:356–69. 8. Saeys Y, Inza I. Larrañaga P: A review of feature selection techniques in
bioinformatics. Bioinformatics. 2007;23(19):2507–17.
9. Guyon I, Elisseeff A. An introduction to variable and feature selection. J Mach Learn Res. 2003;3:1157–82.
10. Wang HY, Zheng H, Azuaje F. Evaluation of computational classification methods for discriminating human heart failure etiology based on gene expression data. In: Computers in Cardiology, 2006. IEEE; 2006. p. 277–80. 11. Guyon I, Weston J, Barnhill S, Vapnik V. Gene selection for cancer
classifica-tion using support vector machines. Mach Learn. 2002;46:389–422. 12. Diaz-Uriarte R. GeneSrF and varSelRF: a web-based tool and R package for
gene selection and classification using random forest. BMC Bioinformat-ics. 2007;8:328.
13. Haury A-C, Gestraud P, Vert J-P. The influence of feature selection meth-ods on accuracy, stability and interpretability of molecular signatures. PLoS ONE. 2011;6:e28210.
14. Diaz-Diaz N, Aguilar-Ruiz JS, Nepomuceno JA, Garcia J. Feature selection based on bootstrapping. In Comput Intell Methods Appl 2005 ICSC Congr. 2005. 15. Duangsoithong R, Windeatt T. Bootstrap feature selection for ensemble
• We accept pre-submission inquiries
• Our selector tool helps you to find the most relevant journal • We provide round the clock customer support
• Convenient online submission • Thorough peer review
• Inclusion in PubMed and all major indexing services • Maximum visibility for your research
Submit your manuscript at www.biomedcentral.com/submit
Submit your next manuscript to BioMed Central
and we will help you at every step:
16. Efron B, Tibshirani R. [Bootstrap methods for standard errors, confidence intervals, and other measures of statistical accuracy]: rejoinder. Stat Sci. 1986;1(1):77–77.
17. Hinkley DV. Bootstrap methods. J R Stat Soc Ser B. 1988;50:321–37. 18. John G. Kohavi R. Pfleger K: Irrelevant features and the subset selection
problem. icml; 1994. p. 121–9.
19. Kohavi R. A study of cross-validation and bootstrap for accuracy estima-tion and model selecestima-tion. In Int Jt Conf Artif Intell. 1995;14:1137–43. 20. Harrell FE. Model uncertainty, penalization, and parsimony. ISCB Present
UVa Web page. 1998.
21. Austin PC, Tu JV. Bootstrap methods for developing predictive models. Am Stat. 2004;58(2):131–7.
22. Roberts S, Martin MA. Bootstrap-after-bootstrap model averaging for reducing model uncertainty in model selection for air pollution mortality studies. Environ Health Perspect. 2010;118:131–6.
23. Breiman L, Friedman JH, Olshen RA, Stone CJ. Classification and regres-sion trees. Wadsworth; 1984.
24. Breiman LEO. Random forests. Mach Learn. 2001;45:5–32.
25. Cortes C, Vapnik V. Support-vector networks. Mach Learn. 1995;20:273–97. 26. Tibshirani R. Regression shrinkage and selection via the lasso: a
retrospec-tive. J R Stat Soc Ser B Stat Methodol. 2011;73:273–82.
27. Euser SM, Nagelkerke NJ, Schuren F, Jansen R, Den Boer JW. Genome analysis of Legionella pneumophila strains using a mixed-genome micro-array. PLoS One. 2012;7(10):e47437.
28. R Development Core Team R: R: A language and environment for statisti-cal computing. R Found Stat Comput 2011:409.