This is a repository copy of
Improved shear wave-front reconstruction method by aligning
imaging beam angles with shear-wave polarization: Applied for shear compounding
application
.
White Rose Research Online URL for this paper:
http://eprints.whiterose.ac.uk/110356/
Version: Accepted Version
Proceedings Paper:
Hyder, S, Harput, S, Alomari, Z et al. (3 more authors) (2016) Improved shear wave-front
reconstruction method by aligning imaging beam angles with shear-wave polarization:
Applied for shear compounding application. In: Ultrasonics Symposium (IUS), 2016 IEEE
International. 2016 IEEE International Ultrasonics Symposium (IUS), 18-21 Sep 2016,
Tours, France. IEEE . ISBN 978-1-4673-9897-8
https://doi.org/10.1109/ULTSYM.2016.7728536
© 2016 IEEE. Personal use of this material is permitted. Permission from IEEE must be
obtained for all other users, including reprinting/ republishing this material for advertising or
promotional purposes, creating new collective works for resale or redistribution to servers
or lists, or reuse of any copyrighted components of this work in other works.
[email protected] https://eprints.whiterose.ac.uk/
Reuse
Unless indicated otherwise, fulltext items are protected by copyright with all rights reserved. The copyright exception in section 29 of the Copyright, Designs and Patents Act 1988 allows the making of a single copy solely for the purpose of non-commercial research or private study within the limits of fair dealing. The publisher or other rights-holder may allow further reproduction and re-use of this version - refer to the White Rose Research Online record for this item. Where records identify the publisher as the copyright holder, users can verify any specific terms of use on the publisher’s website.
Takedown
If you consider content in White Rose Research Online to be in breach of UK law, please notify us by
Improved Shear Wave-front Reconstruction Method
by Aligning Imaging Beam Angles with Shear-wave
Polarization: Applied for Shear Compounding
Application
Safeer Hyder, Sevan Harput, Zainab Alomari, David M. J. Cowell, James McLaughlan and Steven Freear
Ultrasound Group, School of Electronic and Electrical Engineering, University of Leeds, UK.Email: [email protected]
Abstract—In shear compounding, shear waves are generated
at various angles and individual elasticity maps are averaged to reduce noise and improve accuracy. The steered shear waves tilt the tissue motion direction therefore conventional plane wave tracking is not capable of capturing true shear wave amplitude and direction. The proposed method aligns the tracking beams with the shear wave angles, enables beam-axis in the direction of tissue motion to estimate true shear wave motion vector. In this experimental work, shear waves are produced at five different angles and motion is captured using proposed and conventional method. All the experiments are conducted using inclusion-based elasticity phantom. In the results, the displacement maps show that proposed method accurately captured the steered beam wave-fronts while conventional method produced push-beam direction artefacts. In the final compounded elasticity maps, the proposed method slightly improved background-to-inclusion elasticity ratio, CNR by 2 dB, and produced inclusion boundary shape sharper than the conventional tracking.
I. INTRODUCTION
Elastic properties of the soft tissues have been used as biomarker for diagnosis and staging various diseases such as liver fibrosis staging [1], [2], breast lesion [3], and thy-roid nodule differential diagnosis [4]. The ultrasound shear wave elastography is able to produce 2-D elasticity maps of soft tissues within few milli-seconds, which is based on generation and calculation of shear wave propagation speed in the medium. Assuming the tissue is linear, incompressible, isotropic, and purely elastic, shear wave speed (cs) is related with Young’s modulus (µ) using following expression, where
ρis the mass density of the medium [5]
µ=ρc2s (1)
Two commercially available shear wave elastography tech-niques are supersonic shear-wave imaging (SSI) [5] and comb-push ultrasound shear-wave elastography (CUSE) [6]. To enhance the stiffness estimation accuracy, the spatial shear compounding technique was proposed for both SSI and CUSE [5], [7]. In B-mode imaging, spatial compounding techniques are widely used to improve B-mode image quality and speckle tracking [8], [9]. In the shear compounding, similar phe-nomenon is used and shear wave fields are produced from various directions and individual elasticity maps are averaged
to minimize random noise and to improve inclusion geom-etry reconstruction [5], [7]. In SSI, shear compounding was achieved using supersonic phenomenon, and tilted shear waves were induced at different angles using different Mach numbers [5]. While, Song et al. exploited various sub-apertures of the curvilinear array to produce differently angled shear waves [7]. When zero angle shear waves are generated, waves propagate laterally while corresponding motion vector is orthogonal to the propagation direction (axial direction), and eventually aligned with the imaging beam-axis. The challenge arises when steered shear waves are generated and it changes the direction of motion vector as well, creating both axial and lat-eral components of the motion. To estimate the angled motion vector, there were various methods proposed in the research for both blood-flow and elastography applications. The strain elastography also share the similar challenge [10], and to overcome this limitation, U. Techavipoo, et al. presented a method to measure both axial and lateral tissue motion by curve fitting angular displacements from multi-angle insoni-fications [6]. Another method proposed by the Tanter, et al. used two differently angled insonifications from separate sub-apertures of the array, and estimated 2-D displacement tissue motion [9].
method in terms of background-to-inclusion ratio (BIR), and CNR (contrast-noise-ratio).
II. MATERIALS ANDMETHODS
Ultrasound array research platform II (UARPII), developed by Ultrasound Group, University of Leeds was used for the RF data acquisition [11], [12]. The 128 element L3-8/40EP (Prosonic Co., Ltd, Korea) medical probe with centre frequency of 4.79 MHz was used for shear wave generation and tracking. Five push-beam angles were tested for both aligned and conventional tracking schemes and are listed as (-15◦, -10◦, 0◦, +10◦, +15◦). For shear wave generation, three focused (focal depth 30 mm) push-beams, 16 elements each were used, with tone burst of 570 µs. After shear wave generation, for aligned tracking scheme, the corresponding imaging compounding angles used were (-17◦, -15◦, -13◦), (-12◦, -10◦, -8◦) , (-2◦, 0◦ +2◦) , (+12◦, +10◦, +8◦) , and (+17◦, +15◦, +13◦), for (-15◦, -10◦, 0◦ , +10◦ , +15◦) push-beam angles, respectively. In conventional tracking scheme, compounding angles were fixed to (-2◦, 0◦, +2◦) for all the push-beam angles.
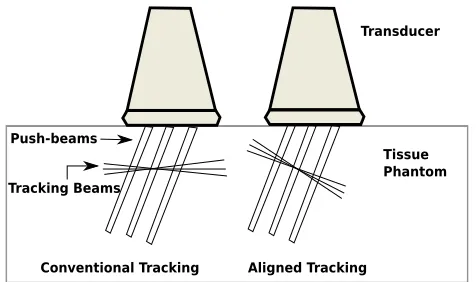
Conventional Tracking Aligned Tracking Push-beams
Tracking Beams
[image:3.612.341.535.55.186.2]Tissue Phantom Transducer
Fig. 1. The schematic diagram of the aligned and conventional shear wave tracking. In aligned tracking beams, three imaging beams are placed around push-beam angle while in conventional tracking imaging beams are placed around zero degree.
The RF data was beamformed using classical delay-and-sum beamformer [8], [14]. After shear wave generation, motion data was acquired at frame-rate of 10 kHz, with effective frame-rate of 3.33 kHz after averaging three multiple-angle B-mode images. For shear wave motion estimation, 1-D nor-malized cross-correlation was performed, with kernel length of 2 mm (∼ 6λ) and step of 0.304 mm (∼ λ). To separate complex shear wave field into left and right travelling shear waves, directional filtering was performed [6]. For shear wave speed estimation, a 2-D shear wave speed estimation algorithm was applied with kernel size of 2.4 mm and patch size of 1.2 mm in the lateral and axial direction, as proposed by the [7]. The duration of shear wave generation and data acquisition was 15 ms. For final elasticity maps, no smoothing filter was used.
For elasticity imaging purpose, a multi-purpose, multi-tissue ultrasound phantom (CIRS., Norfolk, VA) was used, with
[image:3.612.56.294.315.456.2]Imaging Region
Fig. 2. The schematic diagram of the CIRS phantom and imaging region. The imaging region consist of 40 mm in the axial and 50 mm in the lateral direction.
acoustic speed of 1540 m/s, attenuation of 0.5 dB/cm/MHz and density of 1050 kg/m3
. The 6 mm cylindrical inclusion is centred at 15 mm from surface of the transducer. The Young’s modulus of the inclusion is 10±3 kPa, and background has a Young’s modulus of 22±5 kPa, while stiffness of the back-ground is 2.2 times greater than the inclusion. The acoustic and mechanical parameters of the phantom are tested and provided by the manufacturer. For performance comparison, the background-to-inclusion ratio and contrast-to-noise ratio in dB were calculated for Young’s modulus values, and a 5 x 5 mm rectangular region-of-interest (ROI) inside the inclusion, and two ROI surrounding the inclusion were used for these calculations. The following expression was used for CNR, where CI and CB are mean Young’s modulus values in the inclusion and background, respectively; whileσB is standard deviation of the Young’s modulus of the background [6]
CNR= 20 log10
|CI−CB|
σB
(2)
III. RESULTS ANDDISCUSSION
This study shows a difference in the shear wave motion tracking accuracy, when tracking beams are aligned with the push-beam angles, in contrast to conventional tracking schemes. When tracking beams are on the same axis as tissue motion, true angle of the shear wave-front is reconstructed and displacement SNR is improved, and final compounded elas-ticity maps improved the inclusion boundary reconstruction, CNR and elasticity ratio between inclusion and background.
−20 0 20 10 20 30 40 0 0.5 1 1.5 2 2.5 3 3.5 4 4.5
−20 0 20
10
20
30
40
−20 0 20
10
20
30
40
−20 0 20
10 20 30 40 10 20 30 40
−20 0 20
−20 0 20
10 20 30 40 10 20 30 40
−20 0 20
10
20
30
40
−20 0 20
10
20
30
40
−20 0 20
Lateral (mm) Lateral (mm) Lateral (mm) Lateral (mm)
A xi a l (m m ) A xi a l (m m ) D is p la c e m e n t (u m )
a) Neg15 - Conv b) Neg10 - Conv c) Pos10 - Conv d) Pos15 - Conv e) Zero - Conv
[image:4.612.44.566.56.246.2]f) Neg15 - Aligned g) Neg10 - Aligned h) Pos10 - Aligned i) Pos15 - Aligned
Fig. 3. The displacement maps for aligned and conventional tracking beams used for listed (-15◦, -10◦, 0◦, +10◦, +15◦) push-beam angles at time instant of 0.1 ms after ultrasound switches to imaging mode. The labels on each displacement map indicate the push-beam and associated tracking angle. All conventional tracking beams are fixed to (-2◦, 0◦, +2◦), while aligned tracking beams are adjusted to the push-beam angle. The colorbar scale is in the units ofµm. The false push-beam angle direction artefact are produced by the conventional tracked maps pointed by arrows (map a and d) while in aligned tracked maps, the push-beam wave-front angle are truly reconstructed (map f and i). A x ia l (m m )
−20 0 20
10
20
30
40
−20 0 20
10
20
30
40
−20 0 20
10 20 30 40 A x ia l (m m )
−20 0 20
10
20
30
40
−20 0 20
10
20
30
40
−20 0 20
10 20 30 40 A x ia l (m m )
−20 0 20
10
20
30
40
−20 0 20
10 20 30 40 Lateral (mm) A x ia l (m m )
−20 0 20
10
20
30
40
Lateral (mm)
−20 0 20
10
20
30
40
−20 0 20
10
20
30
40
Lateral (mm)
−20 0 20
10 20 30 40 Y o u n g s m o d u lu s (k P a ) 5 10 15 20 25 30 35 40 45 50
a) Neg15 - Conv b) Neg10 - Conv c) Zero
d) Pos10 - Conv e) Pos15 - Conv f) Compound - Conv
g) Neg15 - Aligned h) Neg10 - Aligned i) Zero
j) Pos10 - Aligned k) Pos15 - Aligned l) Compound - Aligned
[image:4.612.140.470.329.679.2]TABLE I
YOUNG’S MODULUSBIRANDCNRMEASUREMENTS OF BACKGROUND AND INCLUSION FROMROI
Conventional Aligned
Push-beam Angle BIR CNR (dB) BIR CNR (dB)
- 15° 1.66 25.87 1.81 22.98
- 10° 1.54 25.18 1.62 25.15
0° 1.50 22.97 1.50 22.97
+ 10° 1.44 23.77 1.40 24.92
+ 15° 1.69 28.54 1.63 23.50
Compounded 1.56 29.05 1.59 31.00
In the zero shear wave angle, there are no artefacts as shear wave and tracking angles are aligned (Fig. 3e). The Young’s modulus maps are produced for all the experiments and pre-sented in the Fig. 4. In elasticity measurements, -15◦and -10◦ aligned tracked shear wave maps (Figs. 4g, 4h) have produced sharper inclusion geometry contrast to conventional tracked maps (Figs. 4a, 4b), while in +15◦ and +10◦ maps (Figs. 4d, 4e, 4j, 4k), no difference was observed and results are comparable. A zero push-angle maps are same for both aligned and conventional tracking (Fig. 4c). In the final compounded elasticity maps, aligned tracking (Fig. 4l) have preserved inclu-sion geometry shape better than the conventional tracking (Fig. 4f). In the final compounded maps, the CNR is 2 dB higher for proposed method than the conventional method, and BIR is also slightly improved in the aligned tracked maps (Table I). Performance metrics indicate that, improvement in the shear wave motion tracking is slightly translated to improve the contrast and elasticity estimation accuracy. The improvement could be further achieved if higher shear wave angles were used but using linear arrays, higher steering angles result in widened beamwidth, reduced sensitivity, and grating lobes artefacts, therefore higher steering angles may not improve the results [15]. Furthermore, using proposed technique, elasticity values are achieved in the wider field-of-view (FOV) that is 45 mm as compared to the conventional tracking that is 39 mm. The widened FOV provides elasticity information over the larger area, and it is an additional advantage of the proposed scheme. Ideally, shear compounding requires waves from all directions, but clinically it is not possible. The shear compounding angles can be further increased if mechanical sources are used for shear wave generation as used by Zhao et al. [16].
IV. CONCLUSIONS
In this experimental work, the effect of spatially aligning tracking beams with shear wave polarization is investigated and compared with the conventional method. The results conclude that, angled displacement values are estimated with correct push-beam wave-front while conventional tracking pro-duced artefacts. In the final elasticity maps, aligned tracking improved inclusion contrast and geometry. The results suggest that, spatially aligning shear wave tracking and generation beams improve the motion tracking.
V. ACKNOWLEDGEMENT
The author Safeer Hyder, acknowledges contribution of Sukkur IBA and Higher education commission, Pakistan for supporting his PhD.
REFERENCES
[1] M. Ziol, A. Handra-Luca, A. Kettaneh, C. Christidis, F. Mal, F. Kazemi, V. de Lédinghen, P. Marcellin, D. Dhumeaux, J.-C. Trinchet et al., “Noninvasive assessment of liver fibrosis by measurement of stiffness in patients with chronic hepatitis c,”Hepatology, vol. 41, no. 1, pp. 48–54, 2005.
[2] G. Ferraioli, C. Tinelli, B. Dal Bello, M. Zicchetti, G. Filice, and C. Filice, “Accuracy of real-time shear wave elastography for assessing liver fibrosis in chronic hepatitis c: A pilot study,”Hepatology, vol. 56, no. 6, pp. 2125–2133, 2012.
[3] W. A. Berg, D. O. Cosgrove, C. J. Doré, F. K. Schäfer, W. E. Svensson, R. J. Hooley, R. Ohlinger, E. B. Mendelson, C. Balu-Maestro, M. Locatelliet al., “Shear-wave elastography improves the specificity of breast us: the be1 multinational study of 939 masses,”Radiology, vol. 262, no. 2, pp. 435–449, 2012.
[4] K. S. Bhatia, C. S. Tong, C. C. Cho, E. H. Yuen, Y. Y. Lee, and A. T. Ahuja, “Shear wave elastography of thyroid nodules in routine clinical practice: preliminary observations and utility for detecting malignancy,”
European radiology, vol. 22, no. 11, pp. 2397–2406, 2012.
[5] J. Bercoff, M. Tanter, and M. Fink, “Supersonic shear imaging: a new technique for soft tissue elasticity mapping,” IEEE transactions on ultrasonics, ferroelectrics, and frequency control, vol. 51, no. 4, pp. 396–409, 2004.
[6] P. Song, H. Zhao, A. Manduca, M. W. Urban, J. F. Greenleaf, and S. Chen, “Comb-push ultrasound shear elastography (cuse): a novel method for two-dimensional shear elasticity imaging of soft tissues,”
IEEE transactions on medical imaging, vol. 31, no. 9, pp. 1821–1832, 2012.
[7] P. Song, A. Manduca, H. Zhao, M. W. Urban, J. F. Greenleaf, and S. Chen, “Fast shear compounding using robust 2-d shear wave speed calculation and multi-directional filtering,”Ultrasound in medicine & biology, vol. 40, no. 6, pp. 1343–1355, 2014.
[8] G. Montaldo, M. Tanter, J. Bercoff, N. Benech, and M. Fink, “Coherent plane-wave compounding for very high frame rate ultrasonography and transient elastography,”IEEE transactions on ultrasonics, ferroelectrics, and frequency control, vol. 56, no. 3, pp. 489–506, 2009.
[9] M. Tanter, J. Bercoff, L. Sandrin, and M. Fink, “Ultrafast compound imaging for 2-d motion vector estimation: application to transient elastography,” IEEE transactions on ultrasonics, ferroelectrics, and frequency control, vol. 49, no. 10, pp. 1363–1374, 2002.
[10] S. Hyder, S. Harput, Z. Alomari, and S. Freear, “Two-way quality as-sessment approach for tumour detection using free-hand strain imaging,” in2014 IEEE International Ultrasonics Symposium. IEEE, 2014, pp. 1853–1856.
[11] P. R. Smith, D. M. Cowell, B. Raiton, C. V. Ky, and S. Freear, “Ultrasound array transmitter architecture with high timing resolution using embedded phase-locked loops,”IEEE transactions on ultrasonics, ferroelectrics, and frequency control, vol. 59, no. 1, pp. 40–49, 2012. [12] P. R. Smith, D. M. Cowell, and S. Freear, “Width-modulated
square-wave pulses for ultrasound applications,”IEEE transactions on ultrason-ics, ferroelectrultrason-ics, and frequency control, vol. 60, no. 11, pp. 2244–2256, 2013.
[13] Z. Alomari, S. Harput, S. Hyder, and S. Freear, “Selecting the number and values of the cpwi steering angles and the effect of that on imaging quality,” in 2014 IEEE International Ultrasonics Symposium. IEEE, 2014, pp. 1191–1194.
[14] ——, “The effect of the transducer parameters on spatial resolution in plane-wave imaging,” inUltrasonics Symposium (IUS), 2015 IEEE International. IEEE, 2015, pp. 1–4.
[15] P. R. Hoskins, K. Martin, and A. Thrush,Diagnostic ultrasound: physics and equipment. Cambridge University Press, 2010.