Int. J. Electrochem. Sci., 7 (2012) 6106 - 6117
International Journal of
ELECTROCHEMICAL
SCIENCE
www.electrochemsci.org
Evaluation of ZrO
2Composite Membrane Operating at High
Temperature (100 °C) in Direct Methanol Fuel Cells.
C. Guzmán1,4
, A. Alvarez2, Luis A. Godínez3, J. Ledesma–García1,*, L. G. Arriaga3,*
1 División de Investigación y Posgrado, Facultad de Ingeniería, Universidad Autónoma de Querétaro,
C.P. 76010, Querétaro, México.
2 División Académica, Universidad Tecnológica de Corregidora, C.P. 76900 Querétaro, México. 3 Centro de Investigación y Desarrollo Tecnológico en Electroquímica S.C., C.P. 76703, Querétaro,
México.
4
UACQ – UAZ, CU Siglo XXI Edificio b, Km 6 Carr. Zac – Gdl, La Escondida Zacatecas, Zac, C.P. 96160, México.
*
E-mail: [email protected]; [email protected]
Received: 23 April 2012 / Accepted: 5 June 2012 / Published: 1 July 2012
This study focuses on the effect of two different membranes, a Zirconium Dioxide composite membrane versus a commercial membrane (Nafion – 112) on the performance of a methanol fuel cell at high temperatures (100 ºC) . The inorganic material was synthesized using the sol gel method. Then, the inorganic filler was mixed with a Nafion (5%) solution and dried in order to obtain the composite membrane. This composite material was characterized by SEM and FTIR, thus confirming the inclusion of the inorganic oxide into the Nafion matrix. Ion exchange capacity and water uptake values were obtained from the membranes observing that the composite membrane should show a similar behavior than that of the Nafion membrane. From the fuel cell tests, it was observed that the composite zirconium membrane has better performance than that obtained from the commercial membrane. This difference was related to the influence of the inorganic modifier in partial suppression of the methanol crossover effect.
Keywords: High temperature methanol fuel cells, composite membrane
1. INTRODUCTION
the most common membrane due to its high proton conductivity and its chemical and electrochemical stability. However, the use of this membrane leads to a significant decrease in the fuel cell performance due to the methanol crossover effect [4-6]. Methanol crossover not only lowers the fuel availability, but also the reduction of active sites on the cathode that results in lower levels of performance [7]. In recent years significant research efforts have focused on the development of new membranes to reduce the methanol crossover [8-11] and to allow higher operating temperatures (> 100 °C) [12-15]. DMFC operation at elevated temperature improves the tolerance to CO contamination [16], enhancing the kinetics of both electrodes [13] and facilitating heat removal [17, 18].
One approach to improve the Nafion membrane properties in this direction consists on mixing liquid Nafion with inorganic compounds such as TiO2, ZrO2 and SiO2 [13, 16, 19]. The presence of the
inorganic fillers in the Nafion matrix enhances water retention at high temperatures [15] and reduces the methanol crossover effect [13]. The aim of the present work is to evaluate the influence of a composite membrane based on ZrO2 in a DMFC operating at high temperature (100 °C) and compare
the results to those obtained using a commercial Nafion 115 membrane.
2. EXPERIMENTAL
2.1 Synthesis of ZrO2
ZrO2 was prepared using the sol–gel technique utilizing zirconium (IV) propoxide, (70 wt %,
Aldrich) as a precursor and aqueous HNO3 with a 1:1 molar ratio as a catalyst. This colloidal solution
was kept at room temperature until solid formation [20-26]. The resulting solid was thermally treated using a tubular furnace (Barnstead Thermolyne) at 150°C for 2 hrs in order to remove the residual alcohol.
2.2 Preparation of the composite membrane
was also employed (15 minutes) and a treatment in a 1M H2SO4 solution at 80°C for 30 minutes was
employed [27-29].
2.3 Composite Membrane Characterization 2.3.1 Physicochemical methods
Fourier transform infrared (FT-IR) spectra were collected using a Bruker (Vector 33). While the spectral range of 400 to 4000 cm-1 was employed in the transmission mode. The morphology of the composite membrane on the other hand, was examined using a Scanning Electron Microscope (SEM) Jeol model JSM-5400 LV with a 15 keV voltage acceleration value.
2.3.2 Ionic exchange capacity (IEC)
The IEC of the membranes was determined through an acid-base titration with an automatic titrator (Metrohm, mod. 751 GPD Titrino). In these experiments, the membranes were first dried at 80°C for 2h in an oven under vacuum to determine the dried weight. Then, they were immersed in a 1 M NaCl solution to exchange the H+ ions of the SO3H group by Na+ cations and the resulting solution
was titrated using a 10-2 M NaOH solution to neutralize the exchanged H+. Using the equivalent point obtained from the plot of the pH value vs the added titrant volume and the dry weight of each sample, the IEC of the membrane can be calculated using the following relation:
[1]
where IEC is the ionic exchange capacity in SO3H meq g-1; V, is the added titrant volume at the
equivalent point in ml; M, is the molar concentration of the titrant, and mdry is the dry mass of the sample in g [30].
2.3.3 Water Uptake (Wup)
The water uptake (Wup, %) was determined from the difference between the wet and the dry mass of the membrane. While the dry mass was obtained from the vacuum oven dried samples (at 80°C for 2 h), the wet mass was determined from distilled H2O swelled samples (24 h) prepared at
room temperature. [27-29]. The corresponding equation for Wup determnation is:
[2]
Where:
On the other hand, Eq. (3)was used to determine the number of water molecules per sulfonated group (). In this equation, 18 is the molar mass of water and the IEC value employed corresponds to that obtained from [31].
[3]
2.4 Electrochemical characterization
2.4.1 Measurement of methanol permeability.
A two-compartment glass cell (3.4 mL) was used to investigate the methanol permeability of the membranes at 25 C. In this way, while compartment I was filled with an aqueous solution containing 1 M methanol and 0.5M H2SO4; compartment II was filled with the same amount of O.5M
H2SO4 solution than that in compartment I. The membrane was clamped between the two
compartments, and the two solutions were continuously stirred during the experiments. The methanol concentration in compartment II was monitored by chronoamperometry [32]. In this way, a constant potential 0.679V vs Ag/AgCl was applied for 240 s, using a BAS-Epsilon potentiostat (EC EPSILON). In these experiments, a Pt micro electrode served as working electrode (WE), and a Ag/AgCl and Pt wire were a reference and a counter electrode (CE), respectively. From the permeated methanol concentration value at any time it is possible to estimate the methanol permeability (P) using equation (4):
[4]
Where CII is the methanol concentration in compartment II, CI is the methanol concentration in
compartment I, A and L are the area and thickness of the membrane, D and K are the methanol diffusivity and the partition coefficient between the membrane and the adjacent solution, t is the permeation time, and VII is the volume of the solution in compartment II. The product DK is the
methanol permeability P.
2.5 Fuel cell performance tests
A cyclic current aging test was also performed. Each current aging cycle is composed by 3 current steps (high, medium and low current) that lasted 30 s (figure 1).
2000 1600 1200 800
CF2 ZrO2
Nafion - 115
a
.u
Wavenumber (cm-1) CF2
SO3
[image:5.596.124.476.136.440.2]-Zr-O
Figure 1. Fourier transforms infrared (FT-IR) spectra of ZrO2 and Nafion - 115 membranes.
The corresponding responses were registered by recording the voltage as a function of the cycle number. The degradation test was carried at TCell = 100 C with a back pressure of 30 psi in the anode
and the cathode.
3. RESULTS
3.1 Physicochemical properties of composite membranes
Fourier Transform Infrared spectra at wave numbers 4000-400 cm-1 for the composite membranes were recorded, analyzed and compared to those obtained for the Nafion 115 membrane. The IR spectrum of the reference and composite membrane are presented in Figure 1. The Nafion - 115 membrane presented two signals at 1199 cm-1 and 1146 cm-1 that are related to the CF2 stretching
vibration of the PTFE backbone. The peaks observed at 1055 and 967 cm-1 are attributed to the stretching vibration moieties of SO3- and C-O-C, respectively [33]. The zirconium oxide bands in the
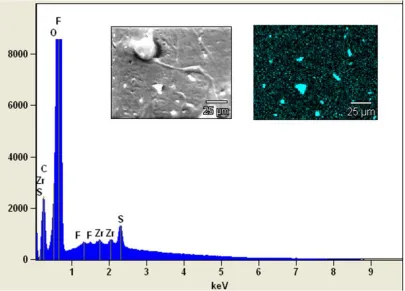
The presence ZrO2 in the composite membrane was also confirmed by SEM/EDX data, shown
in Fig. 2. EDX spectra for each membrane indicate elemental peaks for elements carbon, oxygen, fluorine and sulphur. A signal for Zr is observed for the ZrO2 composite membrane. The EDX
[image:6.596.98.503.166.457.2]mapping images of the composite membrane suggests a homogeneous distribution of Zr.
Figure 2. SEM images of composite membrane.
Table 1. Properties Physicochemical of composite membranes
Composite Membrane
WU (%) IEC
(meq/g)
Water molecules per sulfonated group ( )
Thickness (µm)
Nafion - 115 25.7 1.0093 14.1 127
ZrO2 15 1.076 7.7 59
Figure 3 also shows that the composite membrane has lower methanol permeability (P) than Nafion 115. The methanol permeability (P) of the ZrO2 membrane corresponds to 1.92X10⁻⁶ cm2s-1
which is lower than that of Nafion 115 (2.79X10⁻⁶ cm2s-1) [10] Methanol molecules are easily transferred together with solvated protons, and the number of hydrophilic of groups in Nafion 115 membranes exceeds that of the composite films. I do not understand this sentence!!. The composite membrane has lower methanol permeability (P), because the metal oxide (ZrO2) blocks the
ion-exchange groups (sulfonic groups) in the polymer (Nafion), creating a tortuous path for methanol [32, 35].
0 2000 4000 6000 8000 10000 12000 14000 16000
-5.0x10⁻⁵
-4.0x10⁻⁵
-3.0x10⁻⁵
-2.0x10⁻⁵
-1.0x10⁻⁵
0.0
1.0x10⁻⁵
2.0x10⁻⁵
4000 8000 12000
-4.0x10⁻⁶ 0.0 4.0x10⁻⁶
Nafion 115
ZrO2
P
(c
m
2s -1)
t (s)
Nafion 115
ZrO2
P
(cm
2 s -1 )
[image:7.596.113.480.218.488.2]t (s)
Figure 3. Methanol permeability rate curves of Nafion 115 and ZrO2 membranes (25 °C).
3.2 Fuel cell Performance
In agreement with the methanol permeation measurements and the expected effect in the methanol crossover behavior, the polarization curves of the composite membranes (see Figure 4), and reveal that the composite membrane shows a better performance than that of the Nafion – 115 at the two temperatures surveyed (80 and 100 C).
At 80 C the fuel cell built with the ZrO2 modified membrane achieved a maximum power
density of 0.067 W cm-2 which is roughly six times larger to that obtained for the Nafion – 115 fuel cell (0.013 W cm-2). At higher temperatures (100 C), the Nafion containing fuel cell performance felt down around 30 % (0.009 W cm-2) when compared to the power density obtained at 80C. Contrary to this trend, at this temperature operation conditions, the ZrO2 membrane improved the performance of
0.0 0.1 0.2 0.3 0.4 0.5 0.6
0.0 0.2 0.4 0.6 Nafion ZrO2
Current Density (A cm-2)
C e ll Vo lt a g e (V) ZrO2 Nafion a) 0.00 0.01 0.02 0.03 0.04 0.05 0.06 0.07 Po w e r D e n si ty (W cm -2 )
0.0 0.2 0.4 0.6 0.8
0.0 0.2 0.4 0.6
Current Density (A cm-2)
[image:8.596.154.459.88.570.2]C e ll Vo lt a g e (V) 0.00 0.01 0.02 0.03 0.04 0.05 0.06 0.07 0.08 b) Po w e r D e n si ty (W cm -2 ) ZrO2 ZrO2 Nafion Nafion
Figure 4. Polarization Curves of Nafion and ZrO2 membranes at a) 80 and b) 140 °C.
It is also interesting to note that at the two temperatures surveyed, the composite membrane shows a lower value of resistance and open circuit voltage (OCV) when compared to that of Nafion (Table 2). The low OCV and performance values observed for Nafion should be related to the methanol crossover effect.
Table 2. Parameters obtained from the composite membrane from the aging cycle.
Membrane Nafion ZrO2
Cycle R OCV WMax R OCV WMax
0 0.292 0.404 0.009 0.131 0.587 0.076 250 0.301 0.391 0.008 0.125 0.587 0.099 500 0.313 0.371 0.006 0.117 0.587 0.12 750 0.417 0.352 0.003 0.232 0.587 0.051 1000 0.431 0.394 0.002 0.128 0.586 0.062 1250 0.426 0.408 0.002 0.116 0.586 0.088 Cell Resistance (R) = Ω cm2
; Open Circuit Voltage (OCV) = V; Power Density (WMax) = Wcm-2
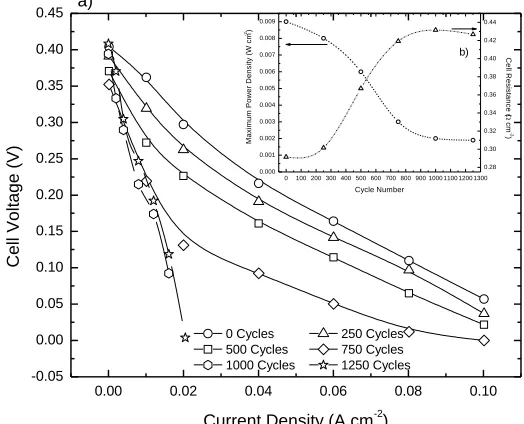
As expected, the internal cell resistance (figure 5 b) increases with the number of cycles due to the methanol permeation that takes place from the anode towards the cathode. For the ZrO2 composite
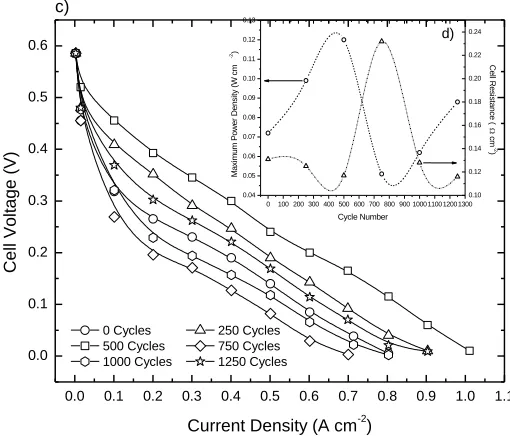
membrane on the other hand (Figure 5 c), the power density augments as the number of cycles increases, reaching a power density of 0.12 W cm-2 and then, after 500 cycles the power density falls to 0.051 W cm-2. Consistent with these results, the cell resistance (Figure 5 d) for the ZrO2 decreases until
500 cycles is carried out.
In Table 2, the parameters obtained from the aging cycle experiments are shown. The OCV for the Nafion membrane decreases as the number of cycles applied. This behavior is related to the methanol crossover from the anode to the cathode.
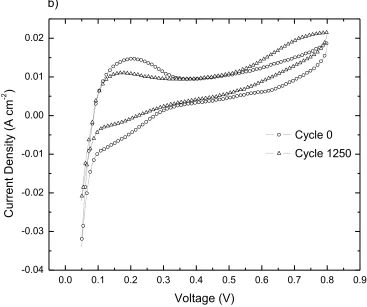
In order to determine the CO poisoning on the anode catalyst, a voltammetry analysis was performed to each membrane before and after the aging cycle. In figure 6 the corresponding cyclic voltammetry (CV) are shown. , As can be seen from the corresponding data, the electroactive area is decreased with aging cycles as compared to that observed from the CV at the beginning of the experiment.
0.00 0.02 0.04 0.06 0.08 0.10
-0.05 0.00 0.05 0.10 0.15 0.20 0.25 0.30 0.35 0.40 0.45
0 Cycles 250 Cycles
500 Cycles 750 Cycles
1000 Cycles 1250 Cycles
0 100 200 300 400 500 600 700 800 900 1000 1100 1200 1300
0.000 0.001 0.002 0.003 0.004 0.005 0.006 0.007 0.008 0.009 M a x im u m P o w e r D e n s it y ( W c m -2) Cycle Number 0.28 0.30 0.32 0.34 0.36 0.38 0.40 0.42 0.44 C e ll R e s is ta n c e ( c m -2 ) b) C e ll Vo lt a g e (V)
Current Density (A cm-2)
0.0 0.1 0.2 0.3 0.4 0.5 0.6 0.7 0.8 0.9 1.0 1.1
0.0 0.1 0.2 0.3 0.4 0.5 0.6
0 100 200 300 400 500 600 700 800 900 1000 1100 1200 1300 0.04 0.05 0.06 0.07 0.08 0.09 0.10 0.11 0.12 0.13 M a x im u m P o w e r D e n s it y ( W c m -2) Cycle Number 0.10 0.12 0.14 0.16 0.18 0.20 0.22 0.24 C e ll R e s is ta n c e ( c m -2 )
0 Cycles 250 Cycles
500 Cycles 750 Cycles
1000 Cycles 1250 Cycles
d) C e ll Vo lt a g e (V)
Current Density (A cm-2)
[image:10.596.165.420.90.310.2]c)
Figure 5. Polarization curves every 250 cycles at Tcell = 100 °C for a) Nafion and c) ZrO2.
The incorporation of the inorganic filler shows that as expected the tendency is the same but the decrease rate with the aging cycles is less severe than that observed for the Nafion membrane. These results can be explained in terms of the different methanol permeation properties of the two membranes under study.
0.0 0.1 0.2 0.3 0.4 0.5 0.6 0.7 0.8 0.9
0.0 0.1 0.2 0.3 0.4 0.5 0.6 0.7 0.8 0.9
-0.04 -0.03 -0.02 -0.01 0.00 0.01 0.02
Cycle 0
C
u
rre
n
t D
e
n
si
ty
(A
cm
-2 )
Voltage (V) b)
[image:11.596.113.480.76.383.2]Cycle 1250
Figure 6. Cyclic voltammetry at the anode for a) Nafion and c) ZrO2 membranes
4. CONCLUSIONS
This paper presents the characterization and evaluation of the methanol permeation properties of composite membranes prepared from a mixture of Nafion® 5% and 3% wt. of ZrO2 as filler. The
composite membrane based in the inorganic filler showed a significant decrement in the methanol permeation, when compared to the commercial Nafion® 115 membrane. Since methanol diffuses to the cathode and reacts with oxygen to produce carbon monoxide, which easily adsorbs on the Pt active sites, the number of active sites for oxygen reduction decreases. In this context, this phenomenon is suppressed by the inclusion of ZrO2 fillers because, more active sites for oxygen reduction are
protected by the limiting methanol permeation effect of the modifier [14]. In this way, the inorganic filler could be hindering the passage of methanol by blocking exchange groups which reduces the permeation of alcohol and improved the fuel cell performance.
ACKNOWLEDGMENTS
The authors thank the Mexican Council for Science and Technology CONACYT for financial support through SEP-CONACYT 2009-133310 and Fomix-Chihuahua 127461.
References
2. E. Kjeang, J. Goldak, M.R. Golriz, J. Gu, D. James, K. Kordesch, J. Power Sources, 153 (2006) 89-99.
3. J.-Y. Park, J.-H. Lee, S. Kang, J.-H. Sauk, I. Song, J. Power Sources, 178 (2008) 181-187. 4. X. Li, E.P.L. Roberts, S.M. Holmes, J. Power Sources, 154 (2006) 115-123.
5. V.B. Oliveira, C.M. Rangel, A.M.F.R. Pinto, Int. J. Hydrogen Energy, 34 (2009) 8245-8256. 6. V.S. Silva, J. Schirmer, R. Reissner, B. Ruffmann, H. Silva, A. Mendes, L.M. Madeira, S.P.
Nunes, J. Power Sources, 140 (2005) 41-49.
7. V.B. Oliveira, C.M. Rangel, A.M.F.R. Pinto, Int. J. Hydrogen Energy, 34 (2009) 6443 – 6451. 8. H. Ahmad, S.K. Kamarudin, U.A. Hasran, W.R.W. Daud, Int. J. Hydrogen Energy, 35 2160-2175. 9. A.-C. Dupuis, Progress in Materials Science, In Press, Corrected Proof.
10. A. Küver, K. Potje-Kamloth, Electrochim. Acta, 43 (1998) 2527-2535.
11. S.J. Peighambardoust, S. Rowshanzamir, M. Amjadi, Int. J. Hydrogen Energy, 35 9349-9384. 12. A.S. Arico, V. Baglio, A.D. Blasi, V. Antonucci, Electrochem. Commun., 5 (2003) 862-866. 13. A.S. Aricò, V. Baglio, A. Di Blasi, P. Creti, P.L. Antonucci, V. Antonucci, Solid State Ionics, 161
(2003) 251-265.
14. H. Hou, G. Sun, Z. Wu, W. Jin, Q. Xin, Int. J. Hydrogen Energy, 33 (2008) 3402-3409.
15. M.K. Mistry, N.R. Choudhury, N.K. Dutta, R. Knott, Z. Shi, S. Holdcroft, Chem. Mater., 20 (2008) 6857-6870.
16. K.T. Adjemian, S.J. Lee, S. Srinivasan, J. Benziger, A.B. Bocarsly, J. Electrochem. Soc., 149 (2002) A256-A261.
17. R.K.A.M. Mallant, J. Power Sources, 118 (2003) 424-429.
18. Y. Shao, G. Yin, Z. Wang, Y. Gao, J. Power Sources, 167 (2007) 235-242. 19. J. Pan, H. Zhang, W. Chen, M. Pan, Int. J. Hydrogen Energy, 35 2796-2801.
20. D.H. Aguilar, L.C. Torres-González, L.M. Torres-Martínez, T. López, P. Quintana, Ciencia UANL, 6 (2003) No. 1.
21. J. González-Hernández, J.F.P. Robles, J.R.M. F. Ruiz, Superficies y Vacío, 11 (2000) 1 - 16. 22. S. Melada, M. Signoretto, S.A. Ardizzone, C.L. Bianchi, Catalysis Letters, 75 (2001) 199-204. 23. A. Morales-Acevedo, G.F. Pérez-Sánchez, Superficies y Vacío, 16 (2003) 16-18.
24. R. Pérez-Hernández, J. Arenas-Alatorre, D. Mendoza-Anaya, A. Gómez-Cortés, G. Díaz, Revista Mexicana de Física 50 (2004) 80-84.
25. M.L. Rojas -Cervantes, R.M. Martin -Aranda, A.J. Lopez -Peinado, J.D.D. Lopez -Gonzalez, J. Materi. Sci., 29 (1994) 3743-3748.
26. V. Santos, M. Zeni, C.P. Bergmann, J.M. Hohemberger, Rev. Adv. Mater. Sci, 17 (2008) 62-70. 27. A. Saccà, A. Carbone, E. Passalacqua, A. D΄Epifanio, S. Licoccia, E. Traversa, E. Sala, F. Traini,
R. Ornelas, J. Power Sources, 152 (2005) 16 - 21.
28. A. Saccà, A. Carbone, R. Pedicini, G. Portable, L. D΄Ilario, A. Longo, A. Martorana, E. Passalacqua, J. Membrane Sci., 278 (2006) 105 - 113.
29. A. Saccà, I.G.A. Carbone, R. Pedicini, E. Passalacqua, J. Power Sources, 163 (2006) 47
30. A. Carbone, R. Pedicini, A. Saccà, I. Gatto, E. Passalacqua, J. Power Sources, 178 (2008) 661 - 666.
31. M.P. Rodgers, Z. Shi, S. Holdcroft, J. Membrane Sci., 325 (2008) 346-356. 32. T. Li, Y. Yang, J. Power Sources, 187 (2009) 332 - 340.
33. V. Di Noto, R. Gliubizzi, E. Negro, G. Pace, J. Phys. Chem. B, 110 (2006) 24972-24986. 34. L.A. Cortez-Lajas, J.M. Hernández-Enríquez, A. Castillo-Mares, J.L. Rivera-Armenta, G.
Sandoval-Robles, L.A. García-Serrano, R. García-Alamilla, Revista Mexicana de Ingeniería Química, 5 (2006) 321 - 327.
35. Y.-F. Lin, C.-Y. Yen, C.-C.M. Ma, S.-H. Liao, C.-H. Lee, Y.-H. Hsiao, H.-P. Lin, J. Power Sources, 171 (2007) 388 - 395.