Research Report No 282
Evaluation of the Union Learning
Fund in Year 3
Matthew Antill, Jo Cutter, James Brass,
Cathy Mortimore, John Rodger and Neil Shaw
York Consulting
The views expressed in this report are the authors' and do not necessarily reflect those of the Department for Education and Skills.
© Queen’s Printer 2001. Published with the permission of DfES on behalf of the Controller of Her Majesty's Stationery Office. Applications for reproduction should be made in writing to The Crown Copyright Unit, Her Majesty's Stationery Office, St Clements House, 2-16 Colegate, Norwich NR3 1BQ.
Department for Education and Skills
An Evaluation of the Union Learning Fund in Year 3
Contents
Page
1 INTRODUCTION ... 1
2 PROJECT TYPE ... 6
3 OUTPUTS AND TARGETS ACHIEVED ... 14
4 BARRIERS TO ACHIEVING TARGETS ... 23
5 ULF LEARNERS... 26
6 BASIC SKILLS PROJECTS PERFORMANCE REVIEW ... 31
7 OTHER ACTIVITIES GENERATED BY ULF ... 47
8 ULF PROJECT PERFORMANCE - CONCLUSIONS ... 51
9 EMPLOYER PERSPECTIVES ... 56
10 BUILDING UNION CAPACITY IN LIFELONG LEARNING ... 65
11 RECOMMENDATIONS ... 76
Annex A Year 3 ULF Projects by Union
Annex B ULF Funding by Union
Annex C Additional learning activity generated by the ULF
Annex D ULF project performance data Years 1-3
ACKNOWLEDGEMENTS
The authors would like to thank all those that have contributed to this study, particularly the ULF project managers and staff, TUC Learning Services and the employers and learners that have given their time and feedback. We would also like to thank the ULF Evaluation Steering Group members and the DfES Analytical
i
EXECUTIVE SUMMARY
• This report sets out the findings from the national evaluation of the
Union Learning Fund (ULF) in its third year of operation.
Project profile
• The scale of ULF activity has increased by a third in Year 3, with 95
projects funded to a total of £4.2m. 32 of the projects focus on addressing basic skills in the workplace;
• One in five projects of the 95 projects are in their first year of
operation, half have been running in their second year and just under a third are more established projects that have been supported by the ULF for three years;
• There has not been a significant shift in the distribution of ULF
activity by region with relative concentrations in London and the North West;
• Overall, projects in Year 3 have delivered a higher level of average
output and there has been a significant increase in the number of employers involved, linkages to strategic partners such as National Training Organisations (NTOs) and linkages to workforce development initiatives including Individual Learning Accounts (ILAs) and basic skills. 20% of projects in Year 3 worked directly with Training and Enterprise Councils (TECs).
Sustainability
• Additional leverage of funding from employers and unions has
increased significantly with a total of £1.6m of funds levered into the ULF fund of £4.2m in Year 3. A greater number of projects have secured additional funding and this has been from a wider range of sources;
• Projects that have been running for three years have produced
ULF Learners
• Analysis of the profile of learners engaged in ULF learning activities
suggests that unions have been very successful in engaging non-traditional learners including older males, people in minority ethnic groups and shift workers. An estimated four fifths of ULF learners have qualifications below NVQ level 2 or equivalent. Further work is planned to develop the monitoring framework against which data on learners can be consistently reported across projects.
Outputs
• Across all three years of ULF funding:
- almost 14,000 people have taken part in learning; - 3,250 learning representatives have been trained;
- over 25,000 people have been reached by awareness raising activities;
- nearly 6,000 ILAs opened1;
- almost 9,000 individuals have had their learning needs assessed.
Performance
• In comparison to the previous two years, project performance
against targets has improved significantly. Key difficulties remain in recruiting union learning representatives, due to problems in securing release. A smaller but concerning number of projects report difficulties in accessing learning provision at or near the workplace.
• A minority of projects have not achieved their targets, however, the
more established projects are developing on a more strategic basis and have performed well. Although many of the barriers faced were due to external constraints, on-going support is needed to help ensure that the design and planning of projects are effective and seek to overcome barriers. Critically, there is an need ensure that, having encouraged learners to take part in learning, suitable provision is available and expectations are met.
1
iii
Capacity
• Despite the operational issues faced, overall, there has been a
significant increase in the extent to which lifelong learning for members has been integrated into many (40+) union agendas and capacity has developed through the development of skills and experience of key staff, the increase in union learning reps, the development mechanisms to support their work in the workplace and emerging union strategies on lifelong learning.
• Support and financial commitment from unions’ own funds has
increased dramatically in Year 3. There is still a long way to go, however, to ensure that the union learning agenda is effectively mainstreamed. There is an on-going need to ensure that policy and longer-term strategy are developed to build infrastructures and integrate lifelong learning with “mainstream” union activity and the work of partner organisations.
Employer Feedback
• The employer feedback that was received was very positive,
however, it cannot be reported as representative of ‘ULF’ employers as a whole due to the small numbers in the survey.
• Employers report that the learning activities funded by the ULF
have had a positive impact on both individuals and organisations. An unexpected benefit noted by employers has been the positive impact on industrial relations. Employers also identify that it is very unlikely that the benefits noted would have been achieved without the union led development that particularly helped to engage those who do not normally access learning at work.
• The feedback from employers and the lack of response also
indicates that there is further scope to engage management in the union-led activities supported by the ULF to ensure the workforce benefits are maximised.
Building Capacity
• The consultation with unions identifies ten key elements to build
union capacity to deliver lifelong learning:
- develop union policy on lifelong learning;
- clarify roles and responsibilities across the union; - strengthen and extend partnerships;
- develop structures and resources internally;
- share good practice to help build skills and expertise; - communicate successes to others;
- develop the longer-term vision for lifelong learning in the union.
Conclusions
• The ULF is at a turning point, where the period of trial and
experiment is coming to a close and there is a need to shift the focus to develop a medium term strategic framework within which ULF activities can develop. There are three key aspects that need to form the focus of sustaining ULF activities. These include:
- the development of union ‘learning strategies’ that set the vision and objectives for learning by both unions and DfEE (now known as the Department for Education and Skills, DfES);
- the development and extension of partnerships with colleges, LSCs, NTOs and employers;
- the building of internal infrastructures that can sustain union learning strategies.
Recommendations
• DfES sets the context for the ULF in the medium term by stating
more explicitly its expectations of ways in which union-led lifelong learning will develop in the next five to ten years.
• DfES, the TUC and unions agree the definition of what constitutes
‘capacity building’ in union lifelong learning and that, within this definition, there is a focus on the impact of union learning in the workplace.
• Union bids to the ULF state more clearly how specific activities aim
to achieve the union’s own objectives for building capacity in lifelong learning. The criteria for bidding to the ULF explicitly requires bids to identify activities under one or more of the following four headings;
- Basic Skills activities;
v
- Consolidation activities - roll out of activities developed in previous years;
- Infrastructure development.
• Support for ULF projects continues to focus on advice and support
for project managers, but also supports unions to develop bids in the following areas: detailed costings, targets and resource planning, partnership development and the development of wider strategies on learning.
• Unions and TUC/TUCLS nationally and in the regions improve and
co-ordinate communication strategies around ULF activities and achievements to raise awareness of union learning with potential partners including employers, employer networks, learning providers, funders and to other agencies promoting workforce development such as LSCs, Learning Partnerships, NTOs, RDAs and the SBSs.
• DfES develops a strategy for communicating the outcomes and
issues faced in the achievement of the ULF aims and objectives to other DfES teams and key agencies.
• DfES, the LSC and the TUC develop guidance and promote good
practice that encourages strategic and high level contact between unions and providers to help widen existing networks and partnerships and enhance the supply of workplace based provision for learners.
• The DfES and TUC agree a programme of communication with
non-participating unions with the aim of understanding if there are any barriers preventing participation in the ULF and that part of the ULF fund continues to remain available to unions wanting engage in the lifelong learning agenda for the first time.
• In continuing to develop the support given to unions the TUC
Learning Services:
- consults with unions about their priorities for developing skills and good practice and identifies preferred approaches for the delivery of this support
- sets out an annual timetable for events; and
• DfES and the LSC develop an action plan for 2001/2 to prepare for the handover of the ULF to the LSC. The plan should consider actions to improve communications with local LSCs and the wider range of agencies involved in workforce development including NTOs, RDAs, Learning Partnerships and the SBS and consider the potential for information or guidance given to colleges about their role in supporting ULF activities.
• The process of agreeing the monitoring and evaluation framework
1
1 INTRODUCTION
Background
1.1 The Union Learning Fund (ULF) was announced in ‘The Learning Age’ Consultation Paper published in February 1998. The Fund aims to promote innovative activity by trade unions to support the creation of a learning society.
1.2 The evaluation of Year 1 projects concluded that the ULF had been a success in its first year and in Year 2 activities had been further extended, but planning for sustainability was a key issue that needed addressing. This research report sets out the findings from the national evaluation of the ULF in its third year of operation.
1.3 At the time of writing there are a number of key changes taking place across the structures of organisations that deliver and manage government lifelong learning initiatives in England. This includes the establishment of the national and local LSCs (who will have responsibilities for developing strategies and resourcing local workforce development plans), a review of National Training Organisations (responsible for development sector workforce development plans) and the setting up of the Small Business Service. During 2001/2002, DfES will be working jointly with the National Learning and Skills Council (LSC) to prepare for the handing over of the responsibility for the ULF in 2002 to the LSC.
1.4 In addition, during 2000/2001, the TUC Learning Services (TUCLS) team has consolidated its structure of regional teams, formerly known as the TUC Bargaining for Skills teams, that had been mainly funded by Training and enterprise Councils (TECs).
Evaluation Objectives
1.6 The objectives of the evaluation of the ULF have been to:
• report progress and performance of projects;
• assess whether project activities are sustainable over the longer
term.
• identify the longer term impacts of ULF activities on unions, such as
changes in union management and policy on lifelong learning and the building of partnerships with other organisations;
1.7 The evaluation has been developed to report on the following key issues:
• what evidence is there of increased union capacity to support
learning?
• what evidence is there of increased take-up of learning by
employers and employees?
• what evidence is there that that new learning opportunities are
available to all employees/union members and previously excluded groups?
• to what extent have unions developed partnership arrangements
with employers to encourage learning amongst the workforce?
• what linkages are there to employer’s take-up of other workforce
learning/training initiatives?
• what evidence is there of the longer term sustainability of project
activities, including whether longer term commitment has been secured from other partners, such as employers and providers?
• what are the implications for the TUC & DfES to ensure the benefits
of ULF activities are maximised?
Methodology
1.8 In Years 1 and 2, the evaluation focused mainly on reporting on the achievements of individual projects. In Year 3, the collection of data from projects has remained the core focus of activities, however there have been three main changes in the focus of the evaluation:
• firstly, case study work has looked at the way in which unions have
3
• secondly, the evaluation has gathered some limited feedback from
employers, reporting on their motivations for involvement in ULF projects, the ways in which employers have been engaged and their view of impacts on the workforce;
• thirdly, projects have been asked to report data on the profile of
learners supported by ULF projects.
1.9 The evaluation also includes a special focus on the Basic Skills projects that have been funded by ULF.
1.10 York Consulting has surveyed project managers twice during the Year 3 evaluation in order to clarify details of project activities, to collect monitoring information on target and actual outcomes and obtain feedback on issues faced and lessons learned. Appendix A shows a full list of all ULF projects.
1.11 A total of 135 survey questionnaires were sent to projects, 95 to project managers of Year 3 projects and 40 to the project managers of activities funded in previous years but not in receipt of ULF funding in Year 3.
1.12 72 (75%) of the Year 3 projects and 22 (55%) of the Year 1 and 2 projects responded. The majority of Year 3 non-respondents were projects funded for two years until March 2002, or recently contracted with DfES and are due to complete in Autumn/Winter 2001.
1.14 In the first survey of project managers, respondents were asked if they were willing to provide contact details of employers to take part in an employer survey. 40 projects indicated that they would be willing to provide contacts and all were asked to provide a random sample of five employer names. A total of 67 employer contacts were provided. Employers were surveyed using a postal questionnaire. 20 employers responded (30%) and all were followed up with telephone interviews to discuss their responses in further detail.
Report Structure
1.15 The report includes quantitative and qualitative findings. Sections 2 to 6 report the quantitative data in the following way:
• Section 2 sets out the profile of projects;
• Section 3 reports on the quantified achievements of projects and
performance against objectives;
• Section 4 reports on the barriers faced by projects in the
implementation of activities;
• Section 5 reports details on the profile of learners involved in ULF
activities, and
• Section 6 gives an overview of the basic skills projects and their
performance.
1.16 Section 7 looks at the wider impacts of the ULF and reports on the types of activities that have been generated as a result of ULF funded activities and Section 8 seeks to draw conclusions from these findings about the performance of the ULF projects in achieving overall objectives of the fund.
5
1.18 A number of annexes include further detail on the ULF projects, outputs achieved and contextual data: Annex A shows the Year 3 projects by union. Annex B shows the ULF funding received by unions over the three years of the fund. Annex C shows the detail of additional lifelong learning activities reported by unions as being generated by the ULF. Annex D
2 PROJECT
TYPE
Introduction
2.1 In total, 215 projects have been supported by the Union Learning Fund over the last three years. In this section, we seek to provide an outline of the 203 projects that come into scope of the evaluation. Projects outside the scope of the evaluation include a number of short–term basic skills projects funded in Year 2 and contracts that have supported the work of the ULF team at DfEE. This section gives an overview of the projects supported by the fund and the extent to which this has changed over the past three years. This section looks at the type of projects, the location of activities by region and the partnerships that support project delivery. In addition, this section reports on the distribution of ULF funds and the additional funds levered from other external sources to support activities.
Number of projects and unions
2.2 In the first Year of the ULF a total of £1.7m supported 44 projects run by 19 unions and five regional TUC Bargaining for Skills (BfS) teams. In Year 2, 64 projects were run by 33 unions and 4 BfS teams and were allocated a total of £2.7m of ULF funding.
2.3 In Year 3 of the ULF, £4.2m has supported 95 projects funded across 41 unions and 4 BfS teams. Over half of the Year 3 projects (53) continued to fund activities supported in the previous year. Eight unions ran three or more projects including UNISON (12 projects), GPMU (9 projects), AEEU (6 projects), GMB (6 projects) and MSF (5 projects). Nine unions participated in the ULF for the first time in Year 3.
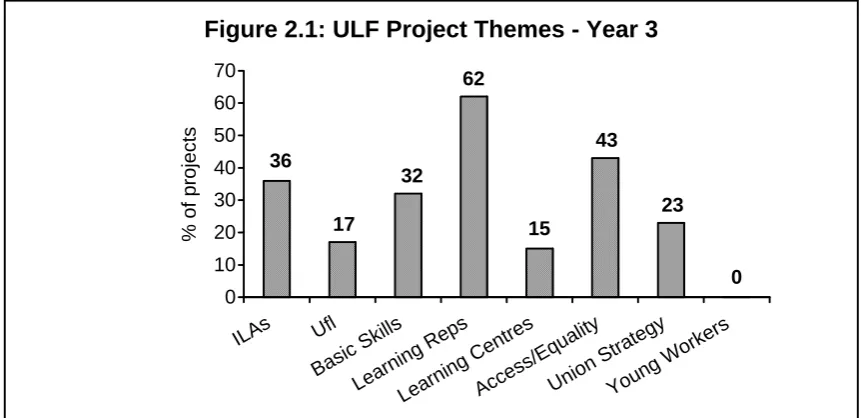
Projects by Theme
36 17 32 62 15 43 23 0 0 10 20 30 40 50 60 70
% of projects
ILAs Ufl Basic
Skills
Learn ing R
eps
Learn ing C
entre s
Acce ss/Equ
ality
Union Stra
tegy
Youn g Work
[image:17.595.89.520.88.297.2]ers
Figure 2.1: ULF Project Themes - Year 3
2.5 The most common activities in Year 3 are the development of Union Learning Representatives (hereafter learning reps). This Year, learning rep training has including both the initial training programme, mainly the TUC’s Front Line Advice and Guidance course and further training and development for learning reps including basic skills awareness seminars. Almost two thirds of projects include the training of union learning reps., compared to less than half of projects in Year 1.
2.6 Access and equality are also key themes and are explicitly addressed by almost half of all projects. There is much less focus in Year 3 on targeting younger workers, whereas young people were an area of particular priority in the initial stages of the ULF. In Year 4, a priority for the ULF will be age diversity, encouraging the provision of learning opportunities for workers of all ages. Other key points to note about the range of activities are:
• almost one in four of the ‘new’ Year 3 projects include addressing
basic skills. This includes a small number of ‘mainstream projects’ that are not part of the basic skills ring-fenced ULF funding programme;
• a third of continuation projects in Year 3 include an element of
developing union strategy on lifelong learning.
2.7 In Year 1, the focus of projects was very much on one or two core themes. In Year 2, projects became more complex, addressing a much wider range of themes and activities. This trend has not continued in Year 3, as it appears that unions have established and consolidated activities rather than develop more complex, multi-theme projects.
New and Continuation Projects
2.8 In Year 2 and 3 of the ULF, projects can be divided in to ‘new’ and ‘continuation’ projects. ‘New’ projects describe those that were not funded in the previous year. Conversely ‘continuation’ projects are those that have been funded by the ULF in previous years. Table D.2 in annex D shows the number of ‘new’ and ‘continuation’ projects over the three years.
2.9 In Year 2, a third of projects were a continuation of Year 1 activities. In Year 3, 56% of projects were continuation projects. Those projects that had been funded across the three years were required by DfEE to produce a ‘business plan’ that outlined how the projects was to be developed in the longer term, with the expectation that there should be evidence of longer term planning for sustainability.
Projects by Region
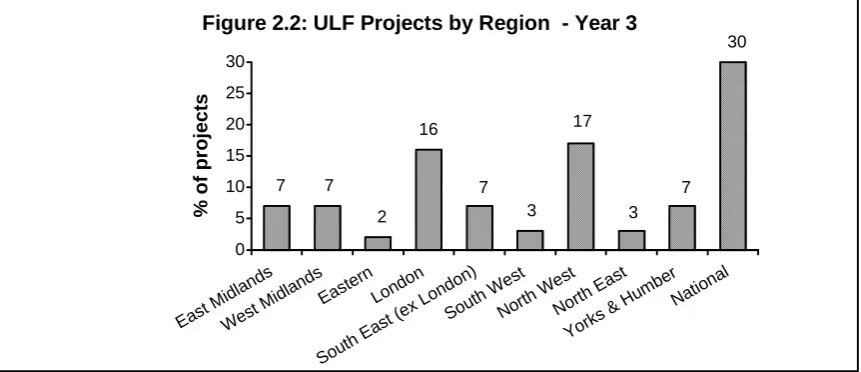
2.10 Figure 2.2 shows the number of projects operating in each region in Year 3. Table D.3 in Annex D shows this data over three years. In Year 3, just under a third of projects are defined as ‘national’. The majority of these projects include the development of central resources such as on-line materials for learning reps. A smaller, but increasing number of projects are ‘national’ in their aim to develop lifelong learning infrastructure across the union or in key sectors nationally. The remaining projects are distributed throughout the regions, with relative concentrations in the North West and London.
7 7 2 16 7 3 17 3 7 30 0 5 10 15 20 25 30
% of projects
East Midla
nds
Wes t Midl
ands Easte rn Lond on South East (e
x Lon don) South Wes t North Wes t North Eas t Yorks & Hum
ber Natio
[image:18.595.84.515.508.694.2]9
2.11 In Year 1, almost half of all projects either had a national focus or were based in the North West. In Year 2, the distribution of project activity increased in some of the relatively under-represented regions. The relative concentration of trade union density in the regions may explain some of the difference in the profile of ULF activities by region.
2.12 Annex E shows the Department of Trade and Industry (1999) Workplace
Employee Relations Survey 19982, which reports that the aggregate union
density is highest in the North West at 45% of all employees in establishments. However, density in London is relatively lower than the national average of 34% at 27%. It was noted in the Year 1 ULF evaluation that the reason for relatively high levels of activity in London and the North West was likely to be associated with the relative strength of the TUC Bargaining for Skills team in those regions. The Year 2 ULF evaluation noted the potential to stimulate activity in regions where there had been relatively few projects. In Year 3, however, activity remains relatively concentrated in the North West and London regions and the overall distribution has not changed significantly.
2.13 The analysis of the geography of ULF activities finds that, in addition to the 30% of ‘national’ projects, a further 10% of projects are operating in more than one region. This is a new feature of ULF projects. In previous years a project’s activities were most likely to be undertaken within a single area, whereas in Year 3, project activities are increasingly being managed across more than one region. ULF project managers also report working in more workplaces. Of those that have reported multi-site activity (30 projects), these report working across an average of six sites each.
Project Funding
2.14 Union Learning Fund projects in Year 3, as in previous Years, vary considerably in the amount of funding received. In Year 3, funding was available over two years and 9 projects were given funding for two years until March 2001. In addition, 18 projects contracted with DfEE during the year and are due to complete in Autumn/Winter 2001.
2
Department of Trade and Industry (1999) Workplace Employee Relations Survey 1998
2.15 Overall, the average funding per project has remained relatively stable at just over £40,000. Annex B shows the total ULF funding allocated to unions across Years 1 to 3. The larger unions (AEEU, GMB, GPMU, MSF, TGWU, and UNISON) received 45% of all ULF funding in Year 3. This proportion has increased from last year, where these unions were allocated 40% of the total funding.
Leverage
2.16 Additional funding leverage indicates the extent to which unions are integrating ULF with the work of other partners and have demonstrated their credibility and capacity to deliver to other funding sources.
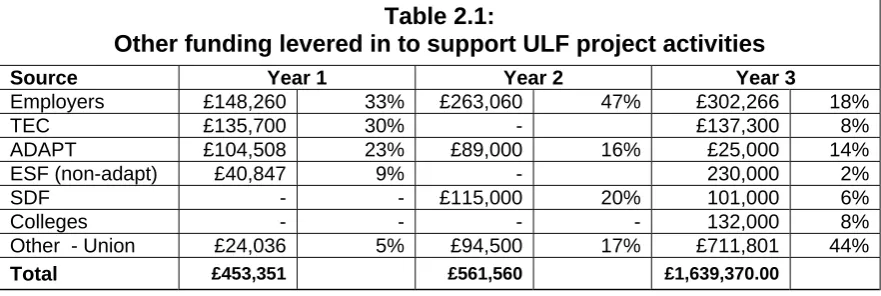
2.17 Table 2.1 shows that, in total, Year 3 projects report leverage of an additional £1.64m of external funds, to support and sustain ULF activities. This represents an additional 40% of the total of ULF funding in Year 3. In addition to these funds, projects note that there is significant additional support made in-kind from employers, unions and partners. Furthermore, some projects report that they are in negotiation with employers to secure funding, mainly around investment in learning centres and in several cases, projects did not wish to disclose the amount of employer funds involved, as this data seen was commercially sensitive.
[image:20.595.71.512.557.705.2]2.18 There has been a significant increase in the amount of funding levered in from the unions, indicating that ULF activities are being seen as more mainstream activities by the union as a whole. Table 2.2 shows that the amounts levered are a significant increase from previous years, both in terms of the proportion of projects levering in funding (just over one third) and an increase in the average amount levered in, £54,000.
Table 2.1:
Other funding levered in to support ULF project activities
Source Year 1 Year 2 Year 3
Employers £148,260 33% £263,060 47% £302,266 18%
TEC £135,700 30% - £137,300 8%
ADAPT £104,508 23% £89,000 16% £25,000 14%
ESF (non-adapt) £40,847 9% - 230,000 2%
SDF - - £115,000 20% 101,000 6%
Colleges - - - - 132,000 8%
Other - Union £24,036 5% £94,500 17% £711,801 44%
11
Table 2.2:
Trends in Leverage of others funding in to ULF projects
Year 1 Year 2 Year 3
Number of projects 16 13 30
Proportion of projects 36% 20% 32%
Average amount ‘levered in’ £28,300 £43,200 £54,600
External Links
2.19 Unions involved in ULF work with a wide variety of partners in the delivery of projects and link to a range of workforce development initiatives. One of the key aspects to developing learning capacity for unions is the extent to which they develop effective partnerships with other organisations. Table D.4 in Annex D shows the analysis of project bid partners over the three years.
2.20 Analysis of the project partners finds that the total number of colleges
mentioned in project bids as bid partners has not increased since last year, although, the total number of projects has increased by a third. The TUC ULF support team report that there has been an notable increase in the number of new colleges with whom unions have developed delivery partnerships, especially in the delivery of basic skills projects, where there has been considerable mutual benefit derived from joint working. Developing partnerships with new colleges enables unions to offer a wider range of provision to their members and colleges have benefited from not only accessing adult learners that may have not previously accessed further education (see Sections 5 and 6), but also from developing new working relationships with employers and enhancing the delivery of workplace provision.
2.22 There has also been an increase in the number of projects working in partnership with NTOs, demonstrating the extent to which the potential for links across the NTO network for joint working on workforce development agendas has been realised. A third of projects still have TUC links through one of the Bargaining for Skills teams and TUC Learning Service in the regions. Three projects have direct links with RDAs through funding support or via membership on project steering groups.
2.23 Finally, the analysis in Table D4 in Annex D shows that there has been a significant increase in the proportion of projects that involve unions working in partnership with other unions. One in five projects in Year 3 involve one or more unions.
Links to other Post-16 Initiatives
2.24 Projects seek to link to a wide variety of other workforce development initiatives. Integration with these initiatives provides the possibility of sustaining project activities both in terms of linking to opportunities for accessing ‘mainstream’ funding and linking learners to other learning routes and opportunities.
2.25 Table D5 in Annex D shows the number of projects reporting links to other workforce development initiatives. Overall, linkages have increased in Year 3 with the exception of the number of projects with direct links to UfI/Learndirect. Individual Learning Accounts (ILAs) remain the most common linkage, with 36 of the Year 3 projects facilitating learners’ access to ILAs as part of their programme of activities.
2.26 The decline in the number of projects reporting links to Ufi/Learndirect is partly due to the experience of projects in Year 2 where almost a third of projects expected to be working directly with Learndirect hubs or
13
Working with Employers
2.27 A key task in the development of the ULF projects has been the development of effective relationships with employers and to gradually increase the scale of projects, transferring models developed at one site to other sites or to new employers. In Year 3, projects have been asked to provide a variety of information relating to their relationships with employers involved in the projects, including:
• the number of workplaces/sites covered by the project;
• the status of any learning agreements with employers.
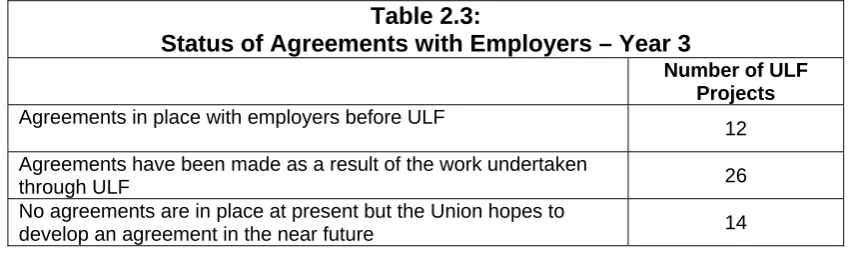
2.28 Around a third of ULF projects operate at more than one workplace or site, covering a total of 178 different sites. This represents an average of five sites per project, indicating that these projects are beginning to roll out their delivery models across multiple sites and across employers. Some observers assume that ULF activities occur in workplaces where positive partnerships already exist between unions and employers. In some projects, this is the case, however, increasingly projects report that union work on lifelong learning is helping to develop or improve workplace partnership. This is confirmed by employers (see Section 9). Table 2.3
[image:23.595.108.533.396.523.2]shows the status of agreements across projects.
Table 2.3:
Status of Agreements with Employers – Year 3
Number of ULF Projects
Agreements in place with employers before ULF
12
Agreements have been made as a result of the work undertaken
through ULF 26
No agreements are in place at present but the Union hopes to
develop an agreement in the near future 14
3
OUTPUTS AND TARGETS ACHIEVED
Introduction
3.1 In this section, we examine the performance of the projects undertaken in Year 3 of the union learning fund, compare this performance to that of projects in Years 1 and 2 and report on the total achievements over the three years. This analysis is based on a quantitative analysis of key output indicators as shown in Table 3.1. This standard set of indicators covers the broad range of activities undertaken by ULF projects.
Table 3.1: ULF Output Measures
1. Number of people attending awareness/briefing sessions;
2. Number of people having their learning needs surveyed/assessed3;
3. Numbers of learners starting courses: learners and learning reps;
4. Number of learning representatives trained: initial training and further training;
5. Number of Individual Learning Accounts: opened and used4;
6. Number of accredited courses developed5;
7. Number of other materials developed6;
8. Number of learning centres developed/enhanced;
9. Number of people achieving a qualification: learners and learning reps; 10. Number of employers involved.
3.2 However, it should be noted that the approach of using a standard set of output indicators hides the true variety of outputs achieved through ULF. In addition, the outputs achieved indicate the scale and type of activities undertaken, however, these indicators cannot be automatically used to measure the extent to which capacity has been built across the Union.
Section Ten discusses union capacity building in further detail. Nonetheless, the analysis does cover the majority of quantitative outputs and provides the basis for assessment of performance in Year 3 of the ULF.
3
‘Number of people having their learning needs surveyed/assessed’ includes those that have taken part in a general learning needs survey and those, such as basic skills learners, that have had a formal assessment of their learning need. 4
ILA ‘opened’ refers to an ILA account opened by individuals. The numbers reported by some projects will be an approximation of the number of ILAs opened, but cannot be truly reported as the exact number: ULF project workers help individuals access ILAs by getting application forms and advising on courses etc, but they do not open the account on behalf of the individual. Furthermore the extent to which an ILA has been used to pay for a course within the lifetime of the project will not be monitored by most projects, except in a small number of cases where the union is registered as an ‘ILA provider’. 5 ‘Number of accredited courses developed’ refers, in a small number of cases, to new qualifications developed. In most instances, however, this measure refers to the development of existing courses, customised to contextualise materials for specific groups of learners.
6
15
3.3 Some minor changes have been made to the way in which outputs are reported, including collecting further detail in some output measure categories. In addition, ULF project managers were asked to report for the first time on the following:
• the profile of learners taking part in ULF activities (see Section
Five);
• the additional activities that have begun or are planned as a result
of the successes achieved by one or more projects (see Section Seven).
Outputs achieved
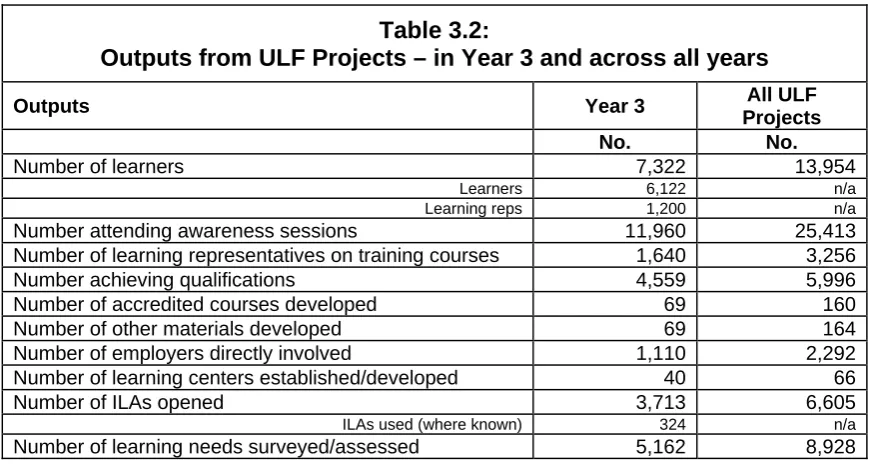
3.4 Table 3.2 shows a summary of the total outputs achieved by projects in Year 3, and the performance of all projects over the life of the ULF. It should be noted that the analysis only covers outputs achieved up to the 31st March 2001. A number of projects have run on into the 2001/2 financial next year and will achieve further outputs. These outputs will be reported in Year 4.
3.5 In summary the outputs achieved in Year 3 have been:
• 7,322 learners have taken part in learning, of whom 1,200 were
new learning reps;
• over 1,600 training episodes for learning representatives including
further training for existing learning reps in basic skills awareness;
• 69 accredited courses have been developed or customised;
• 3,700 ILAs opened.
3.6 Across all three years of ULF funding:
• almost 14,000 people have taken part in learning;
• 3,250 learning reps have been trained;
• over 25,000 people have been reached by awareness raising
activities;
• nearly 6,000 ILAs opened;
• almost 9,000 individuals have had their learning needs surveyed or
Table 3.2:
Outputs from ULF Projects – in Year 3 and across all years
Outputs Year 3 All ULF
Projects
No. No.
Number of learners 7,322 13,954
Learners 6,122 n/a
Learning reps 1,200 n/a
Number attending awareness sessions 11,960 25,413
Number of learning representatives on training courses 1,640 3,256
Number achieving qualifications 4,559 5,996
Number of accredited courses developed 69 160
Number of other materials developed 69 164
Number of employers directly involved 1,110 2,292
Number of learning centers established/developed 40 66
Number of ILAs opened 3,713 6,605
ILAs used (where known) 324 n/a
Number of learning needs surveyed/assessed 5,162 8,928
3.7 There is a wide range of other outputs achieved by the ULF projects. The following are examples of the additional outputs reported by unions that did not fit within the standard set of outputs measures. These include:
• Learning Bank – a database of training opportunities, and Learning
Champions (AEEU);
• training for Union Officers and joint working with other unions
(ASLEF);
• development of websites (BECTU);
• new stewards elected (GMB);
• a Black and Asian member networking group (IPMS);
• feasibility studies (NATFHE);
• Learndirect access points established (PCS);
• a database of professional facilitators and congress and conference
events (RCN);
• newsletters for members (UCATT);
• local and national agreements on learning agreed with employers
and secondment of internal project workers (USDAW).
17
Target Setting
3.9 Whilst the achievement of targets is not the only objective of the Union Learning Fund, the ability of unions to plan, monitor and achieve outputs is a factor that helps demonstrate capacity to develop and deliver learning. TUC Learning Services have been working with unions to advise on appropriate targets for projects, however, a significant minority of projects (15%) did not set out quantifiable targets in their project bids to the ULF in Year 3. In further discussion with the projects, the evaluators have identified at least one quantitative target for all but 2 of the Year 3 projects, which had outputs that could not be categorised within the standard set of ULF output indicators. For the remaining projects, performance against one or more target indicator is used in the following analysis. The analysis reports on the outcomes achieved by the 31st March 2001 and only for those projects that were due to complete by this date.
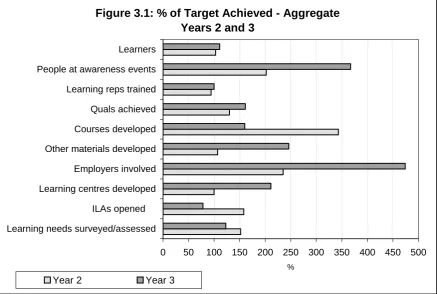
Achievement of targets
3.10 Figure 3.1 shows the extent to which aggregated targets (i.e. the sum of the expected target across all the projects that seek to achieve that output) have been achieved. In Year 3, targets have been met or exceeded their target against all outputs except the aggregate target for ILAs. Some targets have been exceeded by a considerable margin, including:
• the number of employers involved was almost five times that
originally forecast;
• the number of people reached by awareness raising activities is
almost four times the original target;
• the number of ‘other’ materials developed is more than double the
original number expected;
• the number of learning centres developed or enhanced has been
double that expected.
Figure 3.1: % of Target Achieved - Aggregate Years 2 and 3
0 50 100 150 200 250 300 350 400 450 500 Learning needs surveyed/assessed
ILAs opened Learning centres developed Employers involved Other materials developed Courses developed Quals achieved Learning reps trained People at awareness events Learners
%
Year 2 Year 3
3.12 Figure 3.1 shows aggregated data across all projects. This figure masks the fact that some projects under achieved and others significantly exceeded targets (this is discussed below). However, overall, Year 3 projects show a marked improvement in the delivery of outputs against targets. This is seen to be due to both improved capacity to deliver and better project management skills, including more realistic target setting.
•
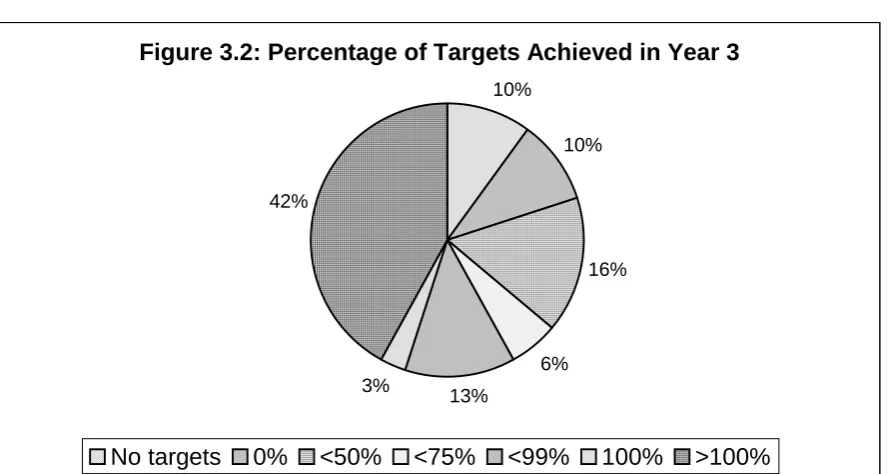
3.14 At the end of March 2001, 45% of projects had achieved or exceeded all of their targets, while a further 13% had achieved at least 75% of their targets. Conversely, 10% had made no progress towards their targets. This shows a marked improvement on the similar analysis of performance in Year 2, when for example, only 25% achieved or exceeded all their expected targets.
Figure 3.2: Percentage of Targets Achieved in Year 3
10%
10%
16%
6%
13% 3%
42%
No targets 0% <50% <75% <99% 100% >100%
Outputs per Project
3.15 Output per project7 provides an indicator of the extent to which capacity has developed through learning lessons from previous years and in delivering projects more efficiently. Table D.6 in Annex D shows the data on average outputs per project achieved over the three years.
3.16 In a number of key areas, the Year 3 projects have made substantial gains over previous years:
• the number of learners per project has increased steadily and in
Year 3 there is an average of 130 learners per project;
19
7
• there has been a substantial increase in the number of qualifications achieved per project. This suggests an improvement in support and focus on accessing accredited providers, and reflects the extent to which ‘continuation’ projects have supported learners engaged in previous projects through to accreditation;
• the number of employers directly involved in projects has also
increased, which again suggests increased capacity to deliver larger scale projects and provides an indication of the extent to which projects developed in one workplace are being rolled-out into new sites.
3.17 Despite the overall, very positive rate of improvement in performance, there are a number of areas where projects (overall) have not seen an improvement in performance on previous years. For example:
• the number of ILAs per project opened through ULF has fallen;
• the number of people that have had their learning needs
surveyed/assessed per project has also continued to fall;
• the number of learning reps trained per project has fallen.
•
3.18 The barriers that projects have faced in achieving their objectives, and the reasons for this are discussed below. In reviewing the output data, the seemingly relatively poor performance in undertaking needs assessment and accessing ILAs is felt by project managers to be partly due to the changing nature of projects.
3.19 The fall in the number of ILAs per project is felt to be due to the fact that in Year 1 and 2 many projects focused specifically on promoting ILAs and helping members to access provision using them, whereas the use of ILAs in Year 3 is now more integral to broader based projects that include several themes or activities.
21
3.21 The finding that projects have trained less union learning reps than anticipated does cause concern as the ULR is at the heart of much of the union learning agenda. Although the proportion of projects seeking to train and support ULRs has increased, the actual number of trained learning reps per project has fallen by nearly half since Year 1. This again may reflect a change in focus for projects as they try to build networks of support for their existing learning reps before training new ones. However, a number of projects have trained less ULRs than expected and several of these projects cite difficulties in securing release from employers for staff to attend learning rep training. A small number of projects have faced difficulties arranging training provision for learning reps. Below, we report on the barriers faced projects in achieving their objectives. A ‘lack of support from employers‘ is reported as the major barrier across the ULF and within this gaining release from employers for both ULR training and learners is a major issue.
3.22 Activities have been underway to seek to reduce these barriers. This has included developing a module on working with employers to include in the core union learning rep training course, the Front Line Advice and Guidance (FLAG) programme. In addition to the core 5-day course, the programme will have satellite modules covering specific topics such as NVQs, ICT and basic skills that will enable trained ULRs to attend for one day sessions to develop further skills and knowledge on topics of relevant to them in their workplace and to the learners they seek to support.
3.23 In addition to these developments, however, there remains a need to ensure projects that train learning reps also develop effective strategies for seeking to minimise these potential barriers. Even if the TUC’s proposals for the right to time-off for training for ULRs are realised, there will be a need to ensure that employers are supportive of the work ULRs, are convinced of the business benefits of release and that reps are effectively encouraged to take-up these rights.
• continuation projects supported over three times as many learners
to achieve qualifications;
• many more employers are involved in continuation project activities.
Costs per Output
3.25 Cost per output measures the efficiency of projects to deliver a single output8 and it is expected that cost per output would fall as capacity to deliver increases. Table D.8 in Annex D shows the analysis of cost per output achieved by the ULF projects in Years 1 to 3 and clearly demonstrates the significant fall in cost per unit across the key indicators, particularly in relation to learners enrolling, learners achieving qualifications and the number of employers directly involved in projects.
3.26 The only area in which cost per unit has increased since Year 1 is the take-up of ILAs, but, as discussed previously, this is probably at least in part due to difficulties experienced by some projects in accessing ILAs.
3.27 Overall this pattern suggests that unions are building on the groundwork undertaken in earlier funding rounds to roll-out larger scale projects using the knowledge and expertise they have gained.
8
4
BARRIERS TO ACHIEVING TARGETS
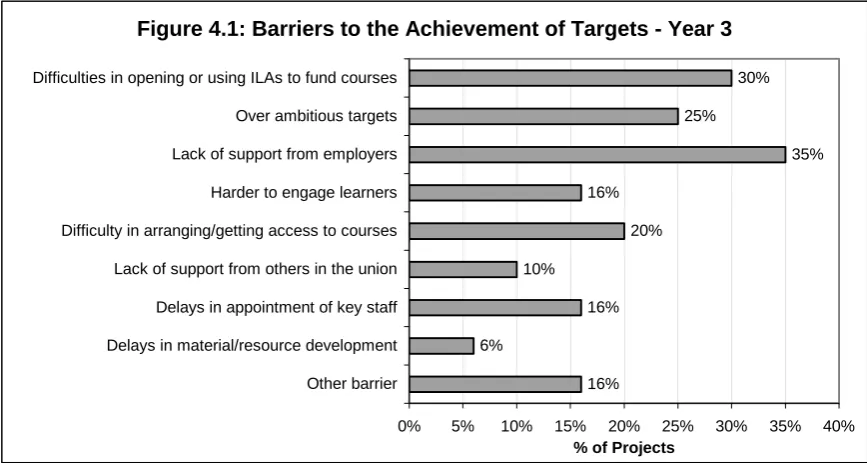
[image:33.595.88.522.195.428.2]4.1 In Year 3, projects were asked to identify the key barriers to the achievement of project targets. Figure 4.1 outlines the key barriers identified. Three quarters of projects identified at least one barrier.
Figure 4.1: Barriers to the Achievement of Targets - Year 3
16% 6%
16% 10%
20% 16%
35% 25%
30%
0% 5% 10% 15% 20% 25% 30% 35% 40%
Other barrier Delays in material/resource development Delays in appointment of key staff Lack of support from others in the union Difficulty in arranging/getting access to courses Harder to engage learners Lack of support from employers Over ambitious targets Difficulties in opening or using ILAs to fund courses
% of Projects
4.2 Almost four in ten projects feel that they faced barriers to achieving targets due to a lack of support from some employers. This includes difficulties faced even when national partnership or corporate learning strategies are in place where as one project manager notes:
• “The principle of Lifelong Learning has been agreed at senior level
and we are now getting forward agreement of this, however the operational implications of corporate policies have not filtered through to local operational managers”(ULF project manager).
4.3 Overall, the issue of securing release for learners continues to be an issue for projects, indicating the continued need for projects to promote the business benefits of ULRs to employers. The other main barriers faced in project delivery have been:
• difficulties in opening or using ILAs to fund a course;
• over ambitious original targets;
• difficulties in arranging/getting access to courses.
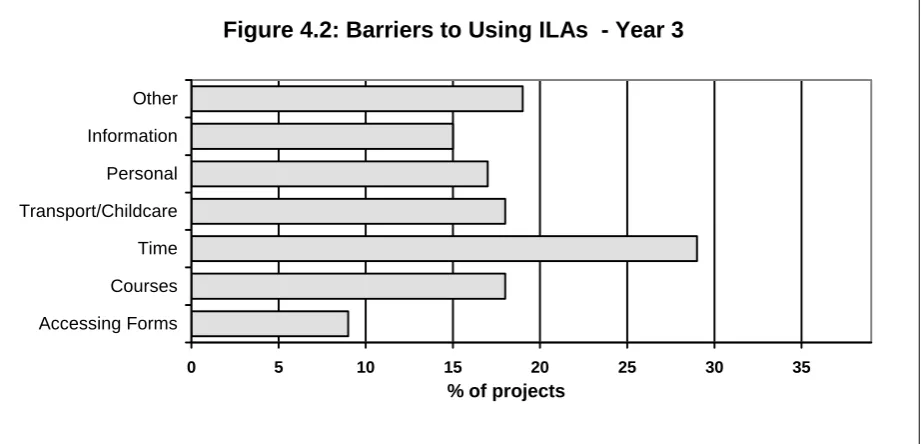
4.4 The issues mentioned in the ‘Other’ category of barriers include problems created through the announcement of redundancies by firms and other unrelated industrial relations issues that have caused workplace projects to be put on hold. Projects were asked to identify any specific issues relating to use of ILAs. The responses are outlined in Figure 4.2.
Figure 4.2: Barriers to Using ILAs - Year 3
0 5 10 15 20 25 30 35
Accessing Forms Courses Time Transport/Childcare Personal Information Other
% of projects
4.5 Overall, just under half of the projects seeking to access ILAs for members reported no problems. Figure 4.1 shows that ULF Projects Managers are most likely to identify issues relating to courses and time as being the greatest barriers to using the ILA. Difficulties relating to courses refer to finding appropriate courses or relate to the learners confidence to progress to college based provision.
25
4.7 In addition, financial barriers, including the payment of the £25 contribution is still felt to present a barrier to low paid workers. The costs and access to transport and childcare are also felt to be more significant barriers for ULF learners than for ILA customers as a whole.
5 ULF
LEARNERS
5.1 An additional area for investigation in the Year 3 evaluation has been the collection of data on the profile of the learners9 involved in the ULF projects. It is recognised that at present many projects do not have the systems in place to provide detailed information about learners, and requests for this information were not made until early in 2001, making it difficult for projects to collect data on learners retrospectively. Projects were asked to report on the following: gender, age, ethnicity, disability, occupation, employment status and previous learning and qualifications of learners.
5.2 There was very little data known on the proportion of learners with a disability. Overall, two thirds of projects were able to provide information about the characteristics of learners. During Year 3, TUC Learning Services has led development work with participating unions and DfEE to agree the framework of monitoring data that reports on union learning. This has included clarification of the definitions and methods of collection of data on the profiles of learners taking part in ULF activities. This work will be on-going in Year 4 of the ULF.
5.3 Where possible, comparisons are made here to similar data reported in the National Adult Learning Survey (DfEE, 1997). No direct comparisons should be made between the two sets of data as the sampling and reporting mechanisms differ considerably between the two sources of data. Therefore, the extent to which observed differences in the data from the two sources are due to factors such as the relative concentration of ULF activities in certain industry sectors or in certain geographical regions cannot be known. However, NALs does provide interesting benchmark against which to report the profile of ULF learners.
Gender
5.4 Figure 5.1 shows the proportions of male and female ULF learners and the results by gender of the National Adult Learners Survey (NALS). Figure 5.1 shows that around 69% of ULF learners are male and 31% are female. This differs markedly from respondents to the National Adult Learners Survey, which reported a relatively even gender distribution of adult learners nationally.
9
Figure 5.1: Gender of Adult Learners - ULF and NALs
0% 10% 20% 30% 40% 50% 60% 70% 80%
Male Female
% of learners
ULF NALS
Employment Status
[image:37.595.93.534.451.635.2]5.5 Figure 5.2 shows a similar comparison for the employment status of ULF learners. Figure 5.2 shows that the vast majority of learners involved in ULF are employed full-time (around 89%), which is higher than the proportion of learners in the National Adult Learners Survey. Furthermore, it should be noted that a significant minority of ULF learners work shifts, a group always perceived as marginalized by existing provision. An estimated 6,500 ULF learners in Year 3 were full-time employees, 775 worked part-time and just over 2,300 were shift workers.
Figure 5.2: Employment Status of adult learners - ULF and NALS
0% 10% 20% 30% 40% 50% 60% 70% 80% 90% 100%
Full Time Part Time Shift Workers
% of learners
ULF NALS
Ethnicity
[image:38.595.71.518.205.314.2]5.6 Table 5.1 shows the breakdown by minority ethnic group of ULF learners in Year 3 and that reported in the National Adult Learning Survey. Again there are marked differences between the make-up of ULF learners and those covered by the National Adult Learners Survey. Broadly, ULF has a relatively higher proportion of learners from minority ethnic groups.
Table 5.1:
Ethnicity of ULF and NALS Learners
% ULF Estimate for ULF % of NALS
White 90% 6,600 95%
Black 2% 149 1%
Indian 4% 267 2%
Pakistani/Bangladeshi 2% 135 0%
Chinese 0% 20 0%
Other 2% 150 2%
Age
[image:38.595.76.517.448.593.2]5.7 Figure 5.3 shows the age profile of the ULF learners in Year 3, again compared to the National Adult Learning Survey10. The graph demonstrates the strength of ULF in engaging older workers, over two thirds of ULF learners are aged between 41 and 60 compared to around 37% of those reported in the NALS.
Figure 5.3: Age profile of adult learners - ULF and NALS
0% 5% 10% 15% 20% 25% 30% 35% 40%
Under 21 21-30 31-40 41-50 51-60 60+
% of learners
ULF NALS
10
Occupations
[image:39.595.91.548.273.681.2]5.8 Figure 5.4 shows the occupational breakdown of the ULF learners in Year 3, again compared to the NALS. Figure 5.4 indicates that the ULF projects have been successful in targeting learners who are excluded access to learning. The key occupational areas in which ULF projects reach learners are craft and related occupations (34.4%), plant and machine operatives (24.4%) and other and unskilled occupations (21.0%). A total of 80% of ULF learners work in these occupational groups, compared to 23% of those reported nationally in NALS. Table 5.2 shows the estimates for learners in each occupation covered by ULF.
Figure 5.4: Occupational profile of adult learners - ULF and NALS
0% 5% 10% 15% 20% 25% 30% 35% 40%
Managers &
Administrators Professional Occupations
Associate
Professionals & Technical
Occs
Clerical & Secretarial Occupations C
raft &
Relat
ed
Occupations Personal & Protective
Services Sales
Occupations
Plant & Machine
Operations Other & unskilled occupations
% of learners
ULF NALS
Table 5.2:
Occupations of learners
% of ULF Estimate for ULF
Managers & Administrators 1.3% 100
Professional Occupations 7.7% 570
Associate Professionals & Technical Occs 4.2% 310
Clerical & Secretarial Occupations 4.1% 300
Craft & Related Occupations 34.4% 2,520
Personal & Protective Services 0.0% 0
Sales Occupations 2.8% 200
Plant & Machine Operations 24.4% 1,790
Other & unskilled occupations 21.0% 1,540
Highest Qualification
5.9 ULF project managers estimate that only around a fifth of ULF learners have a highest qualification level of NVQ level 2 or equivalent or higher. This compares to around 52% of respondents to the NALS. This would seem to be further evidence of unions’ ability to reach those traditionally excluded from learning through the work of the ULF.
Non-traditional Learners
5.10 Project managers also estimate that up to four fifths of learners (80%) engaged through the ULF have not taken part in any formal learning at or outside of work in the past two years. In the National Adult Learning Survey, three out of four learners (74%) had participated in learning at some point in the three years prior to the survey.
31
6
BASIC SKILLS PROJECTS PERFORMANCE REVIEW
“This course has given me the chance to get beyond the conveyor belt and factory life. I used to be frightened of going back to learning but now I am not. It has widened my way of thinking. I am very grateful to the Baker’s Union, Oldham College and Park Cakes Bakery for giving me this chance”
Learner, Basic and Key Skills in the Baking and Food Industry, BFAWU
Introduction
6.1 In this section we report on the progress and achievements of the basic skills funded projects through Year 3 of the ULF and compare them to the achievements of the Basic skills projects funded in Year 2.
6.2 The funding of projects with a specific focus on basic skills began in Year 2, in collaboration with TUC and the Basic Skills Agency. Over the two years, 43 projects have been supported (a third of all ULF projects) to address basic skills in the workplace. The remainder of this section is structured as follows:
• key findings from the review of basic skills projects last year;
• the profile of basic skills projects;
• outputs achieved;
• learner profiles;
• evidence of capacity building.
Key findings from Year 2
6.3 Year 2 of the ULF funded the first tranche of basic skills projects. The evaluation reported on the key achievements and lessons learned by the unions involved. In Year 2, most project teams had little or no previous experience of working in this field. To support the basic skills projects, the TUC and Basic Skills Agency provided a dedicated resource to provide advice and guidance to unions. This support has been recognised by unions as a model of good practice in helping projects and in building union capacity in this area. The Year 2 evaluation also identified the following:
• the projects made good initial progress in developing structures of
support in a limited period of time;
• however, the number of learners with basic skills needs that had
• the projects reported the importance of engaging employers in the development of basic skills within the workplace;
• the process of engaging learners for basic skills provision was often
slow and harder than expected, and reinforced the need for ground work to be done in the development of structures such as learning reps, methods of assessment and workplace provision before learners could be effectively engaged;
• the monitoring of learner achievement and progression was a
relatively weak aspect for many projects;
• overall, however, the issue of addressing basic skills had become
an important agenda for several unions.
Number of projects and unions
6.4 In Year 2, there were 11 basic skills projects run by 8 unions and one Bargaining for Skills (BfS, now TUC Learning Services team) in the regions. All of the unions running projects in Year 2 have continued basic skills activities in Year 3. In Year 3, 16 unions and four BfS team ran 32 basic skills projects in Year 3.
Projects by Region
6.5 Figure 6.1 shows the geographic distribution of projects in Year 2 and 3. the profile is similar to that of the ‘mainstream’ ULF projects in the regions areas with the highest concentration of activities are the North West and London. The distribution of projects has become more evenly distributed since Year 2. In Year 2, basic skills projects were located in six regions. In Year 3, there was at least one project in all regions, with the exception of the East of England.
6.6 In Year 3, there are also four basic skills projects with a national focus compared to none with this focus last year. These national projects include ASLEF’s Improving basic skills in the rail industry, BFAWU’s Basic and key skills in the baking and food industry, CATU’s Facing the future together and UNISON’s Workplace basic skills capacity building.
Figure 6.1: Distribution of Basic Skills Projects by Region Years 2 and 3
0 5 10 15 20 25 30 35
EM WM Eastern London SE SW NW NE Y&H National
% of basic skills projects
Year 2 Year 3
Project Funding
6.8 Total funding of basic skills projects in Year 2 was £400,000 and just over £1.5 million in Year 3. The average funding size of basic skills projects has increased. In Year 2, 77% of projects were funded by the ULF to between £20,000 and £40,000, but in Year 3 nearly three quarters of the projects received more than £40,000 of ULF funding. In addition, the number of smaller projects (less than £20,000) funded this year has increased. These projects include CATU - Facing the Future Together and UNISON – Capacity building. These smaller projects consolidate basic skills activities developed in Year 2 or through the union’s other learning activities.
External Links
6.9 The ability of the basic skills projects to engage partners in the development of learning activities is vital to their success. An analysis of the partners involved as project bid partners shows that there has been an increased proportion of projects working with NTOs and RDAs, with one in five projects working with an NTO and one in six working with an RDA.
6.10 The evaluation in Year 2, identified the involvement of employers as active partners in basic skills projects as being critical not only to the success of the single project but to building employer understanding of basic skills issues and sustaining activities. The two most prominent groups of partners are colleges and employers. However, overall, the percentage of projects with employers identified as bid partners has declined. In contrast, at the local level, projects have developed a wide range of new partnerships with providers and employers and the actual number of employers and colleges taking part in projects has increased.
Outputs achieved
6.11 Three of the projects report no outputs to date. Two report that this is because their contract with DfEE began later in the year. The other has been delayed due difficulties in committing staff resource to the project: resource that is already committed to other ULF activities. Table 6.1
shows the summary outputs achieved across the remaining projects. In Year 3 of the ULF, basic skills projects have reported that just under 2,300 learners have been engaged in project activities. In addition, 647 learning reps have been trained in basic skills awareness.
6.12 One project, Bargaining for Skills in the North West, assisted 960 or 40% of the total learners supported by the ULF basic skills projects this year. This was due to a unique opportunity offered by an employer to assess and train employees on one site. Whilst this achievement must be celebrated in terms of the scale of achievement, it must be noted that the circumstances by which it came about means that it would be unlikely that this scale of activity would be replicated in an ‘average’ ULF project, however, the scale might be repeated in projects where similar circumstances of large scale redundancies or closures were happening.
35
Table 6.1:
Basic Skills Projects - Outputs in Year 3
Year 3 N
Number of learners 2297
Number of learning representatives trained 647
Number of courses customised/contextualised for specific
workplaces/unions 26
Number of ‘other’ materials developed 25
Number of learning centres established/developed access to 10
Learning reps - basic skills awareness training
6.14 During the Year, the TUC and partners have developed the basic skills awareness course as additional provision within the Front Line Advice and Guidance (FLAG) training for union learning reps. Across the basic skills projects, 228 new learning reps new have been trained and a total of 419 learning reps have attended the basic skills awareness course, this includes ‘new’ learning reps and those that have attended the FLAG course in previous years.
Accreditation and progression
6.15 Table 6.2 indicates that just under 1,500 ULF basic skills learners or 58% of those that had started a basic skills programme, had achieved accreditation by the 31st March 2001. Awards include OCN, Wordpower and Numberpower. The remaining 42% of those starting programmes had not completed their learning by this date.
Table 6.2:
ULF Basic Skills Projects – Qualifications and Progression Year 3
N
Number of people who achieve qualifications 1,442
Number of lLAs opened 391
6.16 ULF project managers report that 9% of learners (134) that have completed their basic skills course have progressed on to other courses including key skills, CLAIT, IBT and ECDL programmes. However, tracking the progression of learners onto other provision is not standard practice across the ULF projects and there may be additional numbers progressing into other learning.
6.17 Projects also report that 17% of basic skills learners have also opened an ILA, however because the opening of ILAs cannot be tracked by ULF project managers, the actual number of accounts used to fund courses to which basic skills learners progress cannot be reported.
6.18 Table 6.3 shows the total number of people involved in awareness raising activities. These activities include events in the workplace that introduce potential learners to the project and explain options for taking part in basic skills programmes. This activity also includes communication to a wider audience of employees, managers, union officials and partner organisations. In total, almost 4,500 people have been engaged in basic skills awareness raising activities.
6.19 Across the projects, 140 employers have been involved in the ULF basic skills activities, an average of 7 per project. This compares to an average of 3.5 employers per project last year and is higher than the target number forecast. This indicates that, although there are some difficulties in ensuring that there is effective partnership working with employers to secure release for learning and in supporting basic skills learners at work, many projects have been more successful than expected in engaging employers in the issue of addressing basic skills in the workplace.
Table 6.3:
ULF Basic Skills projects - Engaging learners and employers Year 3
n
Number of people attending awareness raising events 4468
Number of employers involved 140
6.20 The total number of learning needs assessments reported is 1,036. This is less than half of the number of basic skills learners reported. This difference potentially causes concern as it is expected that all basic skills learners will have a formal needs assessment at the start of their programme. This is potentially a reporting problem due either of a lack of clarity in the definition of learning needs assessment or that ULF projects are not