INTERNATIONAL CONFERENCE ON ENGINEERING DESIGN ICED 03 STOCKHOLM, AUGUST 19–21, 2001
INTELLIGENT DESIGN GUIDANCE
Robert Ian Whitfield, Alex H.B. Duffy, Zhichao Wu, Joanne Meehan
Abstract
This paper presents results from an investigation regarding the use of the Design Structure Matrix (DSM) as a means to guide a designer through the calculation of numerical relationships within the early design system Designer. Characteristics, relationships and goals are used within Designer to enable the evaluation and approximation of the design model and are represented within the system as a digraph. Despite being a useful representation of the interactions within the design model, the digraph does not aid the designer in identifying a sequence of activities that need to be performed in order to evaluate the model. The DSM system was used to represent the characteristics and the dependencies obtained through the relationships. The sequence of characteristics within the DSM was optimised and used to produce a design process to guide the designer in model evaluation. The objective of the optimisation was to minimise the amount of iteration within the design process. The process enabled a designer who is unfamiliar with the model to evaluate it and satisfy the design goals and requirements. Both the DSM system and the Designer system are generic in nature and may be applied to any design problem.
Keywords: Numerical knowledge modelling, Design Structure Matrix, optimisation.
1. Introduction
and the requirement for additional design assistance and guidance will become of greater importance. The Designer system is described within Section 2.
The Design Structure Matrix [2,9] has been adopted as a modular add-on to the Designer system to provide additional functionality with respect to representing the information contained within the digraph. In addition to this, the sequence of activities with respect to updating and evaluating may be determined and optimised using a Genetic Algorithm, to reduce the number of characteristics that are required to have their values estimated in order to start an iterative loop. The DSM is used not only as a modelling technique but as an intelligent design guidance assistant, to inform the engineering designer of the best sequence of activities to be undertaken, as well as prompting the designer for characteristics to be updated, relationships to be evaluated, iteration to be conducted and goals to be checked. The DSM system is described within Section 3, with a description of the problem within Section 4, and finally concluding within Section 5.
2. Description of the Designer system
This section describes the system called Designer that may be used for the manipulation of numerical relationships that frequently occur within the concept design stage. A more detailed description of the system, its functionality, and the rationale regarding its operation may be found in [6,7]. The objective of Designer is to facilitate a partnership between the user and the system through an improved representation of numerical knowledge modelling. In particular, it was identified [1] that the partnership should support the following features:
• Accept and represent a designer’s description of the design problem.
• Assist the designer in describing and evaluating solutions to the problem.
• Allow the designer to impose their method of solving a problem.
• Permit expansion or modification of the problem and its solution during the design process.
• Carry out small design subtasks as required.
• Explain itself and its reasoning process.
• Handle numerical values and relationships in a way that is meaningful to the designer.
To facilitate this partnership the system should operate on information at the same level of abstraction as the designer, rather than in some level that is computer oriented. It must therefore be able to formally represent the designer’s intentions and descriptions; to recognise patterns in the information and apply appropriate methods to assist the designer; and, to monitor and explain its own actions. The Designer system was not originally intended to be a complete answer to these requirements, but rather an experimental system to evaluate the approach and to obtain a fuller understanding of a user’s needs when working with the system. The resulting system provided an explicit representation of numerical relationships, together with the facility to define a “model” of relationships and explore the behaviour of that model in a flexible but controlled way. Figure 1 represents the concept of the Designer system.
(characteristics’ value) and behaviour (characteristic interactions), it does not remove the creative and decision making aspects of design from the designer.
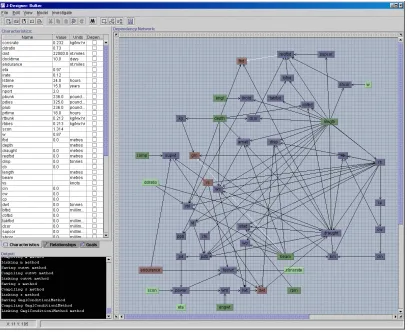
The Designer system uses numerical design knowledge in that the model upon which the system acts represents knowledge of design characteristics (such as length or deadweight) and of their relationships. This knowledge can be visualised as a directed graph (digraph) in which the nodes represent characteristics and the arcs represent dependencies as contained in numerical relationships between the characteristics. Figure 2 shows the Designer system software with a digraph representing the characteristics and relationships for a bulk carrier.
Each node and its associated arcs represent a block of knowledge about a characteristic (for example, its meaning, numerical value, a set of possible relationships, and conditions for use). Characteristics may have associated with them conditions that must be satisfied before its value will be calculated or updated. Additionally, relationships may have conditions that act to limit its validity, and many relationships can be associated with a single characteristic. In any situation a relationship is used if it satisfies its validity conditions and used if appropriate information is available.
Model Building
Model Investigation
Designer System
User Model
(Creates, directs, decides etc)
(Equations, relationships,
rules, values etc)
Defines model, interrogates, gives advice, updates values etc)
Design Solution
Pre-defined Model
Figure1. The Designer system concept.
The Designer system provides the user with functions that allow progress through the design process (such as, estimate a characteristic’s value, update a value, and plotting the values of characteristic A over a range of values of characteristic B). Characteristics and relationships within the model can also be defined or redefined interactively. This permits flexibility and allows both the system and the model to be modified to any particular needs of any designer. The relationships are expressed as Java methods, which are stored, compiled and linked to the relationships automatically by the system. The Java programming language makes relationship evaluation an extremely flexible and powerful process, in particular through the use of the extensive Java libraries.
Advice can be given to help the user make decisions during the design process. This advice is based on the use of “strengths”, which may be thought of as local measures of the influence between two characteristics. This gives the user a numerical indication of the consequence of a change to a value of one characteristic upon another. A number of functions use these strengths to advise the user while they proceed through the design process.
Figure 2. The Designer system showing characteristics and relationships.
3. Description of the DSM system
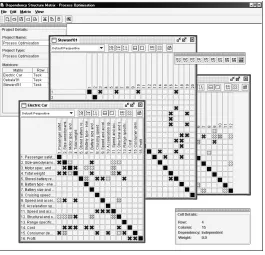
[image:5.595.167.432.258.513.2]The Design Structure Matrix, has been extensively used to represent tasks and their dependencies. The DSM was originally constructed to consist of a sequence of tasks that are represented in the same order in both the row and column of the matrix [2,5,9]. The central part of the matrix represents the dependencies between the tasks. Steward [9] originally represented the dependencies in a binary form: 0 to indicate no dependency, and, 1 to indicate a dependency, however, the modelling technique has evolved to consider the weight of the dependencies, as well as consideration of the matrix and the dependencies as representing concepts other than the flow of information [10]. The DSM modelling and analysis system was constructed with the focus of providing mechanisms to enable the optimisation of matrices with respect to any number of pre-determined performance metrics – Figure 3.
Figure 3. The DSM system.
The system allows the creation of matrices containing any number of concepts with the matrix changing size automatically as concepts are added or removed. The state of a dependency within the matrix may be changed from independent to dependent as well as changing the weight (or importance) of the dependency, which is reflected by its colour. The system is intended to be an aid to the designer to improve their understanding of the relationships within the model and enable “what-if” scenarios to be investigated with respect to reordering the concepts both manually and automatically using optimisation. The system provides a representation of a model that requires knowledge and experience of that representation to interpret the results.
the dependencies for B and C would again be 1.0, however the dependency for Z would be the next lower strength (0.9). This weighting mechanism is applied through a back-propagation of all relationships to the lowest strength relationship (0.1). The associated matrix is a densely populated transformation of the information contained within the digraph. The alternative sparsely populated transformation is achieved through the consideration of direct relationships only. Examples of these two transformations may be seen within Figures 5 and 6. The associated densely populated matrix increases the amount of information that is used within the optimisation process and in determination of the design process. The effect of using either the densely or sparsely populated matrices on the design process is discussed within Section 4.
The design process may be manipulated manually by dragging either of the rows or columns into a new position whilst simultaneously re-calculating the performance metrics, assisting the user in the determination of an improved process. Alternatively, the matrix may be optimised using one of the optimisation algorithms available within the optimisation module.
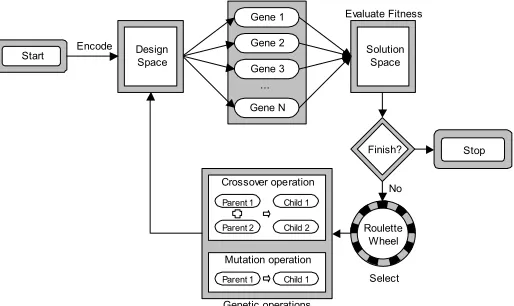
Within this research, the general procedure for Genetic Algorithms developed by Goldberg [4] has been used to enable the evolution of optimal design processes. The objective of the GA in this application is to minimise a criterion that represents the number of occasions that characteristic’s values would have to be estimated. Achieving this objective would result with a process that is entirely sequence with no iteration. A design process that requires estimation of characteristic values may also necessitate iteration in order to verify the initial estimates. The Genetic Algorithm is illustrated within Figure 3. The GA developed within this system is generic in nature using object-oriented design techniques and allows the encoding of a sequence of any type of information. Within this application, the chromosome is initially encoded as a random sequence of characteristics, however this may be changed without modifying any aspect of the GA to represent a sequence of cities within the Travelling Salesman Problem for example. Randomising the sequence of characteristics within the chromosome attempts to ensure that the chromosome represents a unique point in the solution space, such that a group of chromosomes are randomly distributed throughout. In the case of the DSM problem, the group of chromosomes, or initial population, generally represent sequences of characteristics that have poor performance criteria.
Gene 1
Gene 3 Gene 2
Gene N
Mutation operation
Parent 1 Child 1 Parent 1 Parent 2 Child 1 Child 2 Crossover operation Roulette Wheel No ... Evaluate Fitness Select Finish? Genetic operations
Encode Solution
Space Design
Space Start
[image:6.595.172.429.529.682.2]Stop
Figure 4. A general structure for genetic algorithms.
[8], however the Genetic Algorithm may be used to estimate multiple objectives. The Scott partitioning – Equation 1 is similar to Gebala partitioning [3] except that each dependency is weighted with respect to its distance from the bottom left-hand corner. The weighting is also greater for dependencies above the leading-diagonal. Minimisation of this criterion will primarily reduce the size and number of iterative blocks, as well as attempt to move the dependencies into the bottom left-hand corner.
(
)
∑ ∑
= = Ω ×= n
i n
j ij wi j
1 1 , ,
ng Partitioni
Scott 1
where: n is the number of characteristics in the DSM,
i and j are the row and column indices,
wi,j are the dependency weights, and,
(
)
[
]
(
2)
, = 1× + −1
Ωi j j n for j<i
(
)
[
]
(
2)
, = 100× + −1
Ωij j n for i<j.
4. Problem and results
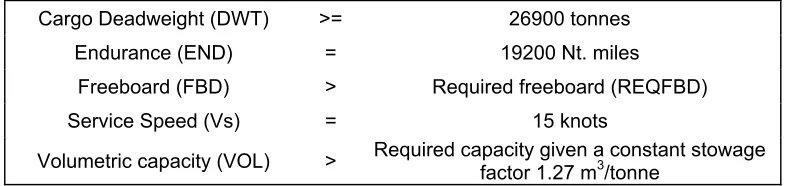
The bulk carrier model described by Duffy [1] and represented within Figure 2 was used within the investigation. The model consists of 49 characteristics, 35 relationships, and 5 goals. The characteristics that do not have any associated relationships are considered to be independent and may have their values inputted by the user. Table 1 describes the goals for the design problem.
The characteristics and relationships were incorporated within the matrix – Figure 5a. Characteristics that directly used other characteristics in their relationships were given the strongest dependency with a weighting of 1.0, whereas characteristics that indirectly involved other characteristics were given a weighting that was proportional to the level of propagation.
Cargo Deadweight (DWT) >= 26900 tonnes
Endurance (END) = 19200 Nt. miles
Freeboard (FBD) > Required freeboard (REQFBD)
Service Speed (Vs) = 15 knots
[image:7.595.104.498.568.661.2]Volumetric capacity (VOL) > Required capacity given a constant stowage factor 1.27 m3/tonne
Table 1. Bulk carrier design goals.
row within the matrix that has no dependencies across the row, i.e. it is an independent characteristic. An evaluation activity is represented by a row within the matrix that has dependencies of strength 1.0 at any point across the row. Lower strength dependencies indicate that other characteristics should be evaluated prior to the evaluation of this characteristic. These lower strength activities play a significant role during the optimisation process by providing the model with a more detailed description of the precedence within the matrix than would be achieved through a transformation of direct dependencies only. Finally, estimation takes place for a characteristic that has a dependency of weight 1.0 to the right of the diagonal, followed by the evaluation of the associated characteristic.
Figure 5a & b. Initial and optimised matrices defining characteristics and relationships.
Figure 5a represents the sequence of characteristics as they were originally defined within the model, and due to the large number of strength 1.0 dependencies to the right of the diagonal would represent a process that involved a great deal of estimation and iteration. Figure 5b represents the sequence of characteristics after optimisation with the objective of minimising the amount of iteration within the process. Three main sequences exist within the process: a characteristic inputting and evaluation sequence from the characteristics depth to consrate; an iterative evaluation sequence from the characteristics pd through to pdb involving the estimation of the characteristics pdb, disp and lwt; and, a final evaluation sequence from the characteristics vol to reqfbd.
[image:8.595.76.524.208.436.2]Figure 6. Optimised sparse matrix.
The design process generated within Figure 5b was used to evaluate the bulk carrier model. The values for the independent characteristics were based upon results obtained by Duffy [1]. The characteristics pdb, disp and lwt, were estimated at 1000 kW, 10 metres and 1000 tonnes respectively enabling the iterative loop between characteristics pd and pdb to be evaluated for the first time. The loop was re-evaluated based upon the newly evaluated characteristics pdb, disp and lwt, of 5285 kW, 12 metres and 5123 tonnes respectively. The initial estimation for pdb and lwt can clearly be seen to be quite far away from the calculated values. The iterative cycle was repeated twice, resulting with pdb, disp and lwt, settling at values of 5168 kW, 11.8 metres and 5117 tonnes respectively. The characteristics and goals were evaluated in the final part of the design process. The Designer system indicated that all goals had been satisfied apart from the Freeboard goal. The approximate value method within Designer was then used to determine a value for the characteristic beam that would satisfy the Freeboard goal – giving beam = 27.5 metres. The design process was repeated including the iterative cycles and the goal evaluation and found to satisfy all of the goals.
5. Conclusions
The DSM has seen considerable use in the planning and management of design projects, however it has rarely been applied as an assistant to the enactment of a design project. This work indicates that the DSM may be used to provide considerable help to the designer in both understanding the design problem, and managing and enacting the design activity with the result of a considerable reduction in the time taken to generate suitable solutions especially in situations where the designer may not have a great understanding of either the Designer software of the associated model. These results are further improved with the use of a Genetic Algorithm to optimise the sequence of characteristics within the matrix with the aim of reducing the amount of iteration within the process, and reducing the time taken to satisfy the design requirements.
6. References
[1] Duffy, A.H.B. and MacCallum, K.J., “Computer Representation of Numerical Expertise for Preliminary Ship Design”, Marine Technology, 26(4), October 1989, pp. 289-302. [2] Eppinger, S.D., Whitney, D.E., Smith, R.P. and Gebala, D.A., “A Model-Based Method
for Organising Tasks in Product Development”, Research in Engineering Design, Springer-Verlag, 1994, 6(1), pp. 1-13.
[3] Gebala, D.A. and Eppinger, S.D., “Methods for Analysing Design Procedures”, ASME Transactions, Design Theory and Methodology, 31, 1991, pp. 227-233.
[4] Goldberg, D.E., Genetic Algorithms in Search, Optimisation and Machine Learning, 1989, Addison-Wesley, Massachusetts, USA.
[5] Kusiak, A. and Park, K, “Concurrent Engineering: Decomposition and Scheduling of Design Activities”, International Journal of Production Research, Taylor and Francis, 1990, 28(10), pp. 1883-1900.
[6] MacCallum, K.J., “Creative Ship Design by Computer”, in Proceedings of the 4th International Conference on Computer Applications in the Automation of Shipyard Operation and Ship Design (ICCAS), Annapolis, USA, 1982.
[7] MacCallum, K.J., “Understanding Relationships in Marine Systems Design”, in Proceedings of the 1st International Marine Systems Design Conference on the Theory and Practice of Marine Design, London, UK, April 1982, pp. 1-10.
[8] Scott, J.A., “A Strategy for Modelling the Design-Development Phase of a Product”, Ph.D. Thesis, Department of Marine Technology, University of Newcastle upon Tyne, UK, 1998.
[9] Steward, D.V., “The Design Structure System: A Method for Managing the Design of Complex Systems”, IEEE Transactions on Engineering Management, 1981, 12(3), pp. 71-74.
[10] Whitfield R.I., Smith J.S. and Duffy A.H.B., “Identifying Component Modules”, in Proceedings of the 7th International Conference on Artificial Intelligence in Design AID’02, Cambridge, UK, 15-17 July 2002.
Robert Ian Whitfield