International Journal of Innovative Technology and Exploring Engineering (IJITEE) ISSN: 2278-3075, Volume-8, Issue-6S4, April 2019
Abstract—Rainfall is a one of the important phenomena of the hydrological cycle; its distribution time to time, varies from one place to another place; and it acts as a source of water to the earth. Indian agriculture and the cropping pattern, with good yield of production, depend on the rainfall during monsoon. According to the IMD, South peninsular region got 40% of rainfall from South-West monsoon and 60% from North-East monsoon. This study aims at understanding the spatial distribution of rainfall and its influences in the hydrological trend of precipitation over the area which is closely linked with flood and drought. For the purpose of evaluation, the rainfall data of 21 stations were collected from statistical department and PWD Ground water division of Cuddalore district during period of 1986 – 2016. After error correction and checking, the general methodology was applied for this study. The collected data and the real time data were matched for the mathematical analysis to find the Mean, Seasonal variation, Coefficient of Variation, Precipitation Ratio. The spatial distribution of rainfall convert as the non spatial data of an attribuutive information in the form of statistics, tabled list, graphs and finally, using the ILWIS software, to find the influence of rainfall over the area were identified and demarcated with maps. The long term rainfall analysis identifies the influence and pattern of spatial distribution of Cuddalore district.
Key words:—Rainfall, Monsoon, Spatial distribution, Hydrological trend.
1. INTRODUCTION
Universally, water is the main commodity playing major role in world economy. The main source of fresh water is rainfall. According to NASA, the most obvious pattern, in the total rainfall maps, is the change in seasons. A band of heavy rain moves North and South of the Equator seasonally. About two-thirds of all rain falls along or near the equator. Rainfall is an important phenomena in the hydrological cycle. It plays a major role in planning of water resource projects, agriculture and other related domains. Tamilnadu is a tropical State in India. Its climate varies from dry sub humid to semi arid. The pattern of rainfall is not a constant as it varies from time to time and place to place. The variability of rainfall alters the cropping pattern. Rainfall is an agro-climatological factor that prevails in the seasonally arid parts of the world and its analysis is an important prerequisite for agricultural planning in India
Revised Manuscript Received on April 12, 2019.
S.Sivaprakasam,Assistant Professor, Department of Civil Engineering, Faculty of Engineering and Technology, Annamalai University, Annamalai Nagar, Tamilnadu, India. ([email protected])
K.Karthikeyan,Assistant Professor, Department of Civil Engineering, Faculty of Engineering and Technology, Annamalai University, Annamalai Nagar, Tamilnadu, India.
N.Nagarajan,Assistant Professor, Department of Civil Engineering, Faculty of Engineering and Technology, Annamalai University, Annamalai Nagar, Tamilnadu, India.
Visalachi, PG student, Department of Civil Engineering, Faculty of Engineering and Technology, Annamalai University, Annamalai Nagar, Tamilnadu, India.
(AlakGadgil - 1986). Hydrologists require timescale, detailed knowledge of the frequency, volume and spatial distribution of the precipitation to assess the local imparts of impending extreme weather events to adapt to climate change (Fowler et.al. 2007). The annual and seasonal rainfall along with its variability has been analyzed for Cuddalore District, Tamilnadu, busing the QGIS software (Sandeep, et. al 2018). The current study focuses attention on the spatial distribution of the rainfall, coefficient of variability and precipitation ratio.
2. STUDY AREA
Cuddalore district is located at the geographical coordinates of 11° 11" to 12° 35" N latitude, 78° 38" to 80° 0" E longitude and altitude is 4.6m MSL. The study area is the Eastern part of Tamilnadu and is surrounded by Villupuram, Nagapattinam and Perambalur on North, South and West respectively and on East by Bay of Bengal as shown in figure 1. The total area is about 36.78 sq. km. The average temperature ranges from 24.4 °C during January to maximum of 32 °C during June. The coastal region of the study area like Parangipettai, Chidambaram, Bhuvanagiri have an altitude of 5-6 m above the MSL. The central regions of the study area have an altitude of 9-10 m above MSL. The minimum altitude is observed in the South and it is found ascending as it moves towards the north. The western regions of the study area have an altitude of about 45m above the MSL.
Figure1 Map of Cuddalore district
Measurement of Spatial Variation of Rainfall
in Cuddalore District using Ilwis
OBJECTIVES
To determine the Coefficient of variation and Precipitation Ratio.
To plot the Spatial distribution map with the help of ILWIS.
To locate and demarcate the abnormality of rainfall area.
[image:2.595.70.273.142.439.2]3. METHODOLGY
Figure 2 Flowchart showing methodology This study has taken 21 rainfall stations and collected a data for 30 consecutive years’ from the PWD during the period of 1986 – 2016. The annual and seasonal variations of rainfall such as summer, winter, North-East Monsoon and South-West Monsoon are analyzed as shown in table1. The Coefficient of Variability and Precipitation Ratio for all the stations, in the study area, have been found and the plot spatial distribution map has been drawn with the help of ILWIS. The ILWIS is a Geographical Information System Software. It was initially developed by researchers in Netherlands. The collected data and maps have been processed using ILWIS. It has been analyzed and interpolated by the method of Kriging in the ILWIS software as shown in figure 2.
Table 1 Various Seasons of Rainfall
SEASON MONTH
Winter January – February
Summer March – May
South-West Monsoon June – September North-East Monsoon October - December
Variability of Rainfall
The Rainfall Variability is the value to express the dependability of rainfall. The lower variability of percentage represents the higher dependability and vice versa. Rainfall
Variability is expressed as the ratio of the standard deviation to the mean rainfall.
CV in % =
Rainfall
Mean
Deviation
Standard
x 100
Precipitation Ratio
Precipitation Ratio resembles the abnormality of rainfall in the area. The higher value represents the higher abnormality, while the lower values show the lower abnormality. Precipitation Ratio is expressed as the ratio of difference between the maximum and minimum rainfall to the mean rainfall.
PR in % = [( Pmax - Pmin ) / Pmean] x 100
Where,
Pmax = Maximum Rainfall in mm
Pmin = Minimum Rainfall in mm
[image:2.595.304.551.311.701.2]Pmean = Mean Rainfall in mm
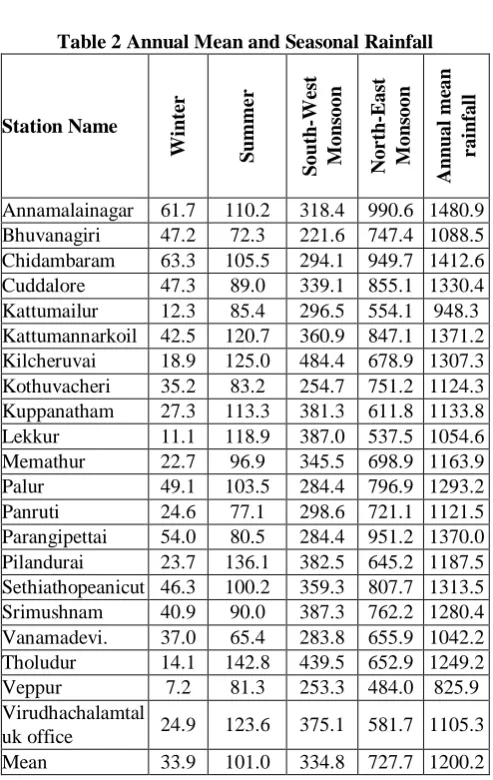
Table 2 Annual Mean and Seasonal Rainfall
Station Name
Wi
n
te
r
S
u
mme
r
S
ou
th
-We
st
M
on
soon
N
or
th
-Eas
t
M
on
soon
A
n
n
u
al
me
an
r
ai
n
fa
ll
Annamalainagar 61.7 110.2 318.4 990.6 1480.9 Bhuvanagiri 47.2 72.3 221.6 747.4 1088.5 Chidambaram 63.3 105.5 294.1 949.7 1412.6 Cuddalore 47.3 89.0 339.1 855.1 1330.4 Kattumailur 12.3 85.4 296.5 554.1 948.3 Kattumannarkoil 42.5 120.7 360.9 847.1 1371.2 Kilcheruvai 18.9 125.0 484.4 678.9 1307.3 Kothuvacheri 35.2 83.2 254.7 751.2 1124.3 Kuppanatham 27.3 113.3 381.3 611.8 1133.8 Lekkur 11.1 118.9 387.0 537.5 1054.6 Memathur 22.7 96.9 345.5 698.9 1163.9 Palur 49.1 103.5 284.4 796.9 1293.2 Panruti 24.6 77.1 298.6 721.1 1121.5 Parangipettai 54.0 80.5 284.4 951.2 1370.0 Pilandurai 23.7 136.1 382.5 645.2 1187.5 Sethiathopeanicut 46.3 100.2 359.3 807.7 1313.5 Srimushnam 40.9 90.0 387.3 762.2 1280.4 Vanamadevi. 37.0 65.4 283.8 655.9 1042.2 Tholudur 14.1 142.8 439.5 652.9 1249.2 Veppur 7.2 81.3 253.3 484.0 825.9 Virudhachalamtal
[image:2.595.45.292.649.725.2]International Journal of Innovative Technology and Exploring Engineering (IJITEE) ISSN: 2278-3075, Volume-8, Issue-6S4, April 2019
[image:3.595.67.269.51.197.2]Figure 3 Spatial map of annual mean rainfall
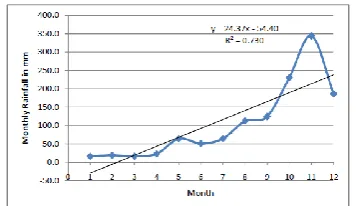
Figure 4 Monthly variation of Rainfall Pattern
Figure 5 Spatial map of winter mean rainfall
[image:3.595.329.518.61.233.2]Figure 6 Spatial map of summer mean rainfall
Figure 7 Spatial map of south-west monsoon mean rainfall
Figure 8 Spatial map of north-east monsoon mean rainfall
4. RESULT AND DISCUSSION
Annual Mean Rainfall
The average monthly rainfall, for the 21 stations under study for a span of 30 years, shows an increasing trend from January to December as shown in figure 4. It reaches the peak during North East Monsoon. The minimum mean is incurred as 825.9 mm at Veppur and Maximum as 1480.9 mm at Annamalai Nagar. The annual mean rainfall of all stations is 1200.2 mm as shown in figure 3 and table 2. The results show the point that all the stations, except Kattumailur and Veppur, experience the high rainfall of more than 1000 mm. The very high rainfall zones (>1300 mm) include Annamalai Nagar, Chidambaram, Kattumannarkoil, Cuddalore, SethiayathopeAnicut, Kilcheruvai and Parangipettai. The high rainfall zones (1200 - 1299 mm) include Srimushnam, Tholudur and Palur. The moderate rainfall zones (1100 - 1199 mm) are Memathur, Kuppanatham, Kothavacheri, Panruti, Pilandurai and Virudhachalamtaluk office. The low rainfall zones (1000 - 1099 mm) are Bhuvanagiri, Lekkur and Vanamadevi. The very low rainfall zones (< 1000 mm) are Kattumailur and Veppur.
[image:3.595.79.258.229.332.2]Mean Seasonal Rainfall
Winter Mean Rainfall
During this period, very low rainfall is recorded which contributes to 2.75% of the total rainfall as shown in figure 5. The minimum and maximum rainfall is recorded at Veppur (7.2 mm) and Chidambaram (68.3 mm) respectively. The annual mean rainfall of this season is 33.9 mm
i. Summer Mean Rainfall
It is a hot weather period. It contributes to 8.42% of the total mean rainfall having the mean of 101 mm as shown in figure 6. The minimum and the maximum rainfall have incurred during this season with 65.4 mm at Vanamadevi and 142.8 mm at Tholudur.
iiSouth West Monsoon Mean Rainfall
During this season, the maximum and minimum rainfall occurred, at Kilcheruvai (484.4 mm) and Bhuvanagiri (221.6 mm) is shown in figure 7. The very high rainfall (>400 mm) is recorded at Kilcheruvai and Tholudur. The high rainfall (300 - 399 mm) occurred at Annamalai Nagar, Cuddalore, Kattumannarkoil, Kuppanatham, Lekkur, Memathur, Pilandurai, Srimushnam, SethiyathopeAnivut and VirudhachalamTaluk Office. The moderate rainfall (200 - 299 mm) occurred at Bhuvanagiri, Chidambaram, Kattumailur, Kothuvacheri, Palur, Panruti, Parangipettai, Vanamadevi and Veppur. This season contributes to 27.9% of the mean annual rainfall. The mean rainfall of this season is 224.8 mm.
iii. North East Monsoon Mean Rainfall
The highest rainfall (>900 mm) occurred at Annamalai Nagar, Chidambaram and Parangipettai. The high rainfall (750 - 899 mm) occurred at Cuddalore, Kattumannarkoil, Kothavacheri, Palur, SethiyathopeAnicut and Srimushnam as shown in figure 8. The moderate rainfall (650 - 749 mm) occurred at Bhuvanagiri, Kilcheruvai, Panruti, Memathur, Vanamadevi and Tholudur. The low rainfall (<650 mm) occurred at Kattumailur, Lekkur, Pilandurai, Virudhachalamtaluk office, Veppur and Kuppanatham. The presence of Bay of Bengal on the eastern side of the study area influences the weather conditions and brings high rainfall to the coastal regions and it is found decreasing as it moves towards the West. The mean annual rainfall of this period is 727.7 mm and it contributes to 60.6% of total the mean annual rainfall.
Variability of Annual and Seasonal Rainfall
Table 3 Annual and Seasonal Rainfall Variability in %
S
tati
on
N
ame
Wi
n
te
r
S
u
mme
r
S
ou
th
-We
st
M
on
soon
N
or
th
-Eas
t
M
on
soon
A
n
n
u
al
me
an
var
iab
il
ity
Annamalainagar 144.32 110.13 35.72 33.07 27.32 Bhuvanagiri 185.66 108.67 53.33 51.61 46.97 Chidambaram 166.55 108.16 38.26 37.25 29.65 Cuddalore 148.78 89.78 35.08 42.54 31.49 Kattumailur 189.43 84.61 49.66 47.19 33.98
Kattumannarkoil 201.93 104.73 50.75 46.38 37.94 Kilcheruvai 204.70 93.56 38.95 51.47 38.04 Kothuvacheri 190.49 106.20 40.79 45.46 35.68 Kuppanatham 164.47 93.92 35.13 49.08 34.49 Lekkur 149.69 70.09 36.83 45.59 32.43 Memathur 223.71 76.11 36.03 43.65 30.51 Palur 186.41 99.44 46.38 45.70 33.59 Panruti 162.43 139.19 58.36 58.42 46.93 Parangipettai 145.19 123.45 43.67 40.90 29.57 Pilandurai 159.25 55.20 35.45 42.43 30.49 Sethiyathopeani
cut 169.59 87.41 28.48 43.11 30.79 Srimushnam 217.57 101.14 50.17 49.70 40.92 Vanamadevi. 203.96 123.29 59.50 58.52 52.28 Tholudur 185.67 71.18 46.45 53.02 38.24 Veppur 211.53 114.36 72.92 63.29 55.23 Virudhachalamt
[image:4.595.303.550.57.565.2]aluk office 170.67 80.31 33.34 49.80 34.72
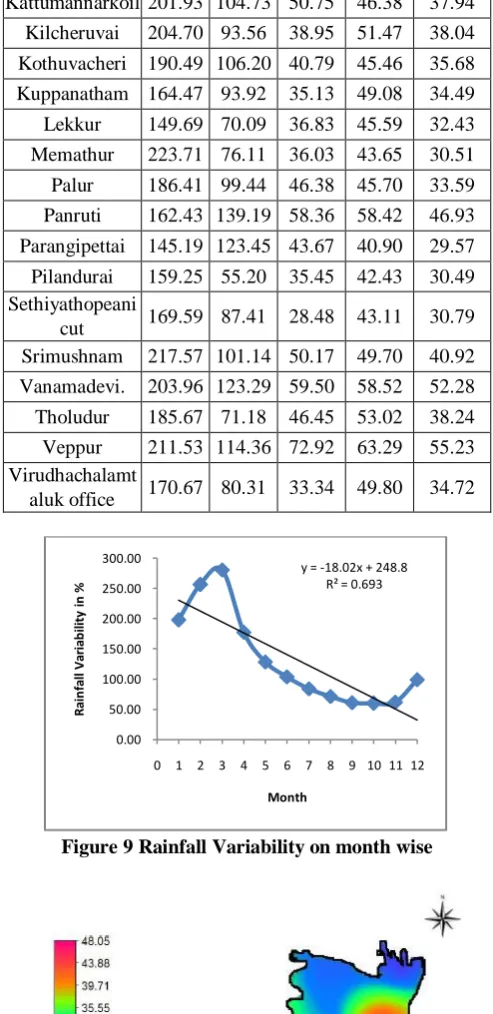
[image:4.595.48.291.653.785.2]Figure 9 Rainfall Variability on month wise
Figure 10 Spatial map of annual mean rainfall Variability
The monthly Rainfall Variability follows a decreasing trend from January to December as shown in figure 9. It reaches the peak during March and takes a decreasing trend
y = -18.02x + 248.8 R² = 0.693
0.00 50.00 100.00 150.00 200.00 250.00 300.00
0 1 2 3 4 5 6 7 8 9 10 11 12
R
ai
n
fa
ll
V
ar
ia
b
ili
ty
i
n
%
International Journal of Innovative Technology and Exploring Engineering (IJITEE) ISSN: 2278-3075, Volume-8, Issue-6S4, April 2019
up to the year end as shown in table 3. The Rainfall Variability varies between 27.31% and 55.22% at Annamalai Nagar and Veppur respectively. The higher dependence is recorded at the South and South Eastern part of the study area as shown in figure 10. The maximum Rainfall Variability is is found occuring during winter season followed by the Summer and North East Monsoon and the minimum is recorded during South West Monsoon. The result indicates the fact that the maximum rainfall is the deciding factor. The dependability is found more during the Monsoon period. The mean Rainfall Variability is 36.72%. For all seasons, it stretches between 223.71% and 33.07%.
[image:5.595.305.546.145.376.2]Precipitation Ratio
Table 4 Station wise precipitation ratio in %
S
tati
on
N
ame
Wi
n
te
r
S
u
mme
r
S
ou
th
-We
st
M
on
soon
N
or
th
-Eas
t
M
on
soon
A
n
n
u
al
me
an
Annamalainagar 667.23 546.98 156.18 154.11 145.72 Bhuvanagiri 750.31 464.73 196.29 169.79 157.93 Chidambaram 655.31 476.90 174.19 162.01 148.03 Cuddalore 618.31 387.91 154.25 190.39 132.72 Kattumailur 852.09 367.81 189.96 207.90 169.15 Kattumannarkoil 1057.11 399.20 214.99 184.17 152.42 Kilcheruvai 891.90 358.29 163.08 211.95 159.15 Kothuvacheri 886.97 371.24 147.61 200.08 159.20 Kuppanatham 608.63 449.88 147.84 189.59 147.32
Lekkur 583.04 350.68 154.40 207.14 144.94 Memathur 1095.02 304.38 157.76 212.63 154.27 Palur 646.17 372.60 176.87 195.38 139.58 Panruti 564.81 588.97 213.56 262.61 194.43 Parangipettai 562.24 514.12 168.80 172.58 157.41 Pilandurai 669.70 274.12 153.73 178.55 133.31 Sethiyathopeani
cut 673.96 389.78 101.94 166.15 131.67 Srimushnam 812.06 367.91 197.80 220.41 182.13 Vanamadevi. 803.45 517.16 275.49 202.07 206.55 Tholudur 718.45 259.12 198.92 249.95 184.35 Veppur 768.51 432.71 233.16 213.41 202.41 Virudhachalamt
aluk office 553.98 403.19 138.70 203.78 142.74 mean 735.20 409.41 176.93 197.84 159.31
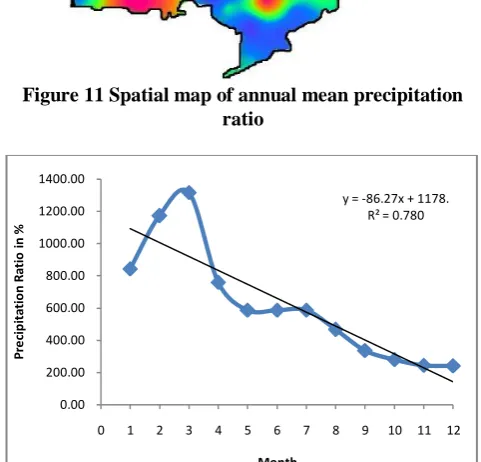
Figure 11 Spatial map of annual mean precipitation ratio
Figure 12 Month wise Precipitation Ratio
It extends between 1095.02mm during winter at Memathur and 101.94 during South-West Monsoon at SethiyathopeAnicut. The maximum abnormality is obtained during the Winter followed by Summer and North East Monsoon periods as shown in figure 11. The minimum is obtained during South West Monsoon and the Precipitation Ratio follows a decreasing trend. The peak is achieved during March as shown in figure 12. The least value or Abnormality is obtained during November month. The maximum and minimum value for all the 21 stations is 206.55 at Vanamadevi and 131.67 at SethiyathopeAnicut. The mean annual Precipitation Ratio is 159.31% as shown in table 4.
5. CONCLUSION
The present study deals with the distribution of rainfall, Coefficient of Variability and Precipitation Ratio at 21 stations chosen for observation in Cuddalore district. It shows the seasonal and annual rainfall pattern. The temporal and spatial distribution of rainfall is vital for planning of water resource projects and other agricultural activities. In general, the study area comprises of 3 zones with respect to the altitude. The region having low altitude receives high rainfall. The middle zone obtains moderate rainfall. The high altitude zone experiences low rainfall.
The results of the analysis depict the inverse relationship between the Rainfall and Rainfall Variability. Low
y = -86.27x + 1178. R² = 0.780
0.00 200.00 400.00 600.00 800.00 1000.00 1200.00 1400.00
0 1 2 3 4 5 6 7 8 9 10 11 12
P
re
ci
p
ita
ti
o
n
R
ati
o
i
n
%
[image:5.595.47.292.219.686.2]Variability indicates the mean rainfall at the given location as reliable, whereas the high variability denotes the wide fluctuations.
Winter Season: During this season, very small amount of rainfall is observed in the western region of the study area. It also shows the higher value of variability and precipitation ratio which represents less dependability and higher abnormality of rainfall.
Summer Season: During this period, no huge difference in rainfall for all the 21 stations is observed. In other words, the rainfall is almost even.
South-West Monsoon Season: This season brings more rainfall on the North- Western part of the study area. The places high altitude experience more rainfall in this season. The middle and Eastern parts get moderate to less rainfall.
North-East Monsoon Season: It is contrast to the South-West Monsoon. It brings more rainfall to all the places of the study area than other seasons, especially, the places low altitude and the areas nearer to sea, experience very high rainfall.
Coefficient of Variability: The moderate dependability of rainfall is simply even among the middle to the Eastern part where the altitude is medium, whereas the high dependability is observed on the South-East region where the altitude is low. The low dependability is experienced in a very few places where the altitude is high.
Precipitation Ratio: Lesser Abnormality is found in the central part of the study region, whereas the Northern and Southern show the maximum abnormality.
REFERENCES
1. Alak Gadagil,1986, Annual and weekly analysis of rainfall
and temperature for Pune: a multiple time series approach. Inst. Indian Geographers. Vol.8 No.1.1986.
2. Alexander.G.,Keshavamoorthy. U Fluctuations of monsoon
activity, Indian J. Meteor. Geophs, 29, 76-87, 1978.
3. Annamali . H and J Slingo, Active/ Break cycles:diagnosis of
the intraseasonal variability of the Asian summer, ClimDn 18-85 102, 2001.
4. Blanford, H.F., Rainfall of india. MemInd Met. Dept., 2
217-448, 1886.
5. Fowler. H., S. Blenkinsop, C.Tebaldi., 2001: Linking Climate
change modeling to impacts studies: Recent anvances in
downscaling techniques for hydrological
modellingJ.Climatol., 27 547-1578.
6. Gadgil., S and P.V.Joseph On breaks of Indian Summer
Monsoon, Proc., Indian Acad. Sci. 112,529 – 558, 2003.
7. Gowsami, B, V.KrishnamooethiH.Annamalai., Abroad scale
circulation index for the interannual variability of the Indian summer monsoon QJRMS 125:611-633, 1999.
8. Kohenen, T., The self organizing Map. Procc
IEEE1464-1480,1990.
9. Krishnamuethi,T and H.N Blamlme Oscillation of monsoon
system Part I Observational Aspects Sci.,33 1937-1954,1976.
10. Malurkar,S.L Notes on analysis of weather of India and
neighborhood, Memoirs of I.Met.DXXVH Part IV, 139-215,1950.
11. Rgavan,K., Break monsoon over India, Mon Wea. Rev.,
101.33-43.,1973.
12. Sandeep. P R. Jegankumar., Assesment of spatial variability