R E V I E W
Open Access
Machine learning for estimation of
building energy consumption and
performance: a review
Saleh Seyedzadeh
1*, Farzad Pour Rahimian
2, Ivan Glesk
1and Marc Roper
3Abstract
Ever growing population and progressive municipal business demands for constructing new buildings are known as the foremost contributor to greenhouse gasses. Therefore, improvement of energy efficiency of the building sector has become an essential target to reduce the amount of gas emission as well as fossil fuel consumption. One most effective approach to reducing CO2 emission and energy consumption with regards to new buildings is to consider energy efficiency at a very early design stage. On the other hand,efficient energy management and smart refurbishments can enhance energy performance of the existing stock. All these solutions entail accurate energy prediction for optimal decision making. In recent years, artificial intelligence (AI) in general and machine learning (ML) techniques in specific terms have been proposed for forecasting of building energy consumption and performance. This paper provides a substantial review on the four main ML approaches including artificial neural network, support vector machine, Gaussian-based regressions and clustering, which have commonly been applied in forecasting and improving building energy performance.
Keywords: Building energy consumption, Building energy efficiency, Energy benchmarking, Machine learning
MAIN TEXT Introduction
Emission of greenhouse gases including carbon dioxide (CO2) in higher layers of the atmosphere are known as
the main cause of global warming phenomena. In UK buildings are responsible for 46 percent of allCO2
emis-sions (Kelly et al.2012). This figure is 40 percent in the USA and 27 percent in Australia (Filippin2000). There-fore, enhancement of energy efficiency of the buildings has become an essential issue to reduce the amount of gas emission as well as fossil fuel consumption. An annual saving of 60 billion Euros is estimated by improvement of European Union (EU) buildings’ energy performance by 20 percent (Li et al.2010).
The attempt to decrease the amount of green-house gases needs significant alteration in human behaviour in energy consumption, manufacturing of more environmental friendly products and identifying
*Correspondence:[email protected]
1Faculty of Engineering, University of Strathclyde, Glasgow G1 1XW, UK Full list of author information is available at the end of the article
and mitigating the causes of these undesirable gases (Abrahamse et al.2007). Therefore, enhancement of tech-niques for construction of more energy efficient buildings and improvement of current buildings’ energy usage seem to be great moves in the reduction of global warming menace.
The first step in enhancement of building energy con-sumption is to calculate this amount using a building energy assessment method which is an informative tool providing a comparative energy performance index to decision makers. Generally, the energy consumption of building during a definite period normalised by floor area is used to express the performance (kWh/m2/period) known
as Energy Performance Indicator (EPI) or Energy Use Intensity (EUI) (Hong et al.2015; Nikolaou et al.2015).
Building energy assessment are separated into four main categories: engineering calculation, simulation model-based benchmarking and statistical modellings and Machine learning (ML). The engineering methodologies employ physical laws for the derivation of building energy consumption in whole or sub-system levels. The most
precise methods apply complex mathematics or build-ing dynamics for the derivation of accurate energy usage for all building components considering internal and external details as the inputs (e.g. climate information, construction fabric, HVAC system). Building energy effi-ciency simulation includes software and computer models for simulation of performance with predefined status. Generally, computer simulation can be used for a vari-ety of applications such as lighting and HVAC system design.Existing of building energy data has allowed usage of top-down methods for assessment of energy perfor-mance. The statistical methods use building historical data and frequently apply regression to model the energy consumption/performance of buildings. These models are also called data-driven surrogate models as they take advantage of existing data instead of relying upon system complex detail. ML as a subset of artificial intransigence provides the ability to learn from data using computer algorithms. The concept of ML is intimately associated with computational statistic. Hence, this method can be also considered as a subcategory of statistical modelling.
This paper reviews state-of-the-art application of ML methods in building energy analysis, estimation and benchmarking by emphasising the advantage and draw-backs, provides the discussion of potential improvement in model efficiency, applications and future recommenda-tions.
First a brief introduction of the motivation and neces-sity of using ML in building energy filed is presented. Then different ML methods are explained in detail and review of model utilisation in building sector is thoroughly discussed, followed by the summary of these modes pro-viding further information of buildings characteristics (case studies). Based on the discussions on different cases and usages a framework for selecting the most appro-priate ML method is proposed. Finally the conclusion is derived to highlight the current challenges in ML and lim-itations of seminal works, and possible research opportu-nities for improving energy prediction and benchmarking using ML.
Motivation
In the last decade, Zero Energy Building (ZEB) has been received huge attention and recognised as the primary design concept for future buildings in most countries (Marszal et al.2011). On the other hand, building energy efficiency retrofit (BEER) of existing stock is considered as the chief energy reduction factor. In the UK and some European countries, the rate of demolition of existing buildings and constructing new ones is very low as 0.1 percent, whilst having new buildings rate of over 1 per-cent. It is estimated that at least 70 percent of existing buildings will be still occupied in 2050 (Bell 2004). It has been discussed that finding a sustainable Building
Energy Efficiency Retrofit (BEER) is very challenging and a decision-making tool is essential to propose appropri-ate retrofit technologies for a specific case (Ma et al.2012; Ascione et al.2016).
In order to facilitate decision-making in selecting suit-able solutions where there are more than one objectives, there have been some methodologies in place which can be classified under the categories of priori and multi-objective optimisation (MOO) approaches (Wang et al. 2014; Ascione et al.2014). Most of the developed methods are simulation-based optimisations in which the optimi-sation algorithms are implemented using a programming language, and the energy-related objectives (energy con-sumption or gas emission) are calculated by a Building Performance Simulation (BPS) tools such as EnergyPlus (Crawley et al.2001), TRNSYS (University of Wisconsin-Madison2015), ESP-r (The Energy Systems Research Unit (ESRU)2011), etc. This approach limits the computation complexity of the algorithm to BPS’s calculation time, in essence when a large number of solutions are defined the process may become extremely costly to handle. This time overhead is the main reason that most related studies have only investigated simple models or retrofitted only one or two parts of the studied envelopes. For the same rea-son, most of the studies targeted residential buildings, and there are only few reports on optimisation of retrofitting commercial properties (Smarra et al.2018).
When performed in the early design stages, enhance-ment of energy efficiency of new stock is more flexible than improving existing buildings, since the structural limitations are far less in new built. Yet, it still requires an enormous amount of simulation, if an optimisation algo-rithm is utilised. A practical solution to address the design and BEER issues is the development of a data-driven (surrogate) model using historical data. In this method collocated building data (structural characteristics and cli-mate data) is used to predict energy parameters of new samples by applying a learning process.
The application of data-driven models is not limited to only BEER and ZEB design, they are useful tools for optimisation of Energy Management System (EMS) and Heating, Ventilating, and Air Conditioning systems (HVAC) and even a better alternative for traditional build-ing energy benchmarkbuild-ing and ratbuild-ing schemes (Dounis and Caraiscos2009; Gao and Malkawi2014; Deb et al.2016).
fault detection (Magoulès et al.2013; He et al.2011; Liang
and Du 2007), potential energy efficiency options and
calculation of achieved energy savings. The suitable sta-tistical model is required to learn from flowing data and maintain its accuracy continuously (Yang et al.2005).
Similarly, accurate estimation of heating and cooling load is the foundation of successful design of HVAC sys-tem which leads to reduced operational cost (through saving an amount of energy consumption by end users). Besides, in air-conditioned buildings employing thermal energy storage, this kind of prediction is vital for optimis-ing the system. Kalogirou (Kalogirou et al.2001) indicated that calculation of loads, especially in non-domestic build-ings, is expensive and time consuming for consulting firms. Hence, an alternative solution is required to effi-ciently operate the HVAC systems, which also can facil-itate comfortable temperature and humidity conditions (Kumar et al.2013). Furthermore, advance forecasting of electricity loads allows determination of excessive usage periods, reduced peak demand and a load of electrical HVAC system.
Short-term energy estimation of individual cases only considers climate information (temperature, humidity of solar radiation), however, the precise prediction of build-ing energy consumption and efficiency becomes a chal-lenge when various affecting features such as structural characteristics (e.g. insulation, glazing, window to wall ratio and orientation), occupancy, appliances, variety of loads, operation hours etc. are taken into account (Zhao and Magoulès2012b; Ahmad et al.2014).
In order to highlight the importance of building energy efficiency and increase the public awareness and motiva-tion, in some countries, buildings are assigned by energy labels or ratings (Chung2011). In the majority of bench-marking schemes, BPS is the critical tool for evaluating building energy performance and then it is compared with a reference building. Hence, a similar issue as mentioned earlier applies in this case as well. Moreover, an expert engineer and building complex building characteristics are required to produce reliable outcomes. Learning mod-els seem to have a promising application in benchmarking as they have the ability to extract the patterns underly-ing in various features of buildunderly-ing data sets, which can be used for smart classification of buildings and determi-nation of realistic reference point for different classes. In addition, they can learn from previous samples to estimate the rating or label of future cases.
Classification can even provide a foundation for evalu-ation of a specific feature impact in energy loads by first grouping samples based on unrelated (to the intended feature) variables. This method is very beneficial where analysing the impact a parameter such as occupancy behaviour becomes intricate using traditional mathemati-cal or simulation modelling (Yu et al.2011).
The suggested methodologies use statistical techniques to predict and evaluate energy performance based on col-lected data from building/s and environment and involve a kind of regression to model the energy characteris-tics. Simple and multivariate regression (MLR) are among widely used models that relate energy consumption to one or more variables (Hygh et al.2012). Change-point regression method is also modelled based on the non-linear impact of parameters that are mainly applied when buildings show a strong correlation between operation time and loads (Ruch et al.1993). Data envelopment anal-ysis (Mousavi-Avval et al. 2011) and stochastic frontier
analysis (Kavousian and Rajagopal 2014) are among the
mathematical model applied in this field.
By considerable growth in the amount of valid and attainable dataset of buildings, there is an excellent inter-est in the utilisation of Artificial Intelligent (AI) methods specifically ML in the construction sector. Moreover, it is indicated that in order to conduct successful projects it is essential to learn and adopt novel technologies in the filed (Pour Rahimian et al.2014). The most applied ML tech-niques in this field are Artificial Neural Network (ANN), Support Vector Machine (SVM), Gaussian distribution regression and clustering.
Review
ML is generally used to describe a computer algorithm that learns from existing data. These algorithms typically use a considerable amount of data and relatively small number of input features for the learning process. In recent years, numerous ML techniques have been pro-posed in building sector for estimation of heating and cooling loads, energy consumption and performance for various circumstances.
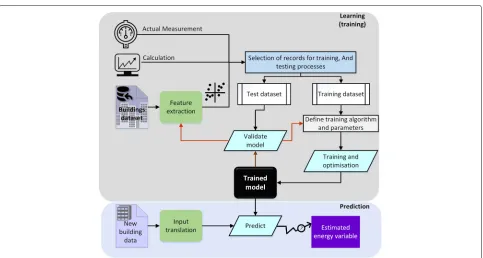
ML models operate as a black box and need no infor-mation on building systems. They discover the relation between various input features and output targets (e.g. energy performance) using given data. When the ML models are trained with enough amount of data, they can be used to predict targets for unseen samples, though the relation between the features and the targets is not defined. This procedure is also known as supervised learning in ML field. In this case, the targeted energy parameter is calculated using simulation (in general engi-neering method) or measured and used for training the model. The general scheme of supervised learning for modelling building energy is illustrated in Fig.1.
Fig. 1General schematic diagram of supervised learning
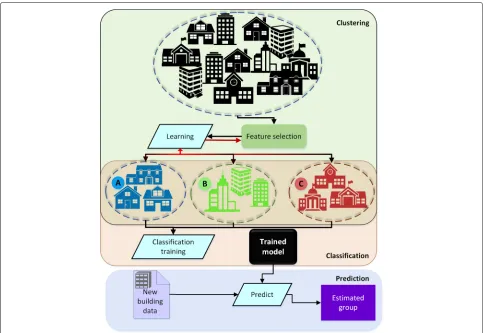
a determination of baseline buildings is crucial for cal-culating the energy performance of similar cases. Hence, the clustering algorithms provide more precise tools for grouping various building in comparison with traditional method where mainly relay on building usage type. It should be noted that using the clustering algorithm for forming groups it is not possible to estimate clusters for new buildings. Hence, for the purpose of determining the reference building for other cases, an extra supervised ML technique should be applied. In this approach, all build-ings employed for clustering are used as training samples for classification where the generated labels from cluster-ing are considered as learncluster-ing targets. The flowchart of the overall procedure is demonstrated in Fig.2.
Various measurements based on actual and predicted results are calculated, in order to evaluate the perfor-mance or accuracy of data-driven models. These include Coefficient of Variance (CV), Mean Bias Error (MBE), Mean Squared Error (MSE), Root Mean Squared Error (RMSE), Mean Squared Percentage error (MSPE), Mean Absolute Percentage Error (MAPE) and MAE (mean abso-lute error). CV is the variation of overall prediction error concerning actual mean values. MBE is used to determine the amount over/underestimation of predictions. MSE and MSPE is a good inductor of estimation quality. MAE determines the average value of the errors in a set of fore-casts and MAPE is the percentage of error per prediction. RMSE has the same unit of actual measurements.
Three main techniques that have widely used in the building sector for supervised learning are ANN, SVM and Gaussian distribution regression models. K-means and hierarchical clustering methods have also utilised for unsupervised learning purposes. These methods are dis-cussed in detail in the following sections, and a summary of other ML techniques is presented subsequently.
Artificial neural networks
Neural networks have been broadly utilised for building energy estimation and known as the chief ML techniques in this area. They have successfully used for modelling non-linear problems and complex systems. By applying different techniques, ANNs have the capability to be immune to the fault and noise (Tso and Yau2007) while learning key patterns of building systems.
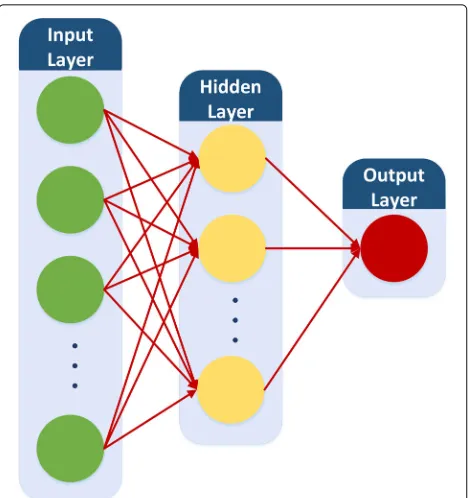
The main idea of the ANN is obtained from the neuro-biological field. Several kinds of ANN have been proposed for different applications including, Feed Forward Net-work (FFN), Radial Basis Function NetNet-work (RBFN) and recurrent networks (RNN). Each ANN consists of multi-layers (minimum two multi-layers) of neurons and activation functions that form the connections between neurons. Some frequently functions are linear, sigmoid ad hard limit functions (Park and Lek2016).
[image:4.595.57.540.82.340.2]Fig. 2Diagram of clustering buildings for energy benchmarking
in the network. Figure3illustrate a general structure of FFN with input, output and one hidden layer.
RNN uses its internal memory to learn from preced-ing experiences by allowpreced-ing loops from output to input nodes. RNNs have been proposed in various architec-tures including fully connected, recursive, long short-term memory, etc. This type of neural network usually employed to solve very deep learning tasks (i.e. more than 1000 layers are needed) (Pérez-Ortiz et al.2003; Gers and Schmidhuber2000).
In RBFM, a radial basis function is exerted as an activation function providing a linear combination of inputs and neuron parameters as output. This type of network is very effective for prediction of time series estimation (Harpham and Dawson2006; Leung et al.2001; Park et al.1998).
Based on the application and complexity of the task, a structure is decided, and by feeding the adequate amount of records, the activation function updates the weights and bias.
In building sector, ANN models have been applied for fast estimation of heating and cooling loads (Aydinalp et al. 2004; Li et al. 2009b; Alam et al. 2016), energy
consumption (Karatasou et al. 2006; Hong et al. 2014a; Ferlito et al. 2015), energy efficiency (Cheng and Cao
2014; Zhang et al. 2015a; Ascione et al. 2017) and
space heating (Mihalakakou et al. 2002; Aydinalp et
al. 2004). Several successful application of ANN for
Automated Fault Detection and Diagnostics (AFDD) in
building energy conservation (Magoulès et al. 2013),
solar water heater (Kalogirou et al. 2008; He et al.
2011) and HVAC system (Du et al. 2013) have been
reported. ANN is also applied in building management systems to provide automatic energy consumption con-trol (Kalogirou2000; Benedetti et al.2016), optimisation of heating system (Yang et al. 2003; Ahn et al. 2017)
and comfort management (Yang and Wang 2013;
Huang et al.2015).
In 1995, an early study on the application of ANN in prediction of energy consumption using simple FFN model was performed to forecast electric energy usage of a building in tropical climate based on the occupancy
and temperature data. Mena et al. 2014 use ANN for
[image:5.595.57.544.85.418.2]Fig. 3Conceptual structure of feed forward neural network with three layers
on electricity consumption. Mihalakakou et al.2002used FFN and RNN for prediction of hourly electricity energy consumption in a residential building located in Athens. The models consider meteorological variables including air temperature and solar radiation using time series data gathered over six years. Gonzales & Zamarreno2005 esti-mated short-term electricity energy consumption using a feedback ANN. Effect of the number of neurons in hid-den layers, the best size of data windows and the ANN parameters on the accuracy of the model is investigated.
Li et al. 2015 proposed an optimised ANN for
predic-tion of hourly electricity consumppredic-tion using partial swarm optimisation (PSO) algorithm. PCA is used to remove unnecessary input variables obtained from two datasets: ASHRAE Shootout I and Hanzou library building.
Platon et al. 2015 applied principal component analy-sis (PCA) to investigate the pre-input variables of ANN in the prediction of hourly electricity consumption of an institutional building. Results from comparison of ANN and case-based reasoning (CBR), reveals that the ANN is superior in term of accuracy. However, as CBR provides more transparency than the ANN and the capability to learn from small data, it can be an alternative approach for complex systems dependent on more variables. Li et al. 2015proposed an optimised ANN for prediction of hourly electricity consumption using partial swarm optimisation (PSO) algorithm. PCA is used to remove unnecessary input variables obtained from two datasets: ASHRAE Shootout I and Hanzou library building.
Yalcintas (Yalcintas and Ozturk 2007; Yalcintas 2006) used ANN for energy benchmarking in tropical climate contemplate weather and chiller data. The selected build-ing includes office, classroom, laboratory-type buildbuild-ings, or mixed-use buildings. The accuracy of EUI prediction is compared with multiple linear regression methods
showing a remarkable advantage over it. Hong 2014a
applies ANN and statistical analysis for energy perfor-mance assessment of primary and secondary schools located in the UK by estimating electrical and heating consumption. By comparison of results with DEC bench-marks, it is shown that the ANN is more accurate for the energy assessment. It is concluded that the statistic benchmarks required further advancement and considerations (e.g. number of students and density of the schools) to provide better evaluations in this sector. However, it has been shown that ANN predic-tion is not as precise as simulapredic-tion and engineering calculations.
Wong et al.2010used ANN for assessing the dynamic
energy performance of a commercial building with day-lighting in Hong Kong. EnergyPlus software along with algorithms for calculation of interior reflection is applied to generate the building daily energy usage. Nash–Sutcliffe Efficiency Coefficient (NSEC) is used as the primary measurement to investigate ANN accuracy in predict-ing coolpredict-ing, heatpredict-ing, electric lightpredict-ing and total electricity consumption.
ANN can be used for determination of parameters for energy performance assessment of buildings. Lundin et al. 2004proposes a method for prediction of total heat loss coefficient, the total heat capacity and the gain factor that are key elements in the estimation of energy efficiency. Buratti et al.2014employs ANN as a tool for evaluation of building energy certificates accuracy using 6500 energy labels in Italy. The study investigates a different combina-tion of input variables to minimise the number of training features. Using the outcome of the ANN, a new index is proposed to check the accuracy of declared data for energy certificates with a low error of 3.6%.
Hong et al. 2014 applied ANN for benchmarking of
schools buildings in the UK and investigate the limita-tions of the assessment. An extensive database including 120000 DEC records is used for training and testing the
model (Hong et al. 2014b). Reviewing outcomes of the
research and comparison with bottom-up models, authors suggest the combinational use of top-down and bottom-up methods to achieve higher accuracy.
[image:6.595.57.291.85.334.2]Ascinoe et al. 2017 proposed an ANN for evaluation of energy consumption and inhabitants’ thermal comfort to predict energy performance of the building. Energy assessment of the buildings are performed using Energy-Plus software, and a simulation-based sensitivity/ uncer-tainty analysis is proposed for further improvement of network parameters. New buildings and retrofitted stock in presence of energy retrofit measures are considered separately. For the latter case, ANN is employed for opti-misation of retrofit parameters. For the first one, three single output ANN is developed to predict primary energy consumption of space heating and cooling and the ratio of yearly discomfort hours by setting whole-building param-eters as network inputs (i.e. geometry, envelope, operation
and HVAC). At the same time, Beccali et al. 2017
pro-pose the use of ANN fast forecasting as a decision sup-port tool for optimising the retrofit actions of buildings located in Italy.
Kalogirou & Bojic (Kalogirou and Bojic2000; Kalogirou 2000) applies RNN to predict hourly energy demand of a passive solar building. ZID software has been employed to calculate the output target. Although results demon-strate high accuracy of estimation, the number of input features (season, insulation, wall thickness and time of the day) and total training records (forty simulated cases) are insufficient. Later in 2001, Kalogitrou (Kalogirou et al. 2001) applies ANN for estimating the daily heat loads of model house buildings with different calumniations of the wall (single and double) and roof (different insulations) types using a typical meteorological data for Cyprus. In this study, TRNSYS software was used as an energy eval-uation engine for all cases and the data validated by comparison of one building energy consumption with the
actual measurement. Karatasou et al. 2006 develops an
FFN model for hourly prediction of energy loads in res-idential buildings. The impact of various parameters on the accuracy of a trained model is also investigated, and it is shown that parameters such as humidity and wind speed are less significant and can be eliminated from training features. Furthermore, the application of statisti-cal analysis for enhancement of ANN model and 24 hours ahead prediction of energy consumption is demonstrated. These methods consist of hypothesis testing, informa-tion criteria and cross-validainforma-tion in pre-processing and model development. However, there is less enlightenment about the main distinctions of applied FFN models. In
2010, Dombayci (Dombayci2010) used ANN to
predic-tion hourly energy consumppredic-tion of a simple model house based on Turkish standards. The degree-hour method is applied to derive the hourly energy consumption to be used in ANN training. The models are suitable for single building energy management of simple residential buildings as it does not take many characteristics into account.
Kialashaki & Reilsel 2013 compared an ANN with
MLR for estimation of the US domestic buildings energy demand. Seven independent variables (population, gross domestic product, house size, median household income, cost of residential electricity, natural gas and oil) as selected from different data sources (1984–2010) to rep-resent the building characteristics. Antanasijevic et al.
2015compare ANN with multiple linear and polynomial
regression models for forecasting the energy consump-tion and energy-related greenhouse gas emission using building data from 26 European countries. The results show 4.5% improvement in term of ANN accuracy (mean absolute percentage error) in both cases.
Neto & Fiorelli 2008 compared predicted energy
demand of a building in Brazil using ANN model and sim-ulation software, EnergyPlus. The research investigates the impact of using hidden layer showing an insignifi-cant difference in accuracy of the models. Furthermore, it reveals that external temperature is more important than humidity and solar radiation in estimating energy con-sumption of the study case. The authors show that ANN is more accurate that detailed simulation model, especially in short-term prediction. They conclude that improper assessment of lighting and occupancy would be the main reason for uncertainty in engineering models. Popesco
et al. 2009 developed an original simulation and
ANN-based models for predicting hourly heating energy demand of buildings connected to district heating system. Climate and mass flow rate variables of prior 24h are used as inputs. Deb et al.2016also used five previous day’s data as ANN model inputs to forecast daily cooling demand of three institutional buildings in Singapore.
Olofsson & Anderson 2001 predicated daily heating consumption of six building family in Sweden constructed in the 1970’s. The building went through the retrofitting in the early 1990’s, and the measurements were performed before and after the renovation procedure. ANN makes an accurate long-term prediction of energy demand based on short-term measured data. PCA is also applied to reduce the number of input features to four (i.e. construction year, number of floors, framework, floor area, number of inhabitants and ventilation system). Ekici & Aksoy2009 used back-propagation ANN to predict heating loads of three different buildings by taking climate information into account. Heating energy demand of the sample build-ings is calculated using a finite difference approach of transient state one-dimensional heat conduction problem.
Paudel et al. 2014 used dynamic ANN to predict
heat-ing energy consumption focusheat-ing on buildheat-ing occupancy profile and operational short-term heating power level characteristics.
Ben-Nakhi 2004 used a general RNN for prediction
thermal energy storage. Data from a public office build-ing in Kuwait constructed from 1997 to 2001 is used for training and testing the ANN model. Energy consump-tion value of buildings is calculated using ESP-r simulaconsump-tion software and considering climate information, various densities of occupancy and orientation characteristics. The results show that ANN only needs external temper-ature for accurate prediction of cooling loads, whereas simulation software demand for intricate climate detail.
Hou et al. 2006 predicted hourly cooling loads in
an air-conditioned building integrating rough set the-ory and ANN. Input features of ANN are determined and optimised by analyses relevant parameters to cool-ing load uscool-ing rough set theory. The proposed model with different combinations of input sets is compared with the autoregressive integrated moving-average model
all showing better accuracy. Yokoyama et al. 2009 used
back-propagation ANN to predict cooling load demand by introducing a global optimisation method for the improvement of network parameters. The effect of the number of hidden layers and the number of neurons in each layer is investigated to optimise the accuracy of the proposed ANN.
Yan & Yao2010has proposed an investigation of the cli-mate information effect on energy consumption in various climate zones. Back-propagation ANN is used to predict heating and cooling load to assist new building designs. Later, Biswas et al.2016applied the similar approach on residential sector and demonstration houses in the USA using Matlab toolbox.
Aydinalp et al. 2002 models the Appliance, Lighting
and space Cooling (ALC) in residential buildings located in Canada. ANN for prediction of energy consumption shows better accuracy in comparison with engineering calculation methods. Later, they used ANN to predict Space heating and domestic hot water for the same build-ings (Aydinalp et al.2004).
Azadeh et al. (Azadeh and Sohrabkhani 2006; Azadeh
et al. 2008) demonstrate the application of ANN based
electricity consumption prediction model in the manufac-turing industry. The model is used to predict the annual long-term consumption of industries in Iran using a mul-tilayer perception model. The results compare with the traditional regression model using ANOVA and show superiority for the application. Later in 2014, (Kialashaki 2014) foretasted energy demand of the industrial sector in the US considering gross domestic and national products and population.
Support vector machine
SVMs are highly robust models for solving non-linear problems and used in research and industry for regression and classification purposes. As SVMs can be trained with few numbers of data samples, they could be right solutions
for modelling study cases with no recorded historical data. Furthermore, SVMs are based on the Structural Risk Minimisation (SRM) principle that seeks to minimise an upper bound of generalisation error consisting of the sum of training error and a confidence level. SVMs with ker-nel function acts as a two-layer ANN, but the number of hyper-parameters is fewer than that. Another advantage of SVM over other ML models is uniqueness and globally optimality of the generated solution, as it does not require non-linear optimisation with the risk of sucking in a local minimum limit. One main drawback of SVM is the com-putation time, which has the order almost equal to the cube of problem samples.
Suppose every input parameter comprises a vectorXi
(i denotes theith input component sample), and a cor-responding output vectorYithat can be building heating loads, rating or energy consumption. SVM relates inputs to output parameters using the following equation:
Y=W·φ(X)+b (1)
where φ(X) function non-linearly maps X to a higher
dimensional feature space. The bias, b, is dependent of selected kernel function (e.g.b can be equal to zero for
Gaussian RBF).Wis the weight vector and approximated
by empirical risk function as:
Minimise: 1
2W
2+C1
1 N
i=1
Lε(Yi,f(Xi)) (2)
Lεisε-intensity loss function and defined as
Lε(Yi,f(Xi))=
|f(x)−Yi| −ε, |f(x)−Yi| ≥ε
0, otherwise (3)
Here ε denotes the domain of ε-insensitivity and N is
the number of training samples. The loss becomes zero when the predicted value drops within the band area and gets the difference value between the predicted and radius
ε of the domain, in case the expected point falls out of that region. The regularised constantCpresents the error penalty, which is defined by the user.
SVM rejects the training samples with errors less than the predeterminedε. By acquisition slack variablesξ and
ξ∗
i for calculation of the distance from the band are, Eq. (3) can be expressed as:
Minmise:
ξ,ξi∗,W,b
1
2W
2+C1 N
N
i=1
subject to ⎧ ⎨ ⎩
Yi−W·φ(xi)−b≤ε+ξ W·φ(xi)+b−Yi≤ε+ξi∗
ξ ≥0, ξi∗≥0
(5)
The SVM problem using a kernel function ofK(Xi,Xj) (αi,αi∗as Lagrange multipliers) can be simplified as:
Maximise:
{αi},{αi∗}
−ε
N
i=1
α∗i +αi
+ N
i=1 Yi
αi∗−αi
− 1
2sum
N i=1
N
j=1
αi∗−αi
αj∗−αj
KXi,Xj
(6)
subject to
N
i=1
α∗i −αi
=0, 0≤αi,αi∗≥C (7)
In building sector, SVM has been used for forecasting of cooling and heading loads (Li et al.2009a; 2009b; Hou and Lian2009), electricity consumption (Dong et al.2005; Xing-ping and Rui2007), energy consumption (Lai et al. 2008; Li et al. 2010; Zhao and Magoulès2010; Jung et al.2015), and classification of energy usage of buildings (Li et al.2010).
In 2005, at first in building sector SVM was applied for estimation monthly electricity usage for non-domestic building in tropical country of Singapore (Dong et al. 2005). In this study, Dong et al. considers three input parameters including temperature, humidity and solar radiation and targets four different buildings. The data is collected over three years and used for training and testing the developed model. Results of using RBF kernel indicates that SVM model has excellent accuracy in pre-dicting the electrical loads and the low error rate of 4%. The conclusion declares the superiority of SVM over pre-viously derived ANN models in terms of selection of small model parameters and accuracy. This initial worked was followed by Lai et al.2009aapplying SVM for forecasting monthly and short-term (i.e. daily) prediction of electric-ity consumption of a domestic building located in Japan. They used outdoor, living and bedroom temperature and humidity as well as water temperature as input parameters and collected electricity usage data over a year. Massana
et al.2015compare SVM, ANN and MLR in short-term
prediction of non-domestic buildings’ electricity demand and conclude that SVM provide higher accuracy and lower computational cost.
Later in 2010, Li et al. 2010 used SVM for long-term
prediction (yearly) of electricity consumption of domestic buildings. They consider fifteen building envelope param-eters collected from 59 different cases along with the
annual electricity consumption which is normalised by unit area. Besides, they compare the accuracy of the SVM model with three types of ANNs including propagation, RFB and general regression. Testing the trained model over 20% of study cases provides results that show SVM
outperforms ANNs for all samples. Solomon et al.2011
predict weekly electricity consumption of a massive com-mercial building considering previous electricity usage, temperature data and wind velocity.
In addition, Li et al.2009bapply SVM to forecast hourly cooling leads of an office building located in China. They use three similar input parameters which were used by Dong et al.2005and collected from local climate database. The target samples are gathered during summer and one month used for training and four months for testing the model. In the meantime, they present a comparison with ANN models and indicate that SVM and general regres-sion ANN have more potential to be used in the field. Hou & Lian (Hou and Lian2009) examine the accuracy of SVM with an autoregressive integrated moving average based model (MacArthur et al.1989) and demonstrate the supremacy of SVM regarding maximum and minimum error values. Xuemei et al.2009developed a model based on Least Square SVM (LS-SVM) and used the same input parameters. This approach contributes to learning cor-rection for limited training sets and enhanced prediction time efficiency to traditional SVM model in load forecast-ing. Jinhu et al.2010 and Li et al.2010 apply improved PCA to find the significant parameters and show better accuracy. However, the information about original and selected features are missing. The further improvement of similar SVM based cooling load prediction has been demonstrated using a fuzzy C-mean algorithm for clus-tering samples (Xuemei et al.2010), simulated annealing particle swarm optimisation to prevent premature conver-gence (Li et al. 2010) and Markov chains to the farther forecast of the interval after primitive prediction (Zhang and Qi2009).
Zhao & Magoules2010predicted energy consumption of office building using parallel implementation of SVM. They aim to optimise the building characteristics of a model case. They utilised EnergyPlus software to calculate the energy demands. The results show a slight improve-ment regarding accuracy. Later in 2012, the authors apply gradient guided feature selection and the correlation coef-ficients methods to decrease the number of features for RBF and polynomial based SVM models (Zhao and Magoulès2012a).
model is obtained when hourly intervals collected at floor level is utilised. Edwards et al.2012present a comparison of SVM, LS-SVM and ANN in forecasting hourly energy consumption of small residential buildings and find ANN as the least accurate model.
Gaussian process and mixture models
Since early 2000, Gaussian process (GP) regression has been employed by researchers in different application (Jiang et al. 2010; Grosicki et al. 2005; Bukkapatnam and Cheng2010). In building energy field, GP has been recently utilised due to its potentiality in determining the uncertainty of predictions. In building energy modelling, there are usually uncertainties in the section of appropri-ate values for some characteristics (e.g. envelope insula-tion). Hence, evaluation of input uncertainty on foretasted results has made the GP as an alternative approach to model building energy rather than conventional and other ML regression models. The main drawback of GP mod-elling is expensive computational cost, especially with the increase of training samples. This high cost is due to the fact that GP constructs a model by determining the struc-ture of a covariance matrix composed ofN×Ninput vari-able where the matrix inversion required in predictions has a complexity ofON3
Given a set of n independent input vector Xj
(j = 1,· · ·,n), the corresponding observations of yi (i = 1,· · ·,n) are correlated using covariance functionK with normal distribution equal to (Li et al.2014):
P(y;m;k)= 1
(2π)n/2|K(X,X)|1/2
×exp
−1 2(y−m)
TK(X,X)−1(y−m)
(8)
The covariance or kernel function can be derived as
K=
k(x1,x1) k(x1,x2) · · · k(x1,xn) k(x2,x1) k(x2,x2) · · · k(x2,xn)
..
. ... . .. ...
k(xn,x1) k(xn,x2) · · · k(xn,xn)
(9)
A white noise,σ, is presumed in order to consider the uncertainty. It is assumed that the samples are corrupted (lets suppose as new inputs asx∗) by this noise. In this case covariance ofyis expressed as
cov(y)=K(X,X)+σ2 (10)
Theny∗can be estimated as below.
y∗= n
i=1
αik(xi,x∗) (11)
αi=
K(X,X)+σ2I−1yi (12)
A Gaussian Mixture Model (GMM) is parametric prob-ability density (PDF) function which is expressed as (Reynolds2015):
p(x,y)= K
k=1
πkp x,y|μk,
k
(13)
here πkp
x,y|μk,k
is PDF of K Gaussian
compo-nents and μk is the mean function of kth component.
For regression proposes the multivariate non-linear func-tion from the model is derived. Indeed, Gaussian mixture regression constructs a series of Gaussian mixture to unite the density of data and calculate regression function for each model as presented in Eq.13.
Heo (Heo et al. 2012; Heo and Zavala 2012) applies
GP model to calculate the building energy saving after retrofitting by forecasting the total energy consumption. The model uses outside temperature, relative humidity, and occupancy count as an input variable and considers output measurement errors to approximate uncertainty levels. Later in 2013, Zhang et al. 2013 use GP regres-sion for predicting the energy demand of an office building cooling and heating in the post-retrofit phase. They show that the accuracy of the GP model is very dependant on training and testing data range.
Noh & Rajagopal 2013 propose a long-term GP
pre-diction model for total energy consumption of a campus building using smart meter measurements and weather data. Nghiem & Jones2017propose a GP based model for demand response service by predicting building energy consumption. Rastogi et al.2017compare the accuracy of GP and linear regression in emulating of a building perfor-mance simulation and show that the accuracy of GP is four times better than linear regression testing on EnergyPlus simulated case studies located in the US.
Burkhart et al.2014 integrate GP with a Monte Carlo
expectation maximisation algorithm to train the model under data uncertainty. The aim is to optimise office building HVAC system performance by predicting its daily energy demand. Relative humidity and ambient tem-perature are considered as specific input variables and daily occupancy with two different scenarios (moderate and vigorous) as uncertain data. The results indicate that the models can be trained even with limited data or sparse measurements employing rough approximation and data range instead of sensor data.
Manfren et al. 2013 develop a method for calibration
model. They used detailed simulation, GP with RFB ker-nel and MLR to predict monthly electricity and gas usage of heating and cooling systems. The results indicate that GP not only provides a tool for optimisation and uncer-tainty analysis of building energy models but also shows higher accuracy in comparison with a piece-wise regres-sion model.
Sirvastav et al. 2013 employ GMM to predicts
daily/hourly energy consumption of commercial buildings (a DOE reference model for supermarket and a retail store building). This parametrised model allows locally adaptive uncertainty quantification for building data.
Zhang et al.2015bcompare change-point models, GP,
GMM and FF-ANN models for prediction of an office building’s HVAC system hot water energy usage consid-ering weather data (ambient dry bulb temperature) as an input variable. The ANN utilised in this work has one hidden layer activated using tangent sigmoid transfer function. The results show that the best performance is achieved using GMM and the worst by ANN. The authors conclude that as the ANN is not fed by adequate data, it is not a suitable model for the case study. Although the accuracy of GMM and GP is slightly better than the change-point regression, the later is recommended due to the simplicity of the approach. It should be noted that the Gaussian methods are the best choice for analysing uncertainty and capturing complex building behaviour.
Clustering algorithms
Clustering is one of the well-known ML techniques that identifies implicit relations, patterns and distributions in data sets. Clustering is an unsupervised learning method that can describe the hidden structure in a collection of unlabeled data. In building energy, the primary applica-tion of this technique is to classify buildings using various features and characteristics instead of only use type or topology is very advantageous in building energy bench-marking. Clustering for such an application implicates four steps (Gao and Malkawi2014): (a) data collections, (b) feature identification and selection, (c) adaptation of appropriate clustering algorithm and (d) benchmarking each building within classified groups. The most com-mon clustering algorithm is k-means that iteratively seeks for a local maximum. The algorithm begins with a ran-dom selection ofkcentroids (centre of cluster), and each data is assigned to the nearest centre point. Then all cen-troids are recalculated using the mean of all data points in a group. This process continues until it satisfies a stop-ping criterion (e.g. a minimum aggregation of distances is reached).
Targeting 320 schools in Greece, Santamouris et al.2007 propose a building energy classification method using fuzzy clustering (Gath and Geva1989). Total energy con-sumption (heating and electricity) over three years along
with information on operating hours, number of pupils, structure characteristics, etc., are collected. By applying a clustering algorithm, five building energy rating classes are determined. The clustering based classification is then compared to similar frequency rating process indicating that clustering offers more robust classes resolving the problem of low and unbalanced or very large class con-stitution. The authors apply outcomes to ten study cases to investigate the potential energy conservation. Gaitani et al.2010use 1100 school samples for the development of a framework for heating energy consumption rating, aiming at evaluation of potential energy savings. A k-mean clustering incorporating PCA algorithm is utilised to form five rating classes and determine representative building of each cluster. Pieri et al.2015propose a cluster-based energy audit considering cooling and heating loads of hotels in Greece.
Gao & Malkawi2014demonstrate that energy perfor-mance benchmarking using clustering algorithm is more accurate and robust than the US Energy Star scheme due to the ability in integrating all the building features that affect energy consumption. The feature extraction is made using ordinary least squares regression and clus-ters are generated using the k-means algorithm. Lara et al. 2015 also apply k-means clustering to assess the energy performance of schools in Italy and characterise reference building for each group. First an MLR method, as a mean of correlation analysis, is used to identify the most appropriate quantities and variables for represen-tation of energy demand and building properties. Then clustering algorithm cluster similar buildings regarding the defined variables. Finally, the building having the min-imum distance from the centroid is selected as the rep-resentative for each cluster. These reference buildings are useful tools for optimising retrofit solutions.
Yu et al.2011use clustering technique to demonstrate the impact of occupancy behaviour in building energy consumption. A similarity of building features unrelated to occupants behaviour is used for creating clusters, and the impact of users action in energy demand is inves-tigated for each cluster. Petcharat et al. 2012 propose a clustering algorithm to asses potential energy saving regarded to the lighting system in Thailand non-domestic stock. The authors indicate that cluster-based analysis is more effective than the only comparison of target building power density with reference cases that are defined by the country’s Energy Act.
Yang et al. 2017 apply a k-shape (proposed for
clus-tering time series) algorithm to identify energy usage patterns and then employ SVM for enhancing the accu-racy of building energy demand prediction. Jalori & Reddy
2015 propose clustering of days based on daily/hourly
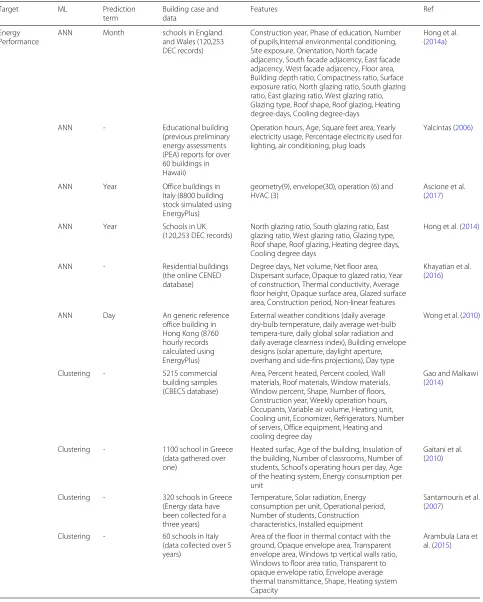
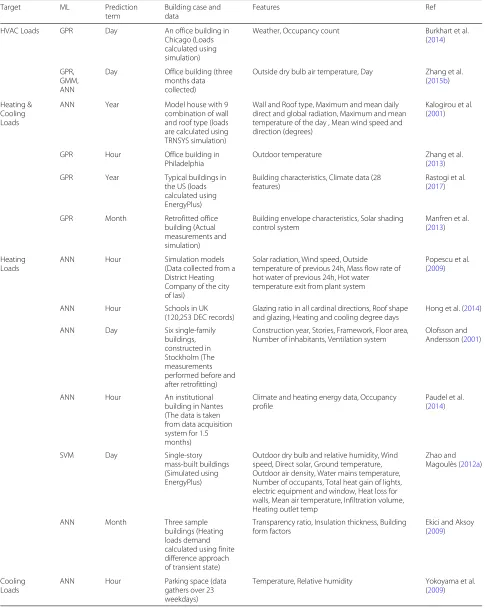
Table 1Summary of machine learning techniques for prediction of building energy consumption and performance
Target ML Prediction
term
Building case and data
Features Ref
Energy Performance
ANN Month schools in England
and Wales (120,253 DEC records)
Construction year, Phase of education, Number of pupils,Internal environmental conditioning, Site exposure, Orientation, North facade adjacency, South facade adjacency, East facade adjacency, West facade adjacency, Floor area, Building depth ratio, Compactness ratio, Surface exposure ratio, North glazing ratio, South glazing ratio, East glazing ratio, West glazing ratio, Glazing type, Roof shape, Roof glazing, Heating degree-days, Cooling degree-days
Hong et al. (2014a)
ANN - Educational building
(previous preliminary energy assessments (PEA) reports for over 60 buildings in Hawaii)
Operation hours, Age, Square feet area, Yearly electricity usage, Percentage electricity used for lighting, air conditioning, plug loads
Yalcintas (2006)
ANN Year Office buildings in
Italy (8800 building stock simulated using EnergyPlus)
geometry(9), envelope(30), operation (6) and HVAC (3)
Ascione et al. (2017)
ANN Year Schools in UK
(120,253 DEC records)
North glazing ratio, South glazing ratio, East glazing ratio, West glazing ratio, Glazing type, Roof shape, Roof glazing, Heating degree days, Cooling degree days
Hong et al. (2014)
ANN - Residential buildings
(the online CENED database)
Degree days, Net volume, Net floor area, Dispersant surface, Opaque to glazed ratio, Year of construction, Thermal conductivity, Average floor height, Opaque surface area, Glazed surface area, Construction period, Non-linear features
Khayatian et al. (2016)
ANN Day An generic reference
office building in Hong Kong (8760 hourly records calculated using EnergyPlus)
External weather conditions (daily average dry-bulb temperature, daily average wet-bulb tempera-ture, daily global solar radiation and daily average clearness index), Building envelope designs (solar aperture, daylight aperture, overhang and side-fins projections), Day type
Wong et al. (2010)
Clustering - 5215 commercial
building samples (CBECS database)
Area, Percent heated, Percent cooled, Wall materials, Roof materials, Window materials, Window percent, Shape, Number of floors, Construction year, Weekly operation hours, Occupants, Variable air volume, Heating unit, Cooling unit, Economizer, Refrigerators, Number of servers, Office equipment, Heating and cooling degree day
Gao and Malkawi (2014)
Clustering - 1100 school in Greece
(data gathered over one)
Heated surfac, Age of the building, Insulation of the building, Number of classrooms, Number of students, School’s operating hours per day, Age of the heating system, Energy consumption per unit
Gaitani et al. (2010)
Clustering - 320 schools in Greece
(Energy data have been collected for a three years)
Temperature, Solar radiation, Energy consumption per unit, Operational period, Number of students, Construction characteristics, Installed equipment
Santamouris et al. (2007)
Clustering - 60 schools in Italy
(data collected over 5 years)
Area of the floor in thermal contact with the ground, Opaque envelope area, Transparent envelope area, Windows tp vertical walls ratio, Windows to floor area ratio, Transparent to opaque envelope ratio, Envelope average thermal transmittance, Shape, Heating system Capacity
Table 1Summary of machine learning techniques for prediction of building energy consumption and performance (Continued)
Target ML Prediction
term
Building case and data
Features Ref
HVAC Loads GPR Day An office building in
Chicago (Loads calculated using simulation)
Weather, Occupancy count Burkhart et al.
(2014)
GPR, GMM, ANN
Day Office building (three
months data collected)
Outside dry bulb air temperature, Day Zhang et al. (2015b)
Heating & Cooling Loads
ANN Year Model house with 9
combination of wall and roof type (loads are calculated using TRNSYS simulation)
Wall and Roof type, Maximum and mean daily direct and global radiation, Maximum and mean temperature of the day , Mean wind speed and direction (degrees)
Kalogirou et al. (2001)
GPR Hour Office building in
Philadelphia
Outdoor temperature Zhang et al.
(2013)
GPR Year Typical buildings in
the US (loads calculated using EnergyPlus)
Building characteristics, Climate data (28 features)
Rastogi et al. (2017)
GPR Month Retrofitted office
building (Actual measurements and simulation)
Building envelope characteristics, Solar shading control system
Manfren et al. (2013)
Heating Loads
ANN Hour Simulation models
(Data collected from a District Heating Company of the city of Iasi)
Solar radiation, Wind speed, Outside temperature of previous 24h, Mass flow rate of hot water of previous 24h, Hot water temperature exit from plant system
Popescu et al. (2009)
ANN Hour Schools in UK
(120,253 DEC records)
Glazing ratio in all cardinal directions, Roof shape and glazing, Heating and cooling degree days
Hong et al. (2014)
ANN Day Six single-family
buildings, constructed in Stockholm (The measurements performed before and after retrofitting)
Construction year, Stories, Framework, Floor area, Number of inhabitants, Ventilation system
Olofsson and Andersson (2001)
ANN Hour An institutional
building in Nantes (The data is taken from data acquisition system for 1.5 months)
Climate and heating energy data, Occupancy profile
Paudel et al. (2014)
SVM Day Single-story
mass-built buildings (Simulated using EnergyPlus)
Outdoor dry bulb and relative humidity, Wind speed, Direct solar, Ground temperature, Outdoor air density, Water mains temperature, Number of occupants, Total heat gain of lights, electric equipment and window, Heat loss for walls, Mean air temperature, Infiltration volume, Heating outlet temp
Zhao and Magoulès (2012a)
ANN Month Three sample
buildings (Heating loads demand calculated using finite difference approach of transient state)
Transparency ratio, Insulation thickness, Building form factors
Ekici and Aksoy (2009)
Cooling Loads
ANN Hour Parking space (data
gathers over 23 weekdays)
Temperature, Relative humidity Yokoyama et al.
Table 1Summary of machine learning techniques for prediction of building energy consumption and performance (Continued)
Target ML Prediction
term
Building case and data Features Ref
ANN Day Public office building in
Kuwait (data for three building types)
External temperature Ben-Nakhi and
Mahmoud (2004)
ANN, SVM
Hour A model building in China
(measurements from an existing HVAC system)
Temperature, Relative humidity Hou et al. (2006); Hou and Lian (2009); Xuemei et al. (2009)
ANN Day Three institutional
buildings (The energy data is obtained through the facility management office)
Five previous day Deb et al. (2016)
GPR Hour office building in Lemont
city (data obtained from baselining and post-retrofit days)
Outdoor temperature Heo et al. (2012)
GPR Day An School building in
Stanford city (data obtained from baselining and post-retrofit days)
Outdoor temperature Noh and
Rajagopal (2013)
Energy Demand
ANN Hour holiday home which is
used only during weekends (forty cases generated by the program ZID)
Season, Insulation, Wall thickness, Time of day, Energy calculating function
Kalogirou and Bojic (2000)
ANN Hour Two datasets (Great
Building Energy Predictor Shootout I (5 months), office building located in Athens, Greece (one year))
Temperature, Solar radiation, Humidity ratio, Wind speed, Day
Karatasou et al. (2006)
ANN Year the US domestic buildings
(energy consumption is taken from U.S. Energy Information
Administration)
Population, Gross domestic product, House size, Median household income, Cost of residential electricity, Natural gas and oil
Kialashaki and Reisel (2013)
ANN Day An office building in
University of Sao Paulo
Daily maximum and minimum external dry-bulb temperatures
Neto and Fiorelli (2008)
SVM Month Four office buildings in
Singapore (energy consumption is obtained from utility bills over 4 years)
Dry bulb temperature, Relative humidity, Global solar radiation
Dong et al. (2005)
SVM Hour Multi-family domestic
building in New York City (data from the Great Energy Predictor Shootout)
Temperature, Humidity, Wind speed Jain et al. (2014)
Electricity Demand
ANN Hour An institutional facility in
Calgary (data collected over 15 month)
Outside temperature and relative humidity, Boiler outlet water temperature and flow-rate, Chiller outlet water temperature and flow-rate, Supply air temperatures for hot, cold duct, Supply and return control settings, Indoor air temperatures of 2 different zones
Platon et al. (2015)
ANN Hour A building in Athens (time
series of hourly values are collected over 6 years)
Air temperature, Solar radiation Mihalakakou et al. (2002)
SVM, ANN
Month, Day A residential building in Japan (data is collected over one year)
Date, Outdoor temperature, Bedroom temperature, Living temperature, Living humidity, Bedroom humidity, Outdoor humidity, Water temperature
Table 1Summary of machine learning techniques for prediction of building energy consumption and performance (Continued)
Target ML Prediction
term
Building case and data
Features Ref
SVM, ANN
Year 59 residential
buildings in China
Mean heat transfer coefficient of building walls, Mean thermal inert index of building walls, Roof heat transfer coefficient, Building size coefficient, Absorption coefficient for solar radiation of exterior walls, Window to wall ratio in four directions, Mean window to wall ratio, Shading coefficient of window in four directions, Integrated shading coefficient
Li et al. (2010)
SVM, ANN
Hour A university office
building (electrical load data is collected with a power meter)
Outdoor/indoor temperature and humidity, Indoor illumination, Solar radiation, Calendar nominal attributes
Massana et al. (2015) Li et al. (2010)
GMM Day DoE super market
reference model (climate data from Chicago)
Outside dry-bulb air temperature and humidity ratio, Direct solar radiation
Srivastav et al. (2013)
forecasting models, and so increases the performance of BMS.
Summary of ML models
A summary of ML approaches based on the application is given in Table 1. The table provides information on prediction duration, the building study cases and data
or energy usage collection and features used in model training.
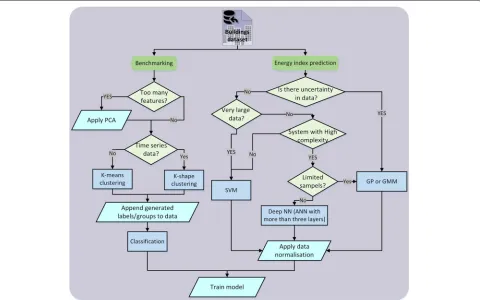
Based on the results from seminal works and proposed methods for different applications and considering some ML factors, we propose a framework for selecting the right method for building energy prediction and bench-marking as demonstrated in Fig.4.
[image:15.595.59.539.412.712.2]Conclusion
In recent years, optimisation of construction and building energy usage have been received considerable attention as this sector is known as the main contributor to air pollu-tion and fossil energy consumppollu-tion. The regulapollu-tions and rising fuel prices have forced owners to reduce energy use using smart controls, sensors or retrofitting. This concern has become more critical in the non-domestic sector as a massive amount of energy is wasted due to inefficient management. As a result, various smart tech-nologies have been applied for the purpose of energy saving. The rapid development of the modern technolo-gies including sensors, information, wireless transmission, network communication, cloud computing, and smart devices has been led to an enormous amount of data accu-mulation. The traditional modelling of building energy using software and statistical approaches does not satisfy the demand for fast and accurate forecasting, which is essential for decision-making systems. ML models have shown great potential as an alternative solution for energy modelling and assessment for different types of build-ings. This paper presented a review of ML models utilised for building energy forecasting and benchmarking indi-cating the advantages and drawbacks of each model. Moreover, several pre-processing techniques applied to models to enhance prediction accuracy were well discussed.
ANN has been broadly used in building energy fore-casting since the first introduction in the sector at 1990’s. ANNs provide a powerful tool for modelling building energy modelling and reliable prediction. However, they require a proper choice of network structure and precise adjustment of its several hyper-parameters for training. The performance of the models is not guaranteed as ANN suffer from a local minimum problem. Results from dif-ferent researchers indicate that ANN should be fed with adequate number of samples in order to obtain acceptable accuracy. Otherwise it might be outperformed with sim-ple MLR models. It could be concluded that ANN is much appropriate for engineers having a strong knowledge of deep learning and statistical modelling.
In contrast with ANN, SVM and GP are supervised using few parameters and provide satisfactory perfor-mance. It has been shown that SVM surpasses ANN in load forecasting and has the potential to build models from limited samples. Nevertheless, the ANNs used for comparison in the studies as mentioned earlier, exploit simple structure, and the hyper-parameters might not be well optimised due to the complexity. Among ML tech-niques and other black box methods, only GP is used for model training with uncertainty assessment. Never-theless, it is not the solely capable technique. Recently, uncertainty and sensitivity analysis for other ML mod-els has been introduced and utilised. Hence, it worth to
devote research attention to deploy these approaches for modelling building under uncertain data.
In general, it is challenging to conclude that which ML model is the best, as from literature it can be induced that all models provide reasonable accuracy by supplying large samples and optimising the hyper-parameters. Thereby, it is imperative to thoroughly analyse the nature of avail-able or collectavail-able data and the application, to choose the most suitable model. For example, ANN provides a fast and precise short-term load forecasting for EMSs where temperature and humidity data is collected using sensors, while GP is more beneficial for long-term energy estima-tion when there is uncertainty in input variables. In fact, feature selection itself require an extensive investigation for each application as it is the preliminary requisite for implementation of any ML model.
Another issue with seminal literature is that there has not been a fair comparison of different ML models. As dis-cusses before, there are several researches that compare the proposed ML method with conventional regression models or another simple ML model without provid-ing sufficient detail of the structure. Hence, a thorough investigation of these techniques by tuning models is rec-ommended, which will ease decision making for expert selecting MLs for energy forecasting.
Apart from modelling building energy, clustering build-ings based on various input parameters remarkably facil-itates and enhances energy benchmarking procedure. Smartly determination of reference buildings leads to more precise energy labelling, comparing with a tradi-tional definition of notradi-tional buildings. Moreover, a com-bination of clustering with classification allows estimating the reference building for future cases. This area has not been studied thoroughly and seems to be a trending topic in the near future as the global concern about energy is increases and many countries put efforts to regulate the energy consumer industries especially buildings and construction.
The global warming issue raised by greenhouse gasses emission is getting more attention every year. Modern technologies such as Big Data and Internet of Things find their place in building energy applications where large data from sensors and energy meters need highly efficient data processing systems. It is clear that traditional meth-ods of energy modelling and forecasting won’t be able to accompany the novel data mining development. Con-sequently, intelligent models are required in industry to answer this demand, and further investigation of AI appli-cation in building sector focusing on industrial data seems to be essential.
Abbreviations