City, University of London Institutional Repository
Citation
:
Yazdanian, M. and Fu, F. (2017). Parametric study on dynamic behavior of rectangular concrete storage tanks. Coupled Systems Mechanics, 6(2), pp. 189-206. doi: 10.12989/csm.2017.6.2.189This is the accepted version of the paper.
This version of the publication may differ from the final published
version.
Permanent repository link:
http://openaccess.city.ac.uk/id/eprint/17581/Link to published version
:
10.12989/csm.2017.6.2.189Copyright and reuse:
City Research Online aims to make research
outputs of City, University of London available to a wider audience.
Copyright and Moral Rights remain with the author(s) and/or copyright
holders. URLs from City Research Online may be freely distributed and
linked to.
Parametric Study on Dynamic Behavior of Rectangular
Concrete Storage Tanks
Mohsen Yazdanian
1*, Feng Fu
2*1 Young Researchers and Elite Club, Ahvaz Branch, Islamic Azad University, Ahvaz, Iran 2 School of Mathematics, Computer Science & Engineering, Department of Civil Engineering, City
University London, Northampton Square, London, UK
(Received keep as blank , Revised keep as blank , Accepted keep as blank )
Abstract. Tanks are used to store a wide variety of liquids such as oil, gasoline and water. It is reported that, a large number of tanks have been damaged during severe earthquakes. Therefore, understanding their behavior under earthquake is an important subject for structural engineers. In this paper, a comprehensive study is presented on dynamic response of tanks. A parametric study has been completed on the rectangular storage tanks with aid of finite element method (FEM). Various parameters are investigated, such as; liquid height, density and earthquake with different peak ground acceleration (PGA). When investigating these parameters, modal and time history method is used. Six different earthquake records are used for time history analysis. The analysis results show that when the PGA increases by 10.7 times, the maximum displacements, stress, sloshing and base shear increase by 11.4, 22.6, 5.46 and 17.8 times, respectively and when the liquid height increases by two times, the absolute maximum values of stress, displacements, base shear and sloshing increase 1.65, 2.04, 2.05 and 1.34. Furthermore, values of sloshing increase with decrease in density.
Keywords: Dynamic; Rectangular Tanks; Time history; Modal.
1. Introduction
Rectangular Concrete storage tanks (RCSTs) are widely used as structures to store water and other liquids and due to the simplicity of design method, cost efficiency and high strength across loads, RCSTs are used as engineering structures for storing liquids (Bayraktar et al., 2010). These structures have become widespread along the past years because of needs for storing liquid has been increased dramatically.
destroyed during the Kocaeli earthquake which happened in Turkey on 1999. In this earthquake, widespread damage was observed at the Tupras oil refinery which had 19 km distance from the earthquake center. More research in seismic behavior of tanks affected by the 1999 Kocaeli, Turkey earthquake is investigated by (Sezen et al., 2008; 1999; 2004; Korkmaz, 2011).
Due to the importance of this type of structures many researchers studied the dynamic behavior of tanks. Initially, Housner (1963) proposed a new method for seismic behavior of rigid tanks in which hydrodynamic pressure on the wall is divided into two parts: impulsive and convective. The Housner’s method has been selected for analysis in all of last codes and regulations. An expanded function of Housner’s technique, in the terms of a new design method, was presented by Epstein (1976). Haroun & Tayel (1985) proposed a finite element (FE) procedure for investigating the seismic behavior of tanks. Rosenblueth & Newmark (1971) investigated dynamic behavior of rigid tanks with aid of lumped mass method. Later, Veletos & Yang (1977) obtained the forces and pressure distribution in the tanks by using an analytical method. Veletsos & Kumar (1984) suggested a new method for determining the effect of vertical component of earthquake on cylindrical tanks. Firouz-Abadi et al (2008) used a three dimension boundary element method to identify the natural frequencies and mode shapes of liquid sloshing in cylindrical baffled tanks. Amiri and Yazdi (2011) used both experimental tests and FE modeling of cylindrical tanks. They found good agreement between the numerical and experimental values of dynamic parameters. Hosseinzadeh et al (2013) developed different cylindrical tanks using FE software and then compare the results obtained from FE software with those obtained from API standard. They focused mainly on the vulnerability factors including base shear, elephant buckling and stresses. They concluded that there is a similarity between the results obtained from FE software and API standard. Ormeño et al (2015) provided methods for seismic ground motion scaling in dynamic analysis of cylindrical storage tanks. They used three different methods for doing several analyses of earthquake responses. Ruiz et al (2015) suggested a computational technique for dynamic analysis of cylindrical tanks. The proposed model was established according to the theory of potential flow, in which the Continuity equation is solved through the FE method. Yazdanian et al (2016) conducted a research on the behavior of cylindrical tanks under four different analysis method including time history, response spectrum, modal and static. They observed a huge difference between the results obtained from time history analysis with those obtained from the other analysis. In addition to these studies, some experimental studies can be found for example, Hosseinzadeh et al (2014) studied the effectiveness of annular baffles for cylindrical tanks. They concluded that the annular baffles lead to a significant reduction in created sloshing during an earthquake. Park et al. (2016) looked at the seismic and dynamic behavior of cylindrical tanks using a scaled tank in an experimental test. They concluded that the phase of hydrodynamic pressure was approximately similar with that of the corresponding acceleration at locations that impulsive part of liquid was dominant.
liquid–tanks and soil–tanks interaction effects and non-linear interaction effect of the soil and contact nodes between the soil and the wall. Kianoush & Ghaemmaghami (2011) investigated the effect of different earthquake frequency content on the dynamic response of two RCSTs using the FEM regarding soil-liquid-tank interaction. Yazdanian et al (2016) used FE method to evaluate the seismic behavior of two concrete rectangular tanks regarding fluid-structure interaction. They concluded that the structural responses obtained from time history analysis are more accurate than those obtained from response spectrum analysis. Nayak and Biswal (2016) Used Galerkin-weighted-residual based FE method to study on the seismic behaviour of rectangular tanks. They observed that the convective responses of tanks are highly sensitive to the frequency content of the ground motion. Goudarzi & Danesh (2016) investigated the seismic behavior of a rectangular tank using numerical methods with emphasize on the effectiveness of baffles in rectangular tanks. They observed that sloshing amplitude reduced dramatically. Rezaiee-Pajand et al. (2016) presented an analytical solution for two dimension rectangular tanks considering fluid-structure interaction.
In the literature, various investigations consider damage to, and failure of storage tanks; however, in many cases, conventional procedures are not sufficient to accurately define structural behavior. Therefore, appropriate definitions of dynamic behavior of tanks require FE analysis of the interaction of contained liquid and structure.
In recent decades, many researchers have studied RCSTs, but still these types of structures are damaging under earthquake. In addition, most of research is done on cylindrical tanks so this may show some inadequacy studies on these RCSTs. Recent studies have generally failed to focus on the effect of earthquake on various parameters which instead have focused on a specified tank. The prime focus of this study is on the concrete rectangular tanks and a number of parameters have been investigated accordingly. Hence, different parameters, including effect of liquid height ratio, variation of liquid’s density and effect of different earthquake frequency content, peak ground acceleration (PGA) and duration time is investigated. For this purpose, nine tanks are modeled using FE software regarding fluid and structure interaction. It should be noted that six different earthquake records is considered to study on the earthquake record variation. Furthermore, recent studies have just examined the vibration or seismic behavior of the tanks, while in this paper three different analyses including static, modal and time history analysis has been conducted. Also, one of the significant parameter regarding in this study is that three component of earthquakes (longitude, transverse, and vertical) are considered. This is an important factor not studied adequately in the literature and therefore needs more investigation. This paper has led to several new findings which are developed using different tanks models with different configuration that are investigated under three different earthquake records incorporating liquid–structure interaction. 2- ANALYTICAL MODEL
In this study, the liquid motion is represented in terms of continuity conditions of contained liquid and boundary conditions of the contact interface between liquid and tank walls as well as free surface of the liquid. The liquid is supposed to be incompressible, irrotational and non-viscous and also there is no mean flow of the fluid. Using the classical potential fluid theory and assuming an ideal fluid (Moslemi & Kianoush, 2012), the governing equation of motion in liquid contained
in a tank is presented as follow: 2p0 (1)
To solve the Eq.1 with aid of the FEM, a set of suitable boundary conditions are required as discussed in following sections. As there is no move at the interface of fluid and tank, the proper boundary condition on the liquid and tank interface is presented as follow:
ans n
p
(2) Where, n and ans are outwardly normal direction to the tank wall and normal acceleration
applied on the liquid at the interface, respectively.
Considering small amplitude gravity waves on the free surface of liquid, the resulting boundary condition is given as:
1 2 0 2 z p t p
g (3) In which, z is vertical direction and g is acceleration gravity.
As stated in many researches on structural dynamics (Chopra, 2000), the equations of motion for a multi degree of freedom system subjected to dynamic forces can be presented in the following form:
aF u K u C u
M (4) In which
M ,
C and
K are mass, damping, and stiffness matrices, respectively.
u ,
u and
u are displacement, velocity, and acceleration vectors.
Fa symbolizes the applied load vector.
C is the matrix representing damping in fluid.In this research, the same classical damping method known as Rayleigh damping (and ) is used for both structural and fluid system. and are employed to calculate Rayleigh damping constants and . The damping in the liquid
C includes two components that are because of impulsive and convective portion of the liquid (Moslemi & Kianoush, 2012):
C M K (5) Where and are selected according to both the natural frequency of convective andimpulsive components of the tanks (ACI, 2009). , are determined by following equation:
j i i j i j i j j i 1 1 2 2
2 (6) where i,j are two main frequencies andi, j are also damping of them.
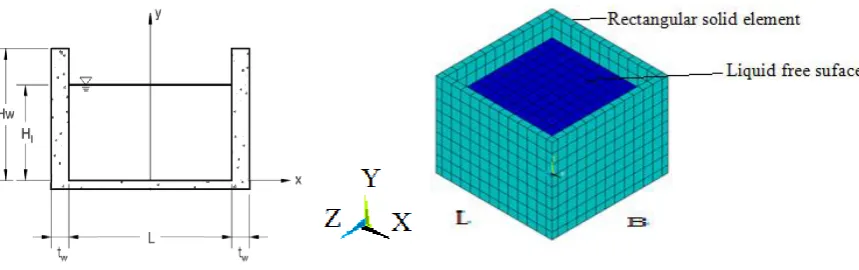
In the present paper, the RCSTs are supposed to have rigid wall boundary conditions and the base is connected rigidly to the tank wall, the base of the tanks is assumed fixed. In current research, nine RCSTs have been selected for parametric study of tanks' dynamic behavior. Six tanks were selected with the same dimension and material but with different liquid height ratio, to study the effect of liquid height to tank height (Hl/Hw) on seismic behavior of tanks. In addition, to study the effect of density of liquid on seismic behavior of tanks, one of the tanks was filled with four different liquid types. All four tanks with different liquid type had the same height and length, the only parameter which differed from others was the density of liquid of the tanks. In the investigation of the behavior of tanks under different earthquakes, tank o.1 was selected and six different ground motions were exerted to this tank. Properties of the concrete and liquid materials for all tanks are shown in Table 1. The materials of the RCSTs are assumed isotropic, linearly elastic. The Geometric Characteristics of the studied tanks are shown in Table 2. The tanks are in square shape, so, length of the tanks is equal to width of them. Figure 1 illustrates one of the models which are modeled using FE Software. As evident, these tanks have regular elements. Regular elements, meshing have a strong influence on the results.
Fig. 1. FE Modeling of tank
Table 1. Material properties used in the analysis
Young’s modulus (Gpa) Poisson’s
ratio Density
(kg/m^3) Materials
properties
25 0.2
2500 Concrete
-1000 Fluid(water)
910 Fluid(Machine
oil)
-800 Fluid (oil)
[image:6.595.82.512.366.501.2]
-680 Fluid (Gasoline)
Table 2. Specification of the tanks considered
tw (m)
Hl/Hw
L=B (m) Hl (m)
Hw (m)
liquid type Tank N
o
0.3 0.75
5.7 3
4 water
1
0.3 0.5
5.7 2
4 water
0.3 0.25 5.7 1 4 water 3 0.3 0.125 5.7 0.5 4 water 4 0.3 0.375 5.7 1.5 4 water 5 0.3 0.625 5.7 2.5 4 water 6 0.3 0.75 5.7 3 4 Machine oil
7 0.3 0.75 5.7 3 4 oil 8 0.3 0.75 5.7 3 4 gasoline 9
3- STATIC ANALYSIS
In the first step, the tanks were analyzed based on their weight and the hydrostatic pressure of internal fluid. This analysis can be used in compound loading, and also it can be used as a criterion for the evaluation of constructed model. The generated hydrostatic pressure causes annular tensile stresses in the tank wall. The maximum values of hydrostatic pressure are presented in tables 3. Comparison of results reveals that the tank No.1 which is filled with the liquid with the highest value of density has the highest values of hydrostatic pressure. It is noteworthy that all the highest static results are occurred at the middle and edge of the tanks. However, trend for tanks with a very low water level are a bit different. It can be seen from this table that decreasing of liquid level result in lower values of structural responses.
4- DYNAMIC ANALYSIS
4-1- Modal analysis
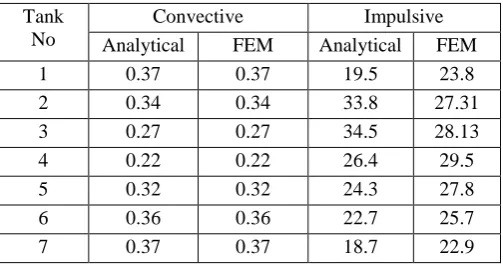
Natural frequencies and mode shapes of a tank are important factors in the analysis of RCSTs. Assessing these modes in the first step can be very useful in determining the dynamic behavior of the tanks. Before carrying out time history analysis, modal analysis is performed on the RCSTs. Convective and impulsive modes are most important modes which have the most significant effects among all frequencies of vibration. According to the maximum effective mass in modal analysis, two impulsive and convective modes are extracted and values of these modes would be set in eq. (6). Figure 2 illustrates two vibrational modes of the tank No. 1. Table 4 demonstrates the accuracy and validity of the (FEM) software result. The natural frequencies are compared with the analytical solutions calculated by (ACI, 2009; NZSE 2009) standard. It can be seen that there is an agreement between convective and impulsive frequencies obtained using FEM and those obtained using analytically solution. Values of convective and impulsive frequencies change with differences in density and liquid level.
According to ACI standard, time period of convective mode of vibration, in seconds, is given as follow:
L Tc
2
(7) In which, L is inside length of a storage tank with a rectangular shape, L must be parallel to the direction of the earthquake force and is defined as follow:
)]) ( 16 . 3 tanh[ 16 . 3 ( L H
g L
(8) Where, HLis liquid height and gis gravity .Also according to ACI impulsive period of the
K m
Ti2 (9) Where, m is accounted for by adding impulsive mass of contained liquid per unit width of a
rectangular tank wall (mi) and mass per unit width of a rectangular tank wall (mw): i
w m
m
m (10)
Impulsive mass of contained liquid per unit width of a rectangular tank is given as:
L L L i i H L W W
m ) 2
( )
( (11) In which, Wiis equivalent mass of the impulsive component of the stored liquid; WLis total mass
of the stored liquid; HLis design depth of stored liquid and L
is mass density of the contained
liquid. Also equivalent masses of accelerating liquid, (
L i W W , L c W W
) are given as:
) ( 866 . 0 )] ( 866 . 0 tanh[ L L L i H L H L W W
(12)
)] ( 16 . 3 tanh[ ) ( 264 . 0 L H H L W W L L L c (13) In above equation, Wcis equivalent mass of the convective component of the stored liquid.
c w w w t H
m ) 10 ( ) (
3 (14)
In which, Hw is height of tank wall; tw is average wall thickness and c is mass density of
concrete. For fixed-base, open-top tanks, flexural stiffness k may be obtained as follow:
3
6 ( )
10
4 h
t E
k c w
(15)
) ( ) ( i w i i w w m m m h m h h
(16)
Where, hwis height from the base of the wall to the centre and hiis height above the base of the
wall to the center of gravity of the impulsive lateral force of gravity of the tank shell.
w
w H
h 0.5 (17) Also according as follow equations hi and hc can be computed. In follow equations, hi and hc
are the height above the base of the wall to the center of gravity of the impulsive and convective lateral force. 375 . 0 33 . 1
tan
L i L H h H L with ks
For (18)
)] ( 16 . 3 sinh[ ) ( 16 . 3 1 )] ( 16 . 3 cosh[ 1 L H L H L H H h L L L L c
4-2- Time History analysis
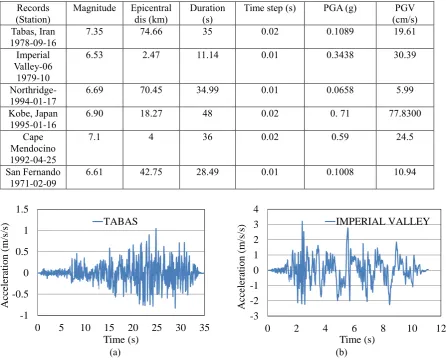
In this study the longitudinal, transverse and vertical components recorded of six different ground motion records are used. Table 5 shows all these six ground motion records. Different parameters are investigated along the height and for this purpose; a layer of wall elements is selected. This layer of wall is at the center of wall in all tanks. Also, this layer of wall is shown in Figure 4. All the tanks have similar height, so different parameters and structural responses can be compared with each other according to the height. As shown in figure 4, the tanks are in square shape, so there is no difference in selecting the wall. However in all tanks, these modes of wall are considered for outputs.
Fig. 2. Vibration mode shape of tanks Table 3. Summary results of static analysis
Hydrostatic pressure (MPa) Hl/Hw
Tank No
0. 26 0.75
1
0.08 0.5
2
0.01 0.25
3
0.01 0.125
4
0.04 0.375
5
0.14 0.625
6
0.19 0.75
7
0.17 0.75
8
0.14 0.75
[image:9.595.75.327.587.720.2]9
Table 4. Comparing of impulsive and convective frequencies Impulsive Convective
Tank
No Analytical FEM Analytical FEM 23.8 19.5
0.37 0.37
1
27.31 33.8
0.34 0.34
2
28.13 34.5
0.27 0.27
3
29.5 26.4
0.22 0.22
4
27.8 24.3
0.32 0.32
5
25.7 22.7
0.36 0.36
6
22.9 18.7
0.37 0.37
20.57 17.1
0.37 0.37
8
21.06 17.5
0.37 0.37
[image:10.595.74.521.247.609.2]9
Table 5. Ground motion records specification Records
(Station) Magnitude Epicentral dis (km) Duration (s) Time step (s) PGA (g) (cm/s) PGV Tabas, Iran
1978-09-16 7.35 74.66 35 0.02 0.1089 19.61
Imperial Valley-06
1979-10
6.53 2.47 11.14 0.01 0.3438 30.39
Northridge-
1994-01-17 6.69 70.45 34.99 0.01 0.0658 5.99
Kobe, Japan
1995-01-16 6.90 18.27 48 0.02 0. 71 77.8300 Cape
Mendocino 1992-04-25
7.1 4 36 0.02 0.59 24.5
San Fernando
1971-02-09 6.61 42.75 28.49 0.01 0.1008 10.94
(a) (b)
-1 -0.5 0 0.5 1 1.5
0 5 10 15 20 25 30 35
Accele
ratio
n
(m
/s/s)
Time (s) TABAS
-3 -2 -1 0 1 2 3 4
0 2 4 6 8 10 12
Acce
le
rati
on
(m
/s/
s)
Time (s)
(c) (d)
(e) (f)
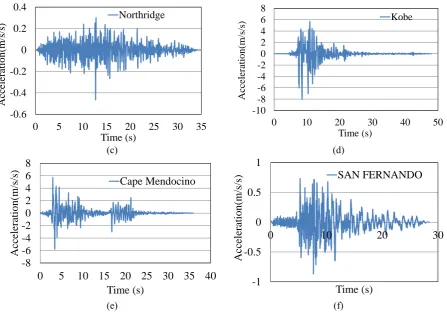
Fig. 3. Horizontal records: (a) Tabas; (b) Imperial Valley; (c) Northridge; (d) Kobe ; (e) Cape Mendocino; (f) San Fernando
[image:11.595.77.525.142.454.2]
Fig. 4. Layer of wall selected for outputs
5. PARAMETRIC ANALYSIS
5.1- Effect of liquid height to height variation
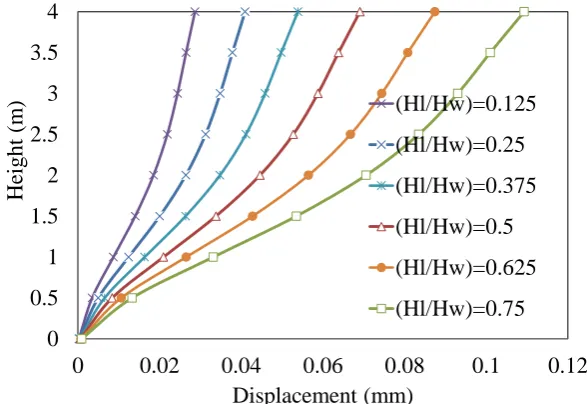
Six tanks (No.1 to No.6) with the same properties and the same height and length in six different liquid levels are modeled and the only parameter which differed from others was the height of liquid inside the tank. The wall element of tank along the height according to figure 4 is selected for comparing structural responses of stress and displacement over the height. Figure 5
-0.6 -0.4 -0.2 0 0.2 0.4
0 5 10 15 20 25 30 35
Accele
ratio
n(m
/s/s)
Time (s) Northridge
-10 -8 -6 -4 -2 0 2 4 6 8
0 10 20 30 40 50
Accele
rati
on
(m
/s/
s)
Time (s)
Kobe
-8 -6 -4 -2 0 2 4 6 8
0 5 10 15 20 25 30 35 40
Acc
elera
tio
n(
m
/s/s)
Time (s)
Cape Mendocino
-1 -0.5 0 0.5 1
0 10 20 30
Acc
ele
ration
(m
/s/s)
Time (s)
shows that the maximum displacement along the x-axis is obtained in tank No.1 wall with (Hl/Hw) = 0.75 and also the minimum displacement is obtained in tank No. 6 wall with (Hl/Hw) = 0.125. This shows that the liquid height affects the seismic behavior of tanks. However in some part of the wall, the displacement of tank No.1 is equal to the value of tank No. 2 with (Hl/Hw) =0.5, but this is due to the wave height. In tank No.1 with (Hl/Hw) =0.75, some parts of liquid is overflowed by earthquake excitation. Also the maximum displacements in each tank are obtained at the highest part of the tank. This is due to the wave impact that is created during earthquake and, in general tank wall has a similar shape to the cantilever beam and maximum displacements in cantilever beam occur at the end of the beam. Also the minimum displacement is obtained at the lowest part of the tank. So it can be observed that an increase in height lead to an increase in displacements.
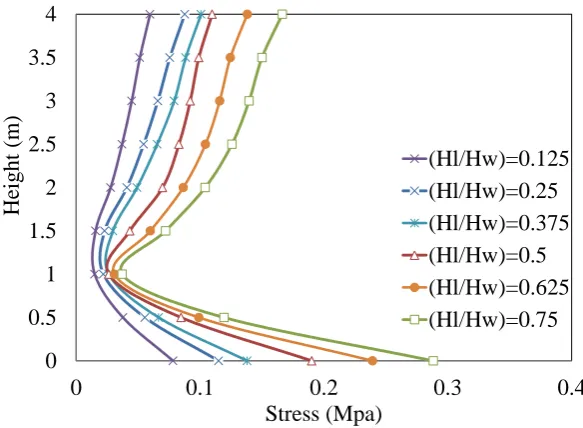
[image:12.595.151.445.413.615.2]Figure 6 shows the stress of wall elements. As shown, the value of stress in tank which has the highest liquid level is more than other tanks. The minimum stresses are observed in tank No.4 with (Hl/Hw) =0.125. All tanks developing the highest stresses at their base. It can also been in these curves that in all tanks a considerable increase in the magnitude of stresses was observed at the highest part of the tanks compared to those at the mid-height of all six tanks. The maximum stress at the lowest part of the tanks is due to hydrostatic pressure. In other words, impulsive pressure which is situated at the lowest part of the tanks attribute highly in this increase. Furthermore, the value of stresses at the highest part of the tanks is due to wave pressure in earthquake. Wave pressure can cause maximum displacement and stress at the highest part of the tank.
Fig. 5. Maximum displacements in the layer of wall elements along X -axis
0 0.5 1 1.5 2 2.5 3 3.5 4
0 0.02 0.04 0.06 0.08 0.1 0.12
Height
(m
)
Displacement (mm)
(Hl/Hw)=0.125
(Hl/Hw)=0.25
(Hl/Hw)=0.375
(Hl/Hw)=0.5
(Hl/Hw)=0.625
Fig. 6. Maximum stresses along the layer of wall elements
A summary of dynamic results are presented in table 6. To obtain the maximum base shear and displacement in tanks, all nodes of the tanks are selected. Also the maximum sloshing for all six tanks is obtained and compared in table 6. As it can be seen form table 6, the maximum displacements in all three directions of coordinate system are obtained. They show that the maximum displacements are obtained in all three directions for tank No.1 with (Hl/Hw) =0.75 and also the minimum is for tank with (Hl/Hw) =0.125. Also the maximum base shear is observed in tank No.1 with (Hl/Hw) =0.75 and the minimum in tank with (Hl/Hw) =0.125. The level of water in tank with (Hl/Hw) =0.75 is more than other tanks, so this tank is heavier than the other tanks. The results show that an increase in liquid height lead to an increase in the weight of the tank and this increase lead to an increase in values of base shear. In addition, based on the results obtained from sloshing, the highest values of sloshing are observed for tanks which had higher level of water. It shows that more level of liquid create more wave height.
Table 6. Summary of maximum dynamic responses of the tanks
Sloshing (mm) Maximum Base Shear
(MN) Maximum displacement (mm)
w l
H H
Z Y
X
510 0.154
0.1 0.004
0.11 0.75
470 0.137
0.089 0.003
0.088 0.625
430 0.113
0.071 0.002
0.069 0.5
380 0.075
0.056 0.002
0.054 0.375
350 0.049
0.042 0.001
0.041 0.25
320 0.022
0.029 0.0009
0.028 0.125
5.2- Effect of variation in density of liquid
Effect of variation in density of liquid is investigated in this part and for this purpose, four different liquid types are considered. As stated before, the properties and materials of the tanks are similar and the liquid type parameter is just differed. Tank No. 1, 7, 8 and 9 are considered for this
0 0.5 1 1.5 2 2.5 3 3.5 4
0 0.1 0.2 0.3 0.4
Height
(m
)
Stress (Mpa)
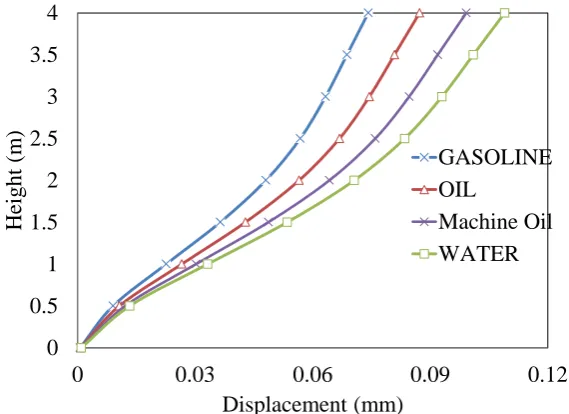
[image:13.595.82.514.543.658.2]purpose. The material and properties of these tanks are presented in table 1 and 2. The displacements in wall element of these tanks along x-axis are presented in Figure 7. The wall element of tank along height according to Figure 4 is selected for comparing values of stress and displacement responses over the tank wall height. As shown in this figure, the maximum displacement along the wall element is obtained at the highest part of all tanks. Also, the minimum displacement is occurred at the lowest part of the tanks. The maximum displacement is in tank No. 1 which is filled with water and the minimum displacement is in tank No. 9 which is filled with gasoline. Tank No. 1 which is filled with water has higher density ratio than the other tanks. Therefore, it can be concluded that an increase in density lead to an increase in values of displacements.
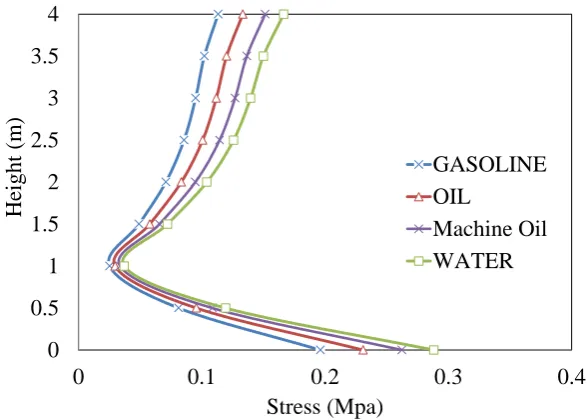
[image:14.595.150.435.362.569.2]In Figure 8, the stress values are shown along the height of the tank wall element. The maximum stress is obtained at the tank No. 1 wall element which is filled with water. The minimum value of stress is occurred at the tank No. 9 filled with gasoline. As was the case for displacements, the maximum stresses in all four tanks are obtained at the lowest and highest part of the tank wall. However the value of the stress at the lowest parts of the tank is higher than its highest part. This figure shows that an increase in density leads to an increase in stresses values.
Fig. 7. Maximum displacements over the layer of wall elements along X -axis
0 0.5 1 1.5 2 2.5 3 3.5 4
0 0.03 0.06 0.09 0.12
Height
(m
)
Displacement (mm)
GASOLINE OIL
Fig. 8. Maximum stresses along the layer of wall elements
In table 7, the maximum displacements and base shear of the tanks are presented. As this table shows, the maximum displacement in three different directions is occurred in tank No. 1 which is filled with water. The minimum displacements are obtained in tank No. 9 which is filled with gasoline. Also, the maximum base shear is also achieved in tank No. 1 which has higher liquid level than other tanks and also is heavier than the other tanks. The minimum base shear is obtained in tank filled with gasoline. This is due to the fact that this tank has less density than the other thanks and as a result this tank has less weight than other tanks and the weight of a tank has a significant effect on the values of bas shear. Comparison results obtained for sloshing responses reveals that a tank with a heavy liquid experience a bit smaller amount of wave displacement.
Table 7. Summary of maximum dynamic responses of the tanks
Sloshing (mm) Maximum Base Shear (MN)
Maximum dis (mm) Liquid Type
Z Y
X
510 0.154
0.1 0.004
0.11 Water
530 0.148
0.096 0.004
0.099 Machine Oil
560 0.140
0.087 0.004
0.088 Oil
590 0.127
0.074 0.003
0.074 Gasoline
5.3 Effect of different earthquake
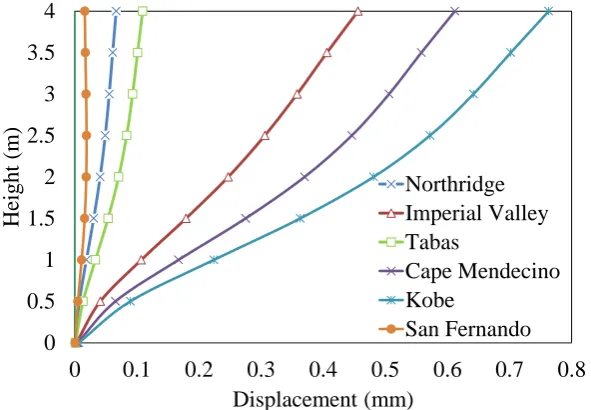
It is obvious that different earthquakes can cause different damages. In this part, the effect of earthquake frequency content, peak ground acceleration (PGA) and duration time on the tanks is investigated. For this purpose, six different earthquakes are used and these earthquakes are selected with different PGA and duration time. The wall element of tank along the height according to figure 4 is selected for comparing stress and displacement responses along the height. In figure 9 the displacements of wall element along x-axis is shown and it can be observed that the maximum displacement is obtained in Kobe earthquake. Also, the minimum displacements are
0 0.5 1 1.5 2 2.5 3 3.5 4
0 0.1 0.2 0.3 0.4
Height
(m
)
Stress (Mpa)
GASOLINE OIL
[image:15.595.79.521.516.601.2]obtained along the San Fernando earthquake. As shown, the maximum displacements in all earthquakes are obtained at the top of the tanks and this is due to the fact that the wave pressure cause to the maximum displacements. Also the minimum of the displacements are obtained at the lowest part of the tank. Based on the results, increases in height lead to an increase in the values of displacements. As it can be observed, the value of displacements in Kobe earthquake is higher than the values of other records responses, this is due to the fact that the Kobe earthquake has more PGA than other earthquakes.
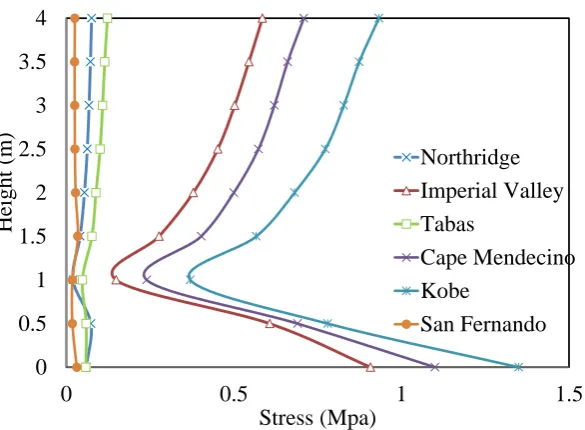
[image:16.595.149.445.425.630.2]The maximum stresses at the layer of wall elements are illustrated in Figure 10. It can be observed that in all six earthquakes, the maximum stresses are obtained at the lowest and highest part of the tank wall. It is worth to be noted that the differences between structural responses obtained from different earthquake is quite a lot, and this differences change with variation of PGA. Stresses obtained for Kobe, Imperial Valley, and Cape Mendocino are higher than other earthquakes responses. There is a dramatic difference between the structural responses of above-mentioned records with other three ground motion responses. Also it can be observed that in all six earthquakes, the minimum results are obtained in height of 1 meter from bottom of the tank. It should be noted that the lowest displacement and stresses which obtained for San Fernando record have opposite trend, they developed the most structural responses at the middle of the tank wall, and is quiet similar to static analysis which has been done for all tanks before time history analysis. This is more relevant to low frequency content of this record that did not induce impulsive and convective pressure along tanks wall
Fig. 9. Maximum displacements over the layer of wall elements along X-axis
0 0.5 1 1.5 2 2.5 3 3.5 4
0 0.1 0.2 0.3 0.4 0.5 0.6 0.7 0.8
Height
(m
)
Displacement (mm)
Northridge Imperial Valley Tabas
Cape Mendecino Kobe
Fig. 10. Maximum stresses over layer of the wall elements
[image:17.595.79.518.456.601.2]Time history response of maximum displacement, sloshing and base shear are shown in figures 11 to 14. The maximum displacement and stress are shown at the highest part of the tank and also the maximum base shear is shown. All these figures show the maximum response of the tank No.1 under TABAS earthquake. Also maximum stress in last second of TABAS earthquake is shown in Figure 14.
Fig. 11 Maximum dis in tank No.1 (height of 4m) Fig. 12. Time-history of sloshing in tank No.1 (m)
0 0.5 1 1.5 2 2.5 3 3.5 4
0 0.5 1 1.5
Height
(m
)
Stress (Mpa)
Northridge
Imperial Valley
Tabas
Cape Mendecino
Kobe
San Fernando
-0.15 -0.1 -0.05 0 0.05 0.1 0.15
0 5 10 15 20 25 30 35
Displacem
ent
(m
m
)
Fig. 13. Maximum base shear in tank No.1 Fig. 14. Stress in last second of TABAS earthquake (pa)
[image:18.595.79.518.138.302.2]The maximum displacements and base shear in tanks are presented in Table 8. It is clearly seen from this table that the maximum displacements in three different directions are maximum in Kobe earthquake and this is because of the fact that this record has the highest PGA. Also the minimum displacements are obtained for San Fernando earthquake. It was also observed in Figure 9 for a section of wall. Similar to displacements responses the highest base shears are obtained in Kobe earthquake and the lowest are obtained along San Fernando earthquake. As it was mentioned before, the PGA of earthquake has significant impact on the results. Similar to other response, the highest sloshing range is occurred for Kobe ground motion.
Table 8. Summary of maximum dynamic responses of the tanks
Sloshing (mm) Maximum Base Shear
(MN) Maximum dis (mm)
Earthquake
name X Y Z
510 0.154
0.1 0.004
0.11 Tabas
702 0.579
0.5 0.03
0.6 Imperial Valley
348 0.105
0.06 0.004
0.07 Northridge
1900 1.187
0. 63 0.02
0.762 Kobe
910 0.872
0.95 0.035
0.61 Capemendecino
138 0.08
0.11 0.004
0.019 San Fernando
6- CONCLUSION
In this paper, a comprehensive study is carried out on rectangular liquid tanks. For this purpose, nine rectangular tanks are modeled using FE software and modal analysis and time history analysis are carried out on these tanks with aid of a suitable boundary condition. The different parameters, such as; effect of liquid height value, effect of density of liquid and effect of earthquake with different frequencies are investigated. Outputs of the tanks were including displacement, stress, sloshing and base shear. Based on the results and discussions presented in this study, the following conclusions can be reached.
1- The results showed that the maximum displacement was obtained in tank No.1 wall with (Hl/Hw) =0.75 and also the minimum displacement is obtained in tank wall with (Hl/Hw) =0.125.
-0.15 -0.1 -0.05 0 0.05 0.1 0.15 0.2
0 5 10 15 20 25 30 35
Base
sh
ear
(M
N)
[image:18.595.82.517.434.546.2]The results show that an increase in height leads to an increase in displacement along the layer of the wall. Based on the observation, when the liquid height increases by two times, the absolute maximum values of stress, displacement, base shear and sloshing increase by 1.65, 2.04, 2.05 and 1.34, respectively.
2- The maximum value of stress was obtained in tank which has higher liquid level and the lowest stress was obtained in tank which has less liquid level.
3- According to results obtained from comparison of different liquid densities show that an increase in density leads to an increase in values of displacements, stress and base shear. This increase has a close relation with the values of increase in density, while values of sloshing increase with decrease in density.
4- This study showed that an increase in the level of liquid leads to an increase and decrease in the convective frequencies and impulsive frequencies, respectively. In addition, liquid density has no effect on convective frequencies. It was indicated that decreasing in the density leads to an increase in the value of impulsive frequencies.
5- Comparison of different earthquake with different PGA, duration and content frequency showed that the PGA of an earthquake plays a significant role in results. However, the earthquake frequency content is another vital parameter for structural responses of storage tanks. Based on the results, when the PGA increases by 10.7 times, the maximum displacements, stress, sloshing and base shear become 11.4, 22.6, 5.46 and 17.8 times, respectively.
6- A unique trend was observed under low frequency content ground motion for tanks. In fact, In this case, the trend for tank is similar to the trend for static analysis, while along the high frequency content earthquake, the values of stress in lowest and highest part of the tanks are considerably more than values at the middle of the tank.
REFERENCES
ACI Committee 350.3-06. 2009. Seismic design of liquid-containing concrete structures (ACI 350.3-06) and commentary (ACI 350.3R-06), Farmington Hills (MI, USA): American Concrete Institute.
Akatsuka, H. and Kobayashi, H. 2010. Fire of petroleum tank, etc. by Niigata earthquake, Failure Knowledge Database, Japan Science and Technology Agency.
Amiri, M. and Sabbagh-Yazdi, S.R., 2011. Ambient vibration test and finite element modeling of tall liquid storage tanks. Thin-walled structures, 49(8), pp.974-983.
ANSYS, Inc. 2009. ANSYS Release 12.0 Documentation, USA.
Bayraktar, A., Sevim, B., Altunışık, A., and Türker, T., 2010. Effect of the model updating on the earthquake behavior of steel storage tanks. Journal of Constructional Steel Research, 66:3 462-469. Chen J.Z., Kianoush M.R. 2005. Seismic response of concrete rectangular tanks for liquid containing
structures. Can J Civ Eng 32 739–52.
Chopra A.K, 2000. dynamics of structures, theory and applications to earthquake engineering. 2nd Ed, Prentice-Hall.
Epstein, H.I. 1976. Seismic design of liquid storage tanks. Journal of the Structural Division ASCE 102, 1659–1673.
Firouz-Abadi, R.D., Haddadpour, H., Noorian, M.A. and Ghasemi, M., 2008. A 3D BEM model for liquid sloshing in baffled tanks. International journal for numerical methods in engineering, 76(9), pp.1419-1433. Goudarzi, M.A. and Danesh, P.N., 2016. Numerical investigation of a vertically baffled rectangular tank
under seismic excitation. Journal of Fluids and Structures, 61, pp.450-460.
Haroun M.A. and Tayel M.A. 1985. Response of tanks to vertical seismic excitations. Earthquake Engineering and Structural Dynamic, 13 583–95.
API650-2008 provisions with FEM analyses for seismic assessment of existing steel oil storage tanks. Journal of Loss Prevention in the Process Industries, 26(4), pp.666-675.
Hosseinzadeh, N., Sangsari, M.K. and Ferdosiyeh, H.T., 2014. Shake table study of annular baffles in steel storage tanks as sloshing dependent variable dampers. Journal of Loss Prevention in the Process Industries, 32, pp.299-310.
Housner, G..W. 1963. The dynamic behavior of water tanks. Bulletin of the Seismological Society of America, 53:2, 381_7.
Kianoush, M.R and Chen, J.Z. 2006. Effect of vertical acceleration on response of concrete rectangular liquid storage tanks Eng Struct 28(5):704–15.
Kianoush, M.R. and Ghaemmaghami, A.R. 2011. The effect of earthquake frequency content on the seismic behavior of concrete rectangular liquid tanks using the finite element method incorporating soil–structure interaction. Engineering Structures 33, 2186–2200.
Korkmaz, K.A., Sari, A. and Carhoglu, A.I. 2011. Seismic risk assessment of storage tanks in Turkish industrial facilities. J Loss Prev Process Ind 24:4, 314–20.
Livaoglu, R. 2008. Investigation of seismic behavior of fluid–rectangular tank–soil/ foundation systems in frequency domain. Soil Dynamics and Earthquake Engineering, 28, 132–146.
Moslemi, M. and Kianoush, M.R. 2012. Parametric study on dynamic behavior of cylindrical ground-supported tanks. Engineering Structures, Elsevier, Volume 42, Pages 214-230.
Nayak, S.K. and Biswal, K.C., 2016. Nonlinear seismic response of a partially-filled rectangular liquid tank with a submerged block. Journal of Sound and Vibration, 368, pp.148-173.
NZSEE. 2009. Seismic design of storage tanks. recommendations of a study group of the New Zealand national society for earthquake engineering (NZSEE).
Ormeño, M., Larkin, T., & Chouw, N., 2015. Evaluation of seismic ground motion scaling procedures for linear time-history analysis of liquid storage tanks. Engineering Structures 102: 266-277.
Park, J.H., Bae, D. and Oh, C.K., 2016. Experimental study on the dynamic behavior of a cylindrical liquid storage tank subjected to seismic excitation. International Journal of Steel Structures, 16(3), pp.935-945. Ruiz, R. O., Lopez-Garcia, D., & Taflanidis, A. A., 2015. An efficient computational procedure for the
dynamic analysis of liquid storage tanks. Engineering Structures 85: 206-218.
Ramazan Livaoglu., Tufan Cakir., Adem Dogangun. and Mustafa Aytekin.. 2011. Effects of backfill on seismic behavior of rectangular tanks”, Ocean Engineering 38, pp. 1161–1173.
Rezaiee-Pajand, M. and Kazemiyan, M.S., 2016. Analytical solution for free vibration of flexible 2D rectangular tanks. Ocean Engineering, 122, pp.118-135.
Rosenblueth E., Newmark N.M.. 1971. Fundamentals of earthquake engineering, Englewood Cliffs, NJ: Prentice-Hall.
Sezen, H. Livaoglu, R. and Dogangun, A. 2008. Dynamic analysis and seismic performance evaluation of above-ground liquid containing tanks, J Eng Struct 30, 794–803.
Sezen H., Whittaker AS, Elwood KJ, Mosalam KM. 2003. Performance of reinforced concrete and wall buildings during the August 17, 1999 Kocaeli, Turkey earthquake, and seismic design and construction practice in Turkey. J Eng Struct; 25 (1):103–14.
Sezen, H. and Whittaker A.S. 2004. Performance evaluation of industrial facilities during the 1999 Kocaeli, Turkey earth-quake. In: Proceedings of the 13th world conference on earthquake engineering, Vancouver, Canada.
Shekari, M., Khaji, N., and Ahmadi, M. 2010. On the seismic behavior of cylindrical base-isolated liquid storage tanks excited by long-period ground motions. Soil Dynamics and Earthquake Engineering, 30:10, 968-980.
Veletsos, A.S and Kumar, A. 1984. Dynamic response of vertically excited liquid storage tanks. In: Proceedings of the eighth world conference on earthquake engineering, vol. (1), pp. 453–9.
Veletsos, A.S. and Yang, J.Y., 1977. Earthquake Response of Liquid Storage Tanks. in Advances in Civil Engineering through Engineering Mechanics, Proceedings of the Second Engineering Mechanics Specialty Conference, ASCE/EMD Specialty Conference, Raleigh, NC, pp. 1-24.
Considering Fluid and Tank Interaction. Journal of Solid Mechanics, 8(2), 435-445.