Review of applications of SIMDEUM, a stochastic drinking
water demand model with small temporal and spatial scale
Mirjam Blokker
1, Claudia Agudelo-Vera
1, Andreas Moerman
1, Peter van Thienen
1, Ilse
Pieterse-Quirijns
21 KWR Watercycle Research Institute, Nieuwegein, 3433 PE, The Netherlands 5
2 Hogeschool van Amsterdam, Amsterdam, the Netherlands
Correspondence to: Mirjam Blokker ([email protected])
Keywords: Distribution networks, drinking water demand, modelling, applications
Abstract. Many researchers have developed drinking water demand models with various temporal and spatial scales. A limited number of models are available at a temporal scale of one second and a spatial scale of a single home. Reasons for 10
building these models were described in the papers in which the models were introduced, along with a discussion on potential applications. However, the predicted applications are seldom re-examined. As SIMDEUM, a stochastic end-use model for drinking water demand, has often been applied in research and practice since it was developed, we are re-examining its applications in this paper. SIMDEUM’s original purpose was to calculate maximum demands in order to be able to design self-cleaning networks. Yet, the model has been useful in many more applications. This paper gives an 15
overview of the many fields of application of SIMDEUM and shows where this type of demand model is indispensable and where it has limited practical value. This overview also leads to an understanding of requirements on demand models in various applications.
1 Introduction
Many researchers have developed drinking water demand models with various temporal and spatial scales. Several models 20
are available at a temporal scale of one second and a spatial scale of a single home (Creaco et al. 2016). The models were introduced in papers, along with a discussion on potential applications. For the small temporal and spatial scale models, the main application was assumed to be in water quality modelling (Blokker et al. 2008b), related to discolouration, chlorine decay and contaminant propagation. However, the predicted applications are rarely re-examined. Applications are reported in papers, but an overview of which applications are of interest, and which are not, has not yet been described.
25
has a small temporal scale (1 s). There are some other non-traditional demand models that are stochastic and have a small spatial and temporal scale, see e.g. (Creaco et al. 2016). However, usually these model go only as far as the household connection and they do rely on extensive demand measurements.
In contrast, SIMDEUM has been applied often in research and practice since it was developed, and many papers have been published. SIMDEUM’s original purpose was to calculate maximum demands in order to be able to design self-cleaning 5
networks. However, SIMDEUM has been used for many more applications. The application of SIMDEUM led to an insight into, for example, the appropriate temporal and spatial scales for different applications. This paper gives an overview of the many fields of applications of SIMDEUM and shows where this type of demand model is indispensable and where it has limited practical value to use the full details of SIMDEUM. In these applications it is always possible to use SIMDEUM at a higher aggregation level.
10
This paper is structured as follows. Section 2 explains how SIMDEUM works and discusses the validation of SIMDEUM results with measurements. Each of SIMDEUM’s unique modelling aspects gives a different modelling opportunity and leads to a different field of application. Section 3 gives an overview of the various SIMDEUM applications. Section 4 reviews the various aspects, and where they are particularly valid or useful. Some applications are relevant for multiple aspects, which means that studies may be touched upon multiple times in Sections 3 and 4.
15
2 Introduction of SIMDEUM
2.1 Basic description of SIMDEUM
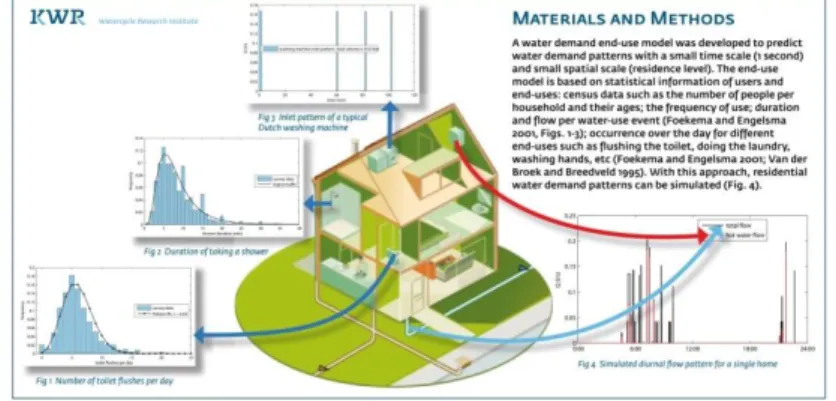
SIMDEUM (Blokker 2010; Blokker et al. 2010c) is a stochastic model based on input parameters with a physical meaning, related to water using appliances (typical flows and volumes) in the home, household composition (number of people, ages), and consumers’ water using behaviour (number of toilet flushes, duration of shower, preference over the day for water using 20
activities, etc.). SIMDEUM is not based on flow measurements, but on surveys of household’s occupancy, household appliances, and people’s behaviour with respect to water (Foekema and Engelsma 2001; Van der Broek and Breedveld 1995). SIMDEUM generates demand patterns for cold and hot water use at the tap. Figure 1 shows some examples of inputs and outputs of SIMDEUM. Its spatial scale is the tap, and it can be aggregated to the scale of a single household and an apartment building or street, e.g. by applying a bottom-up approach of demand allocation in a hydraulic model where each 25
node has its own unique set of stochastic demand patterns. Its temporal scale is one second, and can also be aggregated. SIMDEUM thus has some unique aspects in which it differs from traditional demand models: its physical basis, its stochastic nature, its small spatial scale (the customer’s tap) and small temporal scale (1 s). And SIMDEUM leads to realistic demands and realistic variations in demands, both over the day as between days and between demand nodes (see Section 2.2), at various aggregation levels from 1 second to 1 hour, and from a single household to a small town.
30
(Blokker et al. 2011b). Other types of non-residential demand can easily be generated with SIMDEUM; the required information of these non-residential buildings is information per functional room of occupants, the water using appliances and an estimate of water using behaviour. A next development step was SIMDEUM HW for hot water demand and the related energy demand (Pieterse-Quirijns et al. 2015). SIMDEUM HW takes into account heat losses in the pipes and hot water device, and can show the benefit of a shower heat recovery system. A last development was SIMDEUM WW for 5
waste water discharge patterns (Pieterse-Quirijns et al. 2012). SIMDEUM WW includes thermal energy of the waste water and nutrient load, again determined by the end-use.
Figure 1. Basic explanation of how SIMDEUM DW works.
2.2 SIMDEUM validations
10
SIMDEUM was validated on several of its unique aspects in various studies over the years. The maximum demand in various time steps (per second, per minute, per hour, per day), the number of pulses per day and the number of clock hours per day when there is water use was compared to measurements on a single household level and the aggregation level of 30-45 homes for the Netherlands (Blokker et al. 2010c) and Ohio, USA (Ch. 5 in Blokker 2010; Blokker et al. 2008a). For the aggregated levels also the diurnal patterns and the variability over the day (by using the cumulative frequency distribution of 15
flows and flow changes between one time step and the next) were compared to measurements. A validation was also done for apartment buildings (hot and cold water) of up to 200 homes (Pieterse-Quirijns and Beverloo 2013) and for several streets where a limited set of demand measurements off the shelf was available (Blokker 2006). Specific validation measurements were also done for total and hot water use of offices, hotels and nursing homes (Pieterse-Quirijns et al. 2013b). In these specific validation measurements also some of the assumptions in the input variables, such as number of 20
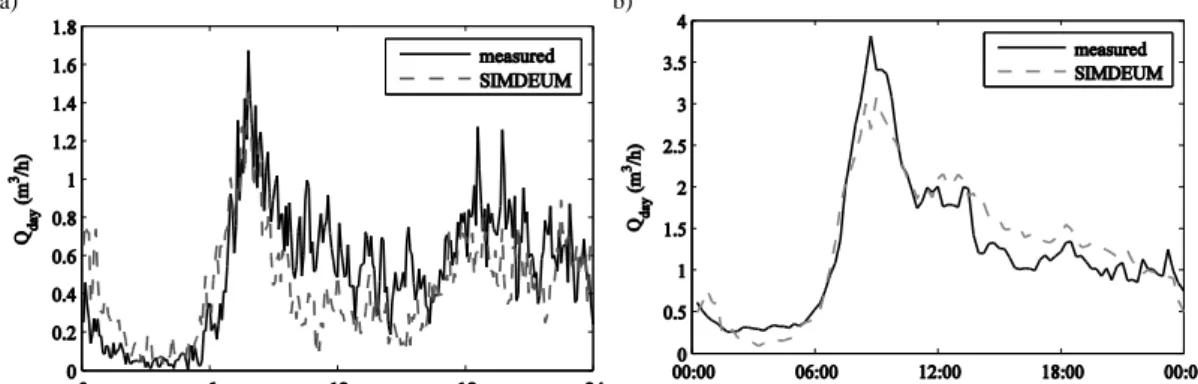
toilets per office employee, were validated. All these validations showed the power of the physical based model in generating realistic demand patterns with a realistic variability over the day and between days and a realistic prediction of maximum flows (see e.g. Figure 2). Minimum flows were predicted less well with the original SIMDEUM version. In the SIMDEUM drinking water (SIMDEUM DW) version of 2015 (Blokker and Agudelo-Vera 2015) the night flow was improved as was the midday evening demands for rural and urban residents. This was done, by adding new specific data on 25
demand in residences (SIMDEUM HW) and waste water discharge (SIMDEUM WW) patterns were not yet validated with specific measurements.
a) b)
Figure 2. Comparison between average measured demand pattern and SIMDEUM DW generated pattern; a) 5 minute demands of the sum of 45 homes (Blokker et al. 2010c); b) 15 minute demands of nursing home (Blokker et al. 2011b).
The stochastic aspect (i.e. the variability of demands) was also validated. The effect of stochastic demands in a hydraulic 5
model on the residence time towards all model nodes and the variability in residence time over the day and between days was validated in two networks with NaCl tracer tests (Blokker et al. 2011a; Blokker et al. 2010a). It compared the use of SIMDEUM in a so called bottom-up approach of demand allocation to the traditional top-down demand allocation, that uses a pumping station multiplier pattern in combination with annual water meter readings. More specifically, with SIMDEUM the variation of demand between days was taken into account by analysing multiple (stochastic) model runs. The results 10
showed that the SIMDEUM-model approach gives a much better insight into actual residence time, especially in the periphery of the DWDS (drinking water distribution system), and also in the variability of the residence time (Figure 3).
Figure 3. Measured and modelled water age at 4 locations, ModelTD: model with top-down demand allocation, ModelBU: model
with bottom-up demand allocation of SIMDEUM patterns. The 95% confidence interval is due to variation, not to uncertainty 15
3 Overview of SIMDEUM applications
3.1 Water quantity modelling
SIMDEUM is used to generate realistic drinking water demand patterns and these are able to provide insight into various aspects that are related to water quantity, such as hydraulic network modelling, leakage modelling and transient modelling. Hydraulic network models are used to study effects on network pressures and flows through the DWDS. The results very 5
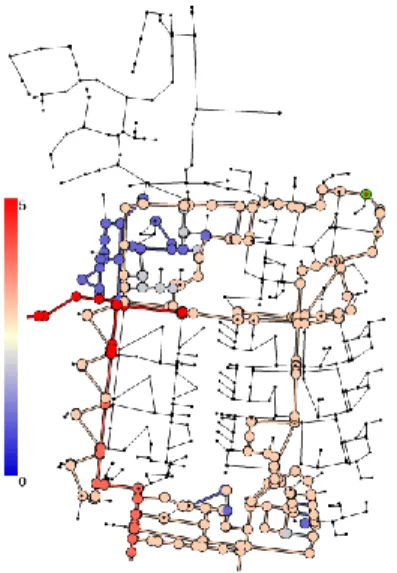
much depend on the demand patterns that are used. The bottom-up approach of (SIMDEUM) demand allocation and the comparison to the traditional top-down demand allocation (Blokker et al. 2011a; Blokker et al. 2010a), allowed studying how more realistic demands lead to different maximum flow velocities, flow direction reversals (Figure 4) and residence time in the network (Ch 8 in Blokker 2010). In a transition between full stochastic bottom-up demand allocations and full deterministic top-down demand allocation (see section 2.2) it was found that the use of specific (deterministic) demand 10
patterns for a total of 20 different types of users, such as hotels, schools, restaurants etc. was a good approach. SIMDEUM was used to generated these specific patterns (Pieterse-Quirijns 2014) and a model study showed that by using this demand pattern library in a hydraulic model lead to a better understanding of water quality in the network (Pieterse-Quirijns and van de Roer 2013). The study showed many differences between the standard model and the model with the multiplier patterns from the library, such as different residence times, the hour of maximum flow, flow direction reversals, routes of water flow, 15
and thus contaminant propagation. The effect of changing demands on the robustness of a DWDS was also studied; Agudelo-Vera et al. (2016) showed that although there can be a significant effect on head, maximum flow velocities and residence times, the studied networks are able to cope with that.
Figure 4. Fraction of time that flow reverses in a model with (left) bottom-up allocated with SIMDEUM demands (Blokker 2010); and (right) top-down demand allocations. 50% means 50% of the time flow is in one direction and 50% in the other.
20
Another important aspect of water quantity is leakage. Leakage is usually not one of the end-uses that is modelled in SIMDEUM. By comparing measured and SIMDEUM generated night flows, it may be possible to assess leakage in a DWDS (van Thienen et al. 2012). Depending on the accuracy of SIMDEUM generated night flow (which was improved in
flow direction reversals
uni-directional flow 15%
25% 35% 45%
flow direction reversals
the 2015 version, see also Section 2.2), and the relative amount of leakage compared to total demand, this approach helps to identify the actual leakage, where most traditional water balancing approaches (based on comparing measurements over time) will only give insight into the change in leakage over time. The night flow in SIMDEUM is modelled by setting a certain expected total night flow percentage and as such is an input parameter. This input parameter, however, is still only known with a high uncertainty and should be studied further.
5
The effects of transients in the DWDS from changes in water demand on a small temporal scale (1s) and small spatial scale (household level) were studied (Pothof and Blokker 2012). The study showed that the effect on the discoluration risk was limited. The effect of transients on other water quality aspects should be studied further. It does require large computational capacity when each demand node has 86,400 multipliers in a diurnal pattern.
3.2 Water quality modelling 10
On top of the hydraulic network modelling, some water quality modelling was done. This involved residence time in the DWDS, chlorine decay, interpretation of water quality sensor data, temperature of the drinking water and bacterial growth, all potentially influenced by the dynamics of the hydraulics in the DWDS.
It was expected that one of the main applications of SIMDEUM would be in modelling water quality in the DWDS (Blokker et al. 2008b). Added value was shown in residence time modelling (Blokker et al. 2011a; Blokker et al. 2010a), especially in 15
the periphery of the DWDS (Figure 3, see also Section 2.2), and also in the saddle points where flow directions would change constantly. This suggested also a large effect of bottom-up demand allocation in modelling chlorine residual. There was some effect, again in the periphery of the network, but a much larger effect was notable from uncertainty in the temperature relation with chlorine decay (Blokker et al. 2013).
Backtracing contaminants that are detected on a (theoretical) sensor is also influenced by the demands in a model (van 20
Thienen et al. 2013); specifically at locations that can receive water through multiple paths and where many flow inversions occur (Figure 5). With SIMDEUM the uncertainty in backtracing a contaminant becomes evident for some locations and for other locations the variability of demand is less influential. This correlates to e.g. the changes in flow directions (Figure 4). With the help of SIMDEUM these potential sensor locations may be determined with more certainty.
The drinking water temperature is largely influenced by the temperature of the soil surrounding the DWDS and for most 25
locations the residence time in the DWDS is long enough for the drinking water temperature to be equal to the soil temperature (Blokker and Pieterse-Quirijns 2013). For locations where the residence time is relatively short, the temperature at the tap has not yet reached the soil temperature. For these locations the stochastic variation in residence time (in a street, over the day, between days) means that the temperature of the tap samples may vary a lot and the temperature model developed by KWR would be difficult to validate in this case (Blokker et al. 2014a). In contrast, the temperature in the 30
water installation. The model study showed e.g. that in the winter when the home is heated the difference between the temperature of the drinking water at the entrance of the home (the water meter) and at the kitchen tap may be as much as 2-4 °C, during the withdrawal of water.
A very preliminary attempt to model bacterial growth in the DWDS showed that validating such a model with tap samples may be very difficult as the variation between locations within a street, the variation over time in a day and the variation 5
between days could be quite significant (Blokker et al. 2014b). For Aeromonas, this variation was indeed found in tap samples (van der Wielen 2015).
Figure 5. Stacked origin map for a single sample node (upper right, green circle) for five different sets of stochastic demand patterns in the reticulation part of a medium sized city network, illustrating the effect of the stochastic nature of water demand on 10
flow patterns in the network and its impact on calculations. Red nodes occur in each of the five backtraces for the respective demand pattern sets; other colours indicate a lower (but nonzero) number of occurrences (van Thienen et al. 2013).
3.3 Design of Drinking water Distribution Systems and Drinking Water Installations
SIMDEUM was originally developed for an accurate prediction of the maximum drinking water demand and hot water demand. These parameters can then be used in the design of Drinking water Distribution Systems (DWDS) and (domestic 15
and non-domestic) Drinking Water Installations (DWI). This application requires a small temporal scale as the maximum flow per minute can be 80% of the maximum flow per second for a demand of 100 homes.
SIMDEUM has been used for the design of the self-cleaning networks (Vreeburg et al. 2009) which are designed in such a way that any particulate material that accumulates over the day is regularly resuspended due to high flow velocities during (mostly) the morning peak in demand, and the resuspended material then leaves the system through the customer’s taps by 20
together with a certain minimum diameter ensures enough pressure at the taps (Blokker et al. 2010b; Buchberger et al. 2008). Several Dutch water companies now use SIMDEUM as the base for designing their self-cleaning networks.
SIMDEUM has been used for the design of the DWI of apartment buildings non-domestic buildings (Agudelo-Vera et al. 2013a; Pieterse-Quirijns and Beverloo 2013; Pieterse-Quirijns et al. 2013b) where insight into maximum daily drinking water demand and maximum daily hot water demand together with a requirement on minimum and maximum flow 5
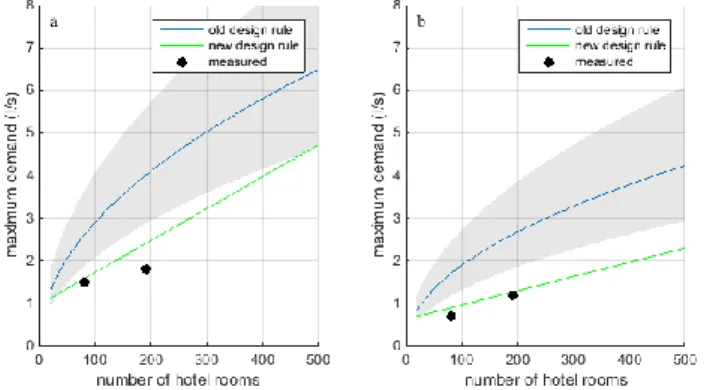
velocities leads to a certain pipe diameter; the maximum demand on hot water in 10 minutes, one hour or one day is used to determine the most appropriate hot water device. The design rules following from SIMDEUM were validated (see Section 2.2, Figure 6) and are now in the official Dutch guidelines of the design of DWI for apartment buildings and non-domestic buildings (ISSO-kontaktgroep 2015). A research project was also done for the design of hot water devices in residential DWI (Pieterse-Quirijns et al. 2015). This study showed that hot water devices can be designed much smaller, thus reducing the 10
waste of energy, when realistic water demands are taken into account. The current Dutch building regulation is based on floor space only; SIMDEUM can complement this as it can also take into account the presence and behaviour of residents.
Figure 6. Maximum design flow for hotels depending on number of rooms for a) cold water and b) hot water. The old design rule officially was the upper limit of the coloured area, but in practice the line in the middle or even the lower limit of the coloured area 15
was used depending on the design expertise. The new design rule is based on SIMDEUM (ISSO-kontaktgroep 2015). The measurements fit the new design rule well (graph based on data from Pieterse-Quirijns et al. 2013a).
With SIMDEUM WW it is also possible to determine the discharge of (non-)domestic waste water. In studying sustainability concepts of water saving , using light grey water and rain water for flushing toilets and the laundry, SIMDEUM was used to balance supply and demand both at the level of a single home and an apartment building (Agudelo-Vera et al. 2014; 20
Agudelo-Vera et al. 2013c; Pieterse-Quirijns et al. 2012). The study showed that adaptation of water saving appliances are the most sustainable option, compared to rain water harvesting. It also showed that the design of systems for reuse of grey water or rainwater is highly sensitive to the demand pattern and the use of realistic patterns simulated with SIMDEUM can lead to a smaller tank size or to a better estimation of the harvesting potential. It also showed that in the Netherlands the size of the necessary storage tank can be much smaller when light grey water is used than when rain water only is used as an 25
3.4 Prediction of future water demand
Due to the physical basis of SIMDEUM, it can be used to generate future water demand patterns. For example, SIMDEUM can model future demographic changes and changes in household occupancy, changes in behaviour of people (due to legislation or awareness), increase of luxurious (non-water efficient) devices, or increase of water saving appliances (Agudelo-Vera et al. 2013b; Blokker et al. 2012). Because SIMDEUM is based on the understanding of end-uses it is able to 5
model trend breaks in water use, unlike models that are based on measurements of current and historic water use. SIMDEUM can thus simulate specific scenarios, relevant for climate change studies, for instance the water demand on a warm summer day with the increased use at the outside tap. SIMDEUM acts as a predictive model in the design phase of new buildings as well as in the phase where water use is changing. These forecasted demands may then be used to design future DWDS and DWI or to check the robustness of existing DWDS under changing demands (Figure 7). A study showed 10
that future demands are uncertain but a range of demand scenarios can be taken into account and uncertainty of the future can thus be incorporated into transitions in the (design of the) DWDS (Blokker et al. 2015).
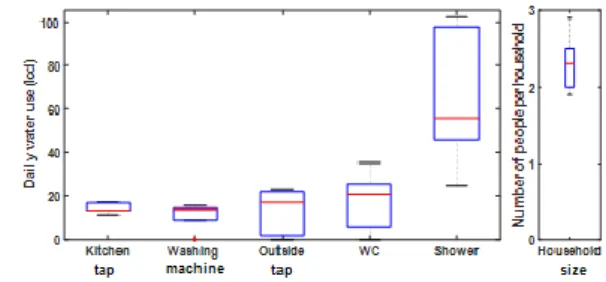
Figure 7. The range of simulated daily water consumption for a selection of end-uses and household sizes for twelve future demand scenarios used in a stress-test (Agudelo-Vera et al. 2016).
15
3.5 Research in the DWDS
SIMDEUM has also proven to be of use in research. It is impossible to measure flows at all times at all locations in the DWDS, but with the use of SIMDEUM a hydraulic model can provide this information. This type of modelling has provided insight into the self-cleaning effect and shown that the self-cleaning velocity that has to be reached at 50% of the days is 0.20 to 0.25 m/s in the tertiary network (Blokker et al. 2011c; Blokker et al. 2010b; Schaap and Blokker 2011). As with 20
SIMDEUM a better prediction of residence time will be available, the studying of the relation between residence time and water quality may also improve (Blokker et al. 2016; Mounce et al. 2016).
4 Discussion of SIMDEUM aspects
4.1 The physical based input
The fact that SIMDEUM is based on knowledge of water using behaviour and water appliances instead of water flow 25
used in the design phase. SIMDEUM provides insight into what the influence would be of changes in technical specifications or in water using behaviour on total and maximum demand, and thus provides information on what to focus on in water saving campaigns.
Furthermore, SIMDEUM generates customized drinking water demand patterns that can be revised or updated regularly without the need to perform extended demand measurements. The regular survey of Dutch residential drinking water use 5
suffices.
4.2 The stochastic aspect
The stochastic aspect of SIMDEUM provides the user with multiple possible demands. This is essential in designing the DWDS and DWI to determine the maximum demands that occur only once per year, and has much added value in modelling water quality in the DWDS to determine true residence times and flow direction reversals (including the variation between 10
days) and how these may influence the interpretation of sensors. The important conclusion of these studies is that the variability of demand adds extra understanding which is not reached with deterministic demand models.
4.3 The small spatial and temporal scale
There is a correlation between the variability in demand (stochastic aspect), the temporal scale and spatial scale. Both the cross correlation between demand patterns and the lag-1 autocorrelation increase with an increase in the spatial scale (Ch. 2 15
in Blokker 2010 ). This aspect is very much related to the choice for the bottom-up approach of demand allocation (each connection has its own unique demand pattern) or the top-down approach of demand allocations (similar types of connections have the same demand multiplier pattern) in modelling the DWDS. The cross correlation between demand patterns increases with an increase in the temporal scale; the lag-1 auto correlation is more or less stable for a temporal scale of 15 minutes or more but is a lot higher for a temporal scale of less than 5 minutes (Ch. 2 in Blokker 2010 ). It does not 20
seem to make sense to model with a small temporal scale in a DWDS when the spatial scale is large.
SIMDEUM can provide insight into when a bottom-up approach of demand allocation in a hydraulic network is required and when a top-down approach is good enough. It was shown that depending on the number of household connection that a pipe feeds, the bottom-up approach can lead to differences in (maximum) residence time, in the number of flow direction reversals, in amount of stagnant water and laminar flows and in maximum flow velocities (Ch. 8 in Blokker 2010). This type 25
of model is required in the extremities (dead-end pipes) of the DWDS when modelling water quality (residence time, sensor interpretation, etc.).
The spatial scale of SIMDEUM actually is the tap level, so even smaller than what is used in modelling the DWDS. This mean that also hydraulics, and water quality, in the DWI can be simulated in a hydraulic network model. The design of DWI pipes and of hot water devices can be improved.
30
for the design (Buchberger et al. 2008). It was shown that for modelling residence time in the DWDS the standard time step of 1 hour is too coarse and a time step of 15 minutes or less is required to accurately predict residence time at locations in the DWDS with several homes connected to it, for the locations where only a few homes are connected a 5 minute time step seems a better choice. The fact that a model with a 1 second time step was available allowed for studying the effect of transients on discolouration issues.
5
4.4 The realistic results
All of the above aspects are only valid when SIMDEUM leads to realistic results. The validation of demand patterns, maximum demand values and resulting residence times shows that SIMDEUM results are realistic. The advantage is that this allows to use SIMDEUM patterns in laboratory setups, such as the DWI lab setup at TU Delft (Vreeburg et al. 2012) or the Vitens scale model of a DWDS (KWR 2015).
10
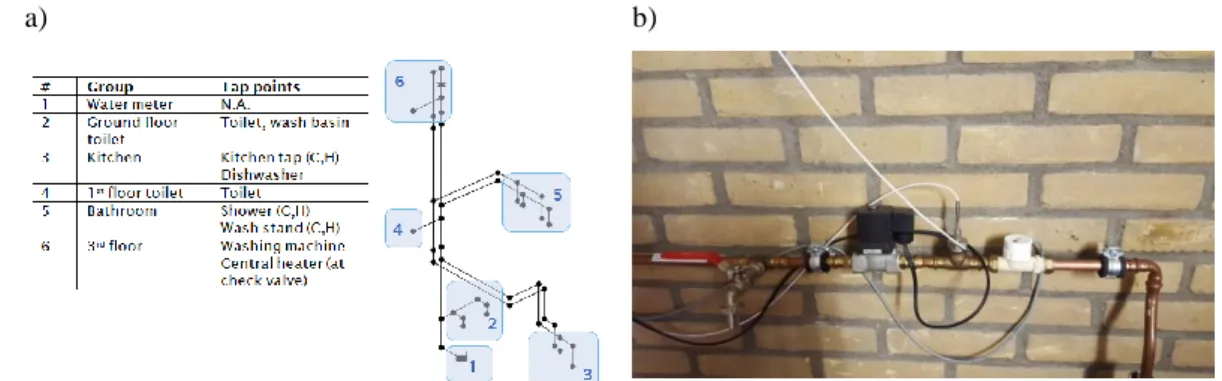
a) b)
Figure 8 a) EPANET hydraulic model of DWI (Moerman et al. 2014); b) Detailed view of one tap in the DWI experimental setup. From left to right: sampling tap, solenoid valve, temperature sensor, flow sensor, PVC drainage pipe (below in the picture, behind the bend). The solenoid valves in the DWI were electronically operated by the use of SIMDEUM demand patterns, this one is the washing machine (Vreeburg et al. 2012).
Realistic results also enable to use model results instead of expensive measurement to estimate maximum flows when 15
studying the effect of hydraulics over time on the discolouration risk, to estimate contact times when studying microbial growth, or to have a theoretical reference for night use when detecting leakage.
4.5 Summary
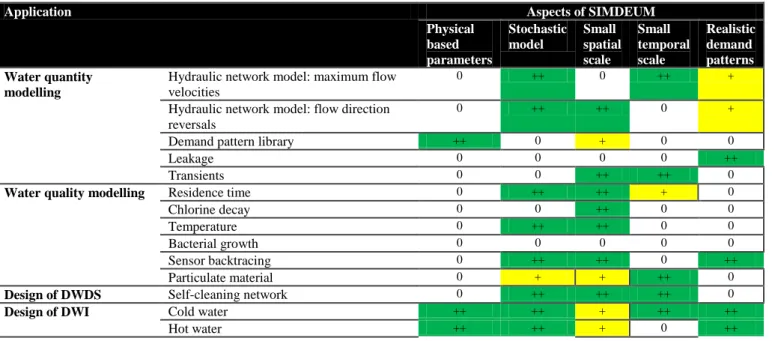
Table 1 summarises the importance of these aspects for various applications. In modelling residence time in the DWDS, the small spatial scale is where SIMDEUM bottom-up demand allocation will make a difference (++), the temporal scale that is 20
required is 5 minutes, which is smaller than with conventional demand models, but the very small time step of 1 second is not needed (+). Of course all applications need realistic demand patterns, but the table shows where SIMDEUM has added value compared to other demand models; for example this is the case in leakage modelling as conventional models often do not provide leak free reference demand patterns. At the same time, Table 1 provides an overview of the requirements on demand models in various applications.
SIMDEUM is a very versatile model. Not all aspects of SIMDEUM are relevant in all applications (Table 1). SIMDEUM did allow us to determine required aspects for various applications, such as the best spatial scale for leakage assessment. For each application it is now possible to determine what the requirements are for a demand model. If it is important that the model has a physical basis rather than a measurement basis, e.g. for future demand estimation, an end-use model is advised. SIMDEUM is such a model, but with a temporal scale of one day e.g. REUM is available (Jacobs 2004). If a stochastic 5
demand model is required, e.g. to determine variation in residence time or to find the maximum demand for design purposes, next to SIMDEUM there is the PRP-model and derivative models (for an overview, see Creaco et al. 2016). If a spatial scale of the tap is required, SIMDEUM is the only model that the authors are aware of; if a spatial scale at the household level is required the PRP and derivatives may be used. If a spatial scale at the street or DMA level is required, an aggregation of SIMDEUM patterns can be used or a direct model at this level can be used (PRP or DMA measurements). If a temporal scale 10
of 1 second is required SIMDEUM appears to do better than PRP (Creaco et al. 2016). If a temporal scale of 1-5 minutes is required, an aggregation of SIMDEUM patterns can be used or a direct model at this level can be used (PRP or measured demands). If a temporal scale of 15 minutes or more is required, probably measurements based demands are good enough. If realistic demand patterns are required, including the realistic variability, e.g. for sensor interpretation, the selected model must be fit for the study site. SIMDEUM has not been widely used outside of the Netherlands. It is expected that many of the 15
Dutch input parameters may be reused, but a validation on the best parameter values and the results of SIMDEUM elsewhere is recommended (Ch. 5 in Blokker 2010).
Table 1. Importance of SIMDEUM aspects for various applications. ++/+ indicates that this aspect is either of great importance for the application or that for this aspect of the application SIMDEUM can be used. ++ indicates the aspect is essential, + indicates the 20
aspect is important, but not to its full extend. A ‘0’ means this aspect is of a lesser influence.
Application Aspects of SIMDEUM
Physical based parameters Stochastic model Small spatial scale Small temporal scale Realistic demand patterns Water quantity modelling
Hydraulic network model: maximum flow velocities
0 ++ 0 ++ +
Hydraulic network model: flow direction reversals
0 ++ ++ 0 +
Demand pattern library ++ 0 + 0 0
Leakage 0 0 0 0 ++
Transients 0 0 ++ ++ 0
Water quality modelling Residence time 0 ++ ++ + 0
Chlorine decay 0 0 ++ 0 0
Temperature 0 ++ ++ 0 0
Bacterial growth 0 0 0 0 0
Sensor backtracing 0 ++ ++ 0 ++
Particulate material 0 + + ++ 0
Design of DWDS Self-cleaning network 0 ++ ++ ++ 0
Design of DWI Cold water ++ ++ + ++ ++
Application Aspects of SIMDEUM Physical
based parameters
Stochastic model
Small spatial scale
Small temporal scale
Realistic demand patterns
Fit for purpose source ++ ++ ++ + ++
Prediction of future demands
Design ++ 0 0 0 0
Water saving effect ++ + 0 0 0
Robustness check of DWDS + ++ 0 0 0
Research in the DWDS Water quality in relation to hydraulics 0 + ++ ++ 0
Lab setup DWI ++ 0 ++ + 0
Lab setup DWDS 0 + + + 0
5 Conclusions
SIMDEUM, with its stochastic approach of demand simulation, with a physical basis of its input parameters at a small temporal and spatial scale, has had much added value to understand and simulate current and future water demand. A decade after its first introduction, the use of SIMDEUM has allowed to better simulate the processes in the DWDS, to improve the design of DWI and has supported decision making by playing a role in the development of new design guidelines. This paper 5
provides an overview of which aspects are required for various applications. Some applications rely on the physical basis of SIMDEUM, others on the stochastic nature and small temporal and spatial scale that SIMDEUM provides. This overview leads to an understanding of requirements on demand models in various applications, Table 1.
SIMDEUM is a versatile model that has been used in various fields of application and it is expected that more is still to come. The fields of application are not restricted to the water cycle extend to the water-energy nexus and the circular 10
economy concept.
6 References
Agudelo-Vera, C., Blokker, E. J. M., Pieterse-Quirijns, E. J. and Scheffer, W. (2014). "Water and energy nexus at the building level." REHVA European HVAC Journal(January), 12-15
Agudelo-Vera, C., Blokker, M., Vreeburg, J., Vogelaar, H., Hillegers, S. and van der Hoek, J. P. (2016). "Testing the 15
Robustness of Two Water Distribution System Layouts under Changing Drinking Water Demand." Journal of Water Resources Planning and Management, 05016003.
Agudelo-Vera, C., Pieterse-Quirijns, E. J., Scheffer, W. and Blokker, E. J. M. (2013a). "New method to design domestic water systems." REHVA Journal, december 2013, 12-16
Agudelo-Vera, C. M. (2012). Dynamic water resource management for achieving self-sufficiency of cities of tomorrow. 20
Agudelo-Vera, C. M., Blokker, E. J. M., Büscher, C. H. and Vreeburg, J. H. G. (2013b). "Analysing the Dynamics of Transitions in Residential Water Consumption in the Netherlands." International Water Week Amsterdam 2013, Amsterdam.
Agudelo-Vera, C. M., Keesman, K. J., Mels, A. R. and Rijnaarts, H. H. M. (2013c). "Evaluating the potential of improving residential water balance at building scale." Water Research, 47(December), 7287-7299.
25
Blokker, E. J. M. (2006). Modelleren van afnamepatronen; beschrijving en evaluatie van simulatiemodel SIMDEUM, Kiwa N.V., Nieuwegein. BTO 2006.010.
Blokker, E. J. M. (2010). "Stochastic water demand modelling for a better understanding of hydraulics in water distribution networks," Delft University of Technology.
Blokker, E. J. M. and Agudelo-Vera, C. A. (2015). "Doorontwikkeling SIMDEUM." BTO 2015.210(s), KWR, Nieuwegein. 5
Blokker, E. J. M., Beverloo, H., Vogelaar, A. J., Vreeburg, J. H. G. and van Dijk, J. C. (2011a). "A bottom-up approach of stochastic demand allocation in a hydraulic network model; a sensitivity study of model parameters." Journal of Hydroinformatics, 13(4), 714-728, doi:10.2166/hydro.2011.067.
Blokker, E. J. M., Buchberger, S. G., Vreeburg, J. H. G. and van Dijk, J. C. (2008a). "Comparison of water demand models: PRP and SIMDEUM applied to Milford, Ohio, data." WDSA 2008, J. E. van Zyl, A. A. Ilemobade, and H. E. 10
Jacobs, eds., Kruger National Park, South Africa, 182 - 195.
Blokker, E. J. M., Büscher, C., Palmen, L. J. and Agudelo-Vera, C. (2015). "Strategic planning of drinking water infrastructure: a conceptual framework and building blocks for drinking water companies." BTO 2015.048, KWR, Nieuwegein.
Blokker, E. J. M., Horst, P., Moerman, A., Mol, S. and Wennekes, R. (2014a). "Haalbaarheid van maatregelen tegen 15
ongewenste opwarming van drinkwater in het leidingnet - TKI Project Calorics." KWR 2014.057, KWR, Nieuwegein.
Blokker, E. J. M. and Pieterse-Quirijns, E. J. (2013). "Modeling temperature in the drinking water distribution system." Journal - American Water Works Association, 105(1), E19-E29.
Blokker, E. J. M., Pieterse-Quirijns, E. J., Vogelaar, A. and Sperber, V. (2014b). "Bacterial growth model in the drinking 20
water distribution system. An early warning system." PREPARED 2014.023, Prepared.
Blokker, E. J. M., Pieterse-Quirijns, E. J., Vreeburg, J. H. G. and van Dijk, J. C. (2011b). "Simulating Nonresidential Water Demand with a Stochastic End-Use Model." Journal of Water Resources Planning and Management, 137(6), 511-520.
Blokker, E. J. M., Schaap, P. G. and Vreeburg, J. H. G. (2011c). "Comparing the fouling rate of a drinking water distribution 25
system in two different configurations." CCWI 2011 Urban Water Management: Challenges and Opportunities, D. Savic, Z. Kapelan, and D. Butler, eds., Centre for Water Systems, University of Exeter, Exeter, 583-588.
Blokker, E. J. M., Vreeburg, J. and Speight, V. (2013). "Residual chlorine in the extremities of the drinking water distribution system: the influence of stochastic water demands." 12th International Conference on Computing and Control for the Water Industry, Perugia, Italy.
30
Blokker, E. J. M., Vreeburg, J. H. G., Beverloo, H., Klein Arfman, M. and van Dijk, J. C. (2010a). "A bottom-up approach of stochastic demand allocation in water quality modelling." Drink. Water Eng. Sci., 3(1), 43-51.
Blokker, E. J. M., Vreeburg, J. H. G., Buchberger, S. G. and van Dijk, J. C. (2008b). "Importance of demand mode lling in network water quality models: a review." Drink. Water Eng. Sci., 1(1), 27-38.
Blokker, E. J. M., Vreeburg, J. H. G., Schaap, P. G. and van Dijk, J. C. (2010b). "The self-cleaning velocity in practice." 35
WDSA 2010, ASCE, Tuscon, AZ.
Blokker, E. J. M., Vreeburg, J. H. G. and van Dijk, J. C. (2010c). "Simulating residential water demand with a stochastic end-use model." Journal of Water Resources Planning and Management, 136(1), 19-26, doi:10.1061/(ASCE)WR.1943-5452.0000002.
Blokker, M., Vloerbergh, I. and Buchberger, S. (2012). "Estimating peak water demands in hydraulic systems II – Future 40
trends." WDSA 2012, Adelaide, Australië, 1138-1147.
Buchberger, S. G., Blokker, E. J. M. and Vreeburg, J. H. G. (2008). "Sizes for Self-Cleaning Pipes in Municipal Water Supply Systems." WDSA 2008, J. E. van Zyl, A. A. Ilemobade, and H. E. Jacobs, eds., ASCE, Kruger Park, South Africa, 338-347.
Creaco, E., Blokker, E. J. M. and Buchberger, S. (2016). "Models for generating household water demand pulses: literature 45
review and comparison." WDSA 2016, Catagena de India, Colombia.
Foekema, H. and Engelsma, O. (2001). Een ander consumptiepatroon (het waterverbruik thuis 2001), TNS NIPO, Amsterdam. in opdracht van VEWIN.
ISSO-kontaktgroep. (2015). ISSO-Publicatie 55 Leidingwaterinstallaties voor woon- en utiliteitsgebouwen, Stichting ISSO, Rotterdam.
Jacobs, H. E. (2004). A conceptual end-use model for residential water demand and return flow, RAU, Johannesburg, Zuid-Afrika.
KWR https:// www.kwrwater.nl/en/actueel/kwr-hands-over-a-scientific-scale-model-of-the-leeuwarden-distribution-network-to-vitens/, 30 June 2016
Moerman, A., Blokker, E. J. M., Vreeburg, J. and van der Hoek, J. P. (2014). "Drinking water temperature modelling in 5
domestic systems." 16th Conference on Water Distribution System Analysis, WDSA.
Mounce, S. R., Blokker, E. J. M., Husband, S. P., Furnass, W. R., Schaap, P. G. and Boxall, J. B. (2016). "Multivariate data mining for estimating the rate of discolouration material accumulation in drinking water distribution systems." IWA Journal of Hydroinformatics, 18(1), 96-114.
Pieterse-Quirijns, E. J. (2014). "Manual SIMDEUM Pattern Generator: Tool for water demand and discharge patterns for 10
residential and non-residential buildings." KWR 2014.075, KWR, Nieuwegein.
Pieterse-Quirijns, E. J., Agudelo-Vera, C. M. and Blokker, E. J. M. (2012). "Modelling sustainability in water supply and drainage with SIMDEUM®." CIB W062 Water supply and drainage for buidlings, Edinburgh, GB.
Pieterse-Quirijns, E. J. and Beverloo, H. (2013). "Validatie rekenregels voor waterverbruik woontorens." KWR 2013.016, KWR, Nieuwegein.
15
Pieterse-Quirijns, E. J., Beverloo, H. and van Loon, A. (2013a). "Validatie rekenregels voor waterverbruik hotels." KWR 2013.018, KWR, Nieuwegein.
Pieterse-Quirijns, E. J., Blokker, E. J. M., van der Blom, E. and Vreeburg, J. H. G. (2013b). "Non-residential water demand model validated with extensive measurements and surveys." Drink. Water Eng. Sci., 6(2), 99-114, doi:10.5194/dwes-6-99-2013.
20
Pieterse-Quirijns, E. J. and van de Roer, M. (2013). "Verbruikspatronenbibliotheek." BTO 2013.058, KWR, Nieuwegein. Pieterse-Quirijns, I., Moerman, A., Slingerland, E., de Groote, W. and Blokker, E. J. M. (2015). "Sustainable design of
building's installations by taking into account real drinking water use." Proc. of the 32nd CIB Conference, Eindhoven, the Netherlands.
Pothof, I. W. M. and Blokker, E. J. M. (2012). "Dynamic hydraulic models to study sedimentation in drinking water 25
networks in detail." Drink. Water Eng. Sci., 5(1), 87-92, doi:10.5194/dwes-5-87-2012.
Schaap, P. G. and Blokker, E. J. M. (2011). "Carefully designed measurements provide insight into sediment build-up in drinking water distribution systems." CCWI 2011 Urban Water Management: Challenges and Opportunities, D. Savic, Z. Kapelan, and D. Butler, eds., Centre for Water Systems, University of Exeter, Exeter, 601-606.
Van der Broek, A. and Breedveld, K. (1995). Tijdsbestedingsonderzoek 1995 - TBO'95 [computer file], Sociaal en Cultureel 30
planbureau, SCP, Den Haag. Amsterdam, Steinmetz-archief (P1383).
van der Wielen, P. (2015). "Waarde Aeromonas en KG22 als wettelijke parameters nagroei."
van Thienen, P., Pieterse-Quirijns, I., van de Roer, M. and Vreeburg, J. (2012). "A two-way approach to leakage determination: sophisticated demand modelling and discriminative demand pattern analysis." WDSA conference, Adelaide, Australia.
35
van Thienen, P., Vries, D., de Graaf, B., van de Roer, M., Schaap, P. and Zaadstra, E. (2013). "Probalilistic backtracing of drinking water contamination events in a stochastic world." 12th International Conference on Computing and Control for the Water Industry, CCWI, Perugia, Italy.
Vreeburg, J., Zlatanovic, L. and Poznakovs, I. (2012). "Water, fire and safety: a strong relation with water quality." WDSA 2012: 14th Water Distribution Systems Analysis Conference, 24-27 September 2012 in Adelaide, South Australia, 40
1431.
Vreeburg, J. H. G., Blokker, E. J. M., Horst, P. and van Dijk, J. C. (2009). "Velocity based self cleaning residential drinking water distribution systems." Water Science & Technology, 9(6), 635-641, doi:10.2166/ws.2009.689.