Improvement of calculation methods for net
grassland production under different grassland
utilization systems
May 2016
Stijn van de Goor
Improvement of calculation methods for net
grassland production under different grassland
utilization systems
Student: Stijn van de Goor
Registration number:
Credits: 30
Code: FSE-80430
Minor Thesis
Supervisor: Dr. Egbert Lantinga
Foreword
This thesis is organized with an abstract of the thesis, a general introduction, the manuscript
with a summary and conclusions. The second part holds a literature review. The title of the
manuscript is:
Table of contents
1. Introduction ... 5
-2. Materials and Methods ... 8
-2.1. Data collection ... 8
-2.2. Calculations methods ... 9
-2.2.1. Lantinga ... 9
-2.2.2. Leisen and Thomet ... 11
-2.2.3. Kringloopwijzer ... 12
-2.2.4. New Model ... 13
-2.3. Comparison ... 15
-3. Literature review ... 18
-3.1. Introduction ... 19
-3.2. Grazing versus Cutting ... 20
-3.2.1. Economics ... 20
-3.2.2. Effect of stocking on ruminant physiology ... 21
-3.2.3. Environmental pressure grazing vs cutting ... 22
-3.3. Society ... 22
-3.4. Threats towards less grazing ... 23
-3.5. Energy and DM production ... 25
-3.6. Energy requirements for a dairy cow ... 27
-3.7. Grazing systems ... 30
-3.7.1. Continuous stocking ... 30
-3.7.2. Rotational stocking ... 30
-3.7.3. Short grazing ... 31
-3.8. Energy losses ... 32
-3.8.3. Feeding losses... 38
-3.9. Knowledge gap ... 39
-4. Results ... 40
-4.1. Energy requirements ... 40
-4.1.1. Cows ... 40
-4.1.2. Heifers and other grazers ... 41
-4.1.3. Total energy requirements ... 43
-4.2. Energy fed ... 44
-4.3. Net energy production per ha... 47
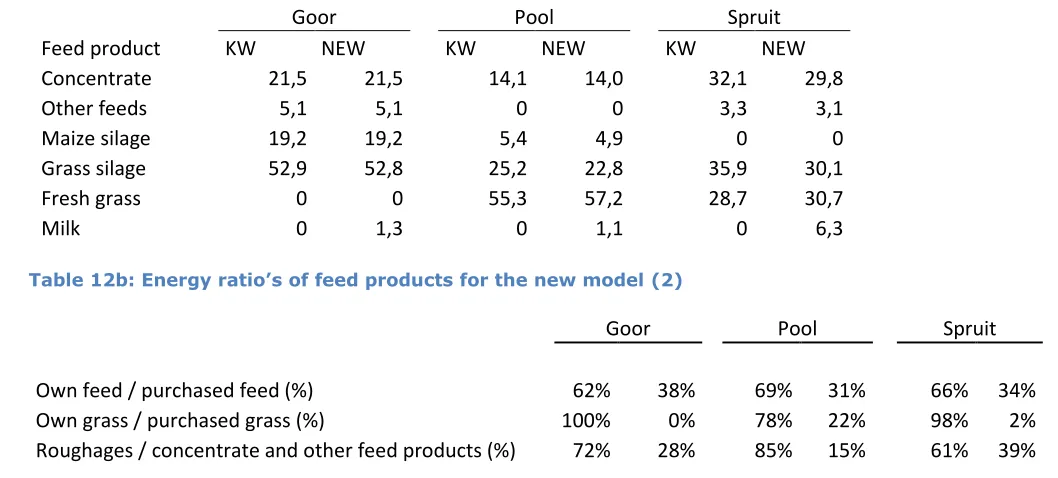
-4.4. Ratio´s of different feed products according to NEW model ... 47
-5. Discussion ... 50
-5.1. Energy requirements ... 50
-5.2. Energy fed ... 51
-5.3. Reccommendations ... 53
-6. Conclusion ... 54
Appendix 1. Handreiking BEX 1 mei 2015 ... 57
Appendix 2. Lantinga ... 64
Appendix 3. Start Supplies and end supplies ... 68
Appendix 4. Feed mutations ... 70
Appendix 5. Feed fed to the herd ... 71
Appendix 6. Expanded data for energy requirements of cows ... 73
Appendix 7. Formulas Leisen ... 76
-Abstract
Throughout Europe, grass is major source of nutrition for ruminants. Grass can be grazed, fed fresh, as silage or as hay or in a preserved form as silage or hay. Over the past years summerfeeding has increased at the cost of grazing in dairy herds. One important reason for farmers to house their animals is optimization of grassland utilization. Investigations show than summerfeeding has higher yields than grazing, but is this also the case with net production. This study
researched energetic calculation methods for the determination of net grassland production. The energy systems evaluated are the methods of Lantinga, Leisen and the KringloopWijzer (KW). The objective of this paper is to analyse, compare and check the reliability of these energy calculation methods for the determination of the net energy yield of grassland. The next step is to optimize and formulate a new model, based on the models investigated. With this new model European countries can use one calculation method for determining the net energy production from grass. It would be interesting to investigate the influence of grass management type on energy productivity.
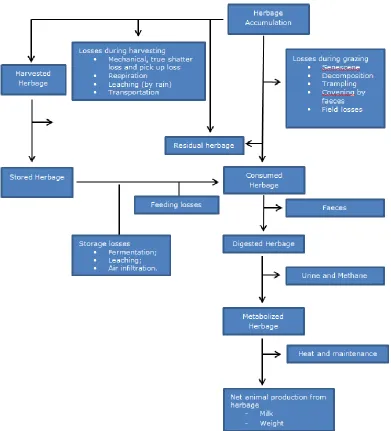
Instead of measuring the production of grass in the field, the net energy production of grassland is calculated, based on energetic requirements of the herd for maintenance, production and other additional requirements. These requirements are equal to energy consumed as concentrate, roughages and other feeds. The energy consumed from concentrate and other feeds is subtracted; the remaining energy is from roughages. The difficulty lies in calculating the energy consumed from grazing.
For Lantinga, Leisen and the NEW model the net energy from grass- and maize silage are subtracted as well. The energy remaining originates from fresh grass, in the case of summerfeeding the gap is filled with energy from grass- and maize silage depending on their ratio. The KW uses the VEM-gap calculation; here the energy originating from roughages is divided based on their ratios as calculated in the VEM-gap. In the end when all net energy flows provided are known, the fresh grass and own grass silage or hay form the net energy production of grassland.
All models are compared on three farms Goor, Pool and Spruit. Goor applies summerfeeding, Pool and Spruit apply grazing. For the farm of Goor the energy produced from grass is quite clear. All energy comes from grass silage. For the farm of Pool and Spruit however the energy consumed through fresh grass has to be calculated.
The problem with the model of Leisen is that calculations for energy requirements are only for the grazing season and not for the entire year. In Lantinga and the KW a separation is made for energy requirements during grazing and during the housing period. For Lantinga only cows were taken into account,
the farm data. Energy required for replacement and gestation and NEB were corrected for each farm. All these modifications increase the net energy production per ha.
Lastly in the new model the amount of energy consumed through grass has to be determined. Gross amounts fed to the herd for concentrate, roughages and other feeds are known through analysis. However during storage and conservation losses occur. For the models of Leisen and Lantinga these losses are fixed. This is practical but not very trustworthy as between farms and forages large deviations occur for losses. The KW corrects for these losses using the VEM-gap calculations. For summerfeeding this calculation works but in the case of grazing it does not work properly, energy consumed from either grass- or maize silage is overestimated, being higher than the gross amount provided. Thus underestimating the energy provided from fresh grass. Therefore the new model also assumes fixed losses specific for feed type.
The use of the VEM-gap in the KW overestimates energy provided through silages. Energy provided based on silages is higher than gross energy available based on silage analysis. The calculations of the VEM-gap should be modified for farms that apply grazing. Currently energy provided from fresh grass is
underestimated, lowering the net energy production per ha. Even so the KW calculates a higher net energy production per ha, due to higher requirements in cows for bonuses of replacement, inefficiency, gestation and NEB. For all models counts the larger the gap between requirements and energy fed the more energy must have been provided through roughages, increasing grass production.
1.
Introduction
Throughout Europe, grass has always been a major source of nutrition for ruminants. When produced in intensively managed systems, grass has a high nutritional value. This is seen in high concentrations of energy and protein and low levels of fibre. As for the type of feeding there are many options, grass can be fed fresh, predominantly through grazing or in a preserved form as silage or hay. In many western countries, grass is a relative inexpensive feed source for the production of milk by dairy cattle. In calculations from Dillon et al. (2005) every 10% increase in grazed grass in a dairy ration reduced milk production costs with 0.025 €/litre. The cost price of grazing is almost €0.10 per kg DM lower than for silage grass (Galama, 2013). The difference is explained by less cost for machinery, external labour and concentrates.
Secondly, grazing systems provide an environmental and animal welfare friendly image of the dairy sector. When looking at environmental effects of ruminants calculations from Bruggen and Faqiri (2015) have shown that a cow in pasture produces less ammonia than a cow housed indoors. For gasses methane and nitrous oxide expressed in CO2-equivalents the effect is negligible. The lower levels of nitrous oxide in storage are compensated for by higher levels of methane
emission (Bruggen and Faqiri, 2015). With the intensification of the dairy sector in the Netherlands and the growing distance between farmers and consumers, the image of the agricultural sector has deteriorated. The general public appreciates grazing animals in the landscape. The society associate grazing with animal welfare allowing dairy cattle to express their natural behaviour. To improve the sector’s image and to stop further drop in grazing cattle several milk factories provide bonuses to farms that have their cattle graze. For instance ongoing the 1st of January 2015 FrieslandCampina has raised the bonus from 0.50 to 1.00
euro per 100 kg milk if cows graze during 120 days, for at least 6 hours a day.
Despite these advantages there is a trend towards less grazing in most European countries. The past decades a lot of dairy farmers stopped grazing their cows. From the period 1997 to 2013 the level of Dutch cattle grazing decreased from 92% to 70% (CBS, 2013). Additional the hours of grazing among grazers is declining as well. In 1998 cows grazed for 13 hours per day, whilst in 2006 cows grazed 8 hours per day (Aarts et al., 2005).
There are several reasons for farmers to feed their cows indoor. For instance, modern, large-scale farms with high yielding dairy cattle, such as those
increasingly occurring around Europe, may reduce grazing in order to control the diet and optimise grassland utilization. A grazing system requires short-term and long-term management decisions for adequate herd feeding and pasture budgeting over the grazing season. Also the use of milk robots increases, which is more difficult to manage in combination with grazing (KOM, 2011). Aarts et al. (2008) investigated the yield of grasslands, farms that houses cows permanently indoors have 15% higher dry matter yields than farms that apply grazing.
In grass-based systems, low grass dry matter intake (DMI) of pasture has been identified as the major factor responsible for limiting milk production by high producing dairy cattle (Kolver and Muller, 1998). Cows with high milk production capacity require additional feeding to meet nutrient requirements. Reported DMI levels of early lactating dairy cows grazing high quality grass or fed on freshly cut grass rarely exceeds 19kg/d (Bargo et al., 2003) and corresponding milk production levels are some 28kg/d at maximum (Dijkstra et al., 2008). In research from Kolver and Muller (1998) high producing cows received either a pasture-only diet or a TMR. The pasture-pasture-only diet had lower intakes for total DM (19.0 vs 23.4 kg/d) and net energy for lactations. Consequently cows consuming pasture gave less milk (29.6 vs 44.1 kg/d). Cows lacked energy to produce higher levels of milk (Kolver et al., 1998).
In expectation to the milk quota abolition, farmers anticipated to a restriction of herd size based on animal rights or phosphate production of a reference year. Farmers whom otherwise would have waited invest in large stables and expand their herd size to increase milk production. Over the past decades herd size has increased severely. The average dairy farm had 42 cows in 1984 to 85 cows in 2014. Secondly in 2000, 45 dairy farms had 250 cows or more, this number has increased tremendous to 295 in 2014 (CBS, 2014). In most cases an increased milk production and herd size is not paired with an increased farm area. From the period 2003 to 2013 the average farm intensity increased from less than 15.000 to 18.000 kg/ha. The expectation is that farmers will continue to expand their herd, but not grow accordingly in hectares increasing the farm intensity to 22.000 kilogram in 2018. Increasing herd sizes makes grazing more difficult, the amount of available pasture may be inadequate, putting too much pressure on the crop and soil (Koopman, 2014). This leads to an increase in grazing pressure through higher stocking rate (SR). An increased SR limits DMI as less herbage is available per cow. In Bargo et al. (2002) pasture DMI of unsupplemented dairy cows increased from 17.7 kg/d to 20.5 kg/d as pasture allowance increased from 25 to 40 kg DM/cow per day (Bargo et al., 2002). Also milk production increased respectively with 19.1 vs 22.2 kg/d. Herbage intake can be increased by offering larger allowances, but with higher residuals in subsequent grazing (Taweel, 2006). Supplementation of concentrates lowered pasture dry matter intake (Bargo et al., 2002), thus lowering the efficiency of grassland productivity, but increase efficiency on a cow level.
In research from Lantinga et al. (1999) animal performance of cows was compared under different nitrogen fertilizer levels, however when looking at increasing days in grazing milk production in kg FPCM per cow per day decreased but milk production in kg FPCM per hectare increased. High prices for milk and low concentrate prices are economical drivers for farmers to change toward a high milk production per cow in other words summerfeeding.
From the reasons outlined above it is clear that current trends in livestock farming in Europe cause a decline in the popularity of grazing for dairy cows. Eventually each farmer has its own reasons for choosing a management system suited to their farm and wishes.
The aim of any feeding system is to provide sufficient nutrients to the animals depending on breed, age and the level of production using available feeds. Plenty of studies have been carried out on energy requirements, energy value of the diet, digestibility and utilization of energy by lactating cows. Especially around Europe new energy feeding systems were developed. Every European country has its own method for calculating energy production of grassland (Vermorel and Coulon, 1998). Current evaluation systems are based on the NEL system (France, Germany, Netherlands and US), however some are based on the metabolizable
energy (ME) content of feeds (United Kingdom, and Sweden). Differences between energy calculation systems have several origins. Possibly due to an over- or underestimation of the NE content of forages and others or because of lower efficiency of ME utilization for milk than estimated. Dijkstra et al. (2008) studied several energy evaluation systems, including the Dutch NE system (Es, 1978). In their study the estimate of the feed value of grass for milk production by dairy cattle was inaccurate. Lower energy requirements were predicted based on observed milk production than energy supply based on intake. To design optimal grass-based systems, accurate estimates of the feed value of grass are required. Current energy evaluation systems often let expect higher milk production on grass-based diets than observed (Bruinenberg et al., 2002).
animals or a sub-optimal feeding, a higher maintenance requirements for high producing cows or a to high estimation of the feeding value of some products. Several authors claim that the VEM value awarded to roughages is overestimated (Agnew et al., 1998; Bruinenberg et al., 2002). Therefore in composing calculations for excretion energy is covered at 102%. This assumption is in line with a fixed excretion in dairy cattle (Tamminga et al., 2004).
The amount harvested can be measured and analysed for nutrients fresh or ensiled. Although this may be accurate losses still occur in the stable and during conservation. All these losses from the moment of harvest until the moment of consumption deviate, large differences are found between and within farms. This makes it hard to accurately estimate the amount of energy lost in the process.
Feeding of grazing ruminants is difficult to manage in practice due to inability of the farmers to accurately estimate nutrient intake from grazed pasture. It is unclear how much grass delivers in terms of DM and energy and utilized by their cows to be transformed into milk. To accurately determine the net energy production of grassland this paper uses a different approach. In this study energy production of grass is determined from animal performance in terms of milk production and growth to calculate back how much energy has been produced out of grass. Instead of calculating herbage accumulation and taking in account field losses and digestibility losses.
The present study involves research on energetic calculation methods for determination of net grassland production. The objective of this paper is to analyse, compare and check the reliability of three energy calculation methods for the determination of the net energy yield of grassland. It would be interesting to discover what distinguishes the energy calculation methods from one another. The next step is to optimize and formulate a new model, based on the three models investigated.
The hypothesis is: The net energy intake is influenced by energy calculation method.
The energy systems evaluated are the methods of Lantinga, the KringloopWijzer (KW) and the method as developed by Thomet and adapted by Leisen which is designed for grazing cattle. The underlying meaning is that eventually European countries can agree on one calculation method for determining the net energy production from grass.
2.
Materials and Methods
To calculate the energy production of grasslands, several data is required. In the following chapter the first part is about the required data needed to fill in the models. The second part the models of Leisen, the KW and Lantinga are amplified. Also a new model was designed, referred to as `NEW model` from now on, by extending the calculations used in the KW. This was done by taking the best of the three models and by including more specific farm data in the model.
2.1.
Data collection
Data from the farms of Pool and Van de Goor that was used for the analysis came from bookkeeping documents and personal communication. Data was used of the year 2014, 1st January to 31th December. The three calculations methods were tested on both farms to see differences between and within methods.
The farm of Pool is an organic farm on a mostly peaty soil. For a breed Pool chose “Blaarkop”, as they are a strong breed with a good fertility. As much grazing as possible is applied, if conditions allow for grazing cows start to graze half March to half November. Cows graze for 20 hours. Also heifers graze from 1st of
March to the 1st of December. Calves graze from start of July to the end of November. Short grazing is used. Next to grass the ration exists of little concentrate
and maize silage.
The other farm is a conventional farm managed by Van de Goor which houses Holstein Friesian (HF) cows. Cows receive summerfeeding year round. Grass produced is harvested and ensiled to be fed in a TMR to the cows. Next to grass cows receive a large proportion of maize silage and concentrate, with a bit of distillers’ grain or beet pulp.
2.2.
Calculations methods
In current practice a lot of data is available for each individual cow. If you ask a farmer how much milk a cow produces he can tell you exactly, however when asked how much grass is produced per ha, they can’t give a clear answer. It is unclear how much grass delivers in terms of milk. In practice the herbage yield of grass is not measured directly, whilst grass is the main source of nutrition for the dairy cow.
To achieve insights in the energy flows, the energy requirements have to be determined.
When calculating the energetic requirements of free grazing cattle additional energy for grazing and walking to the pasture have to be accounted for. Movement may increase the energy requirements of grazing cattle by 10% or more compared to stall fed animals (Havstad and Malechek, 1982). Grazing animals spend more time and energy on walking, eating and rumination. Whilst stall fed animal take up their nutrients in a shorter period.
Maybe even more important is the energy required for milk production, depending on percentages of fat and protein. Also per kg of body weight an energy correction has to be calculated. Furthermore cows require energy for gestation, negative energy balance and replacement of cows. To calculate these energetic requirements the following chapter will elaborate on three energy calculations systems. Starting with energy calculations of Lantinga and colleagues then the method used by the KW and lastly the method of Leisen which is focused on grazing cattle.
2.2.1. Lantinga
For the third method, energy calculation methods of Lantinga were reviewed for their purpose of calculation of net energy production of grassland. Lantinga his calculation were derived from Meijs (1981) and Es (1978). Energy calculation methods used by Lantinga use the VEM system. Below these will be discussed for their use to determine net energy production of grasslands. One Dutch feeding unit for lactating animals (VEM) contains 1.650 kcal or 6.9kJ Net Energy for Lactation. In general it is more common to use 1 kVEM equal to 6.9 MJ NEL. VEM is a relative energy measure: barley is used as a reference material. In
investigations of Lantinga several calculations were used.
In the following paragraph, the most suited method for determination of net energy production of grasslands is used for comparison. Other studies of Latinga used body weight changes over time could not be used for determination of energy requirements (Schlepers and Lantinga, 1985; Deenen and Lantinga, 1993; Lantinga et al., 1999). This data was unavailable. More explanation about these methods can found in appendix 2.
To test the net energy production of grassland was calculated according to the method of (Lantinga, 1985). For the energy requirements a combination of methods was used (Es, 1978; Meijs, 1981; Deenen and Lantinga, 1993).
The amount of energy consumed through grazing is calculated back from animal performance data (FPCM). A flock within the calculation method of Lantinga is that requirements for the rest of the herd (calves, heifers, dry cows and bulls are untreated, but these can be derived from (Es, 1978). Also energy required for replacement of cows, NEB are not incorporated.
Lantinga (1985) calculated the net pasture yield as the difference between daily requirements for maintenance and production of the grazing animals minus the daily energy consumption of the supplemented concentrate, table 1. This method is similar to the KW and the method of Leisen. However for calculation of energy requirements a different formula has to be used. This model however only calculates the VEM utilized from grazing, it does not take into account silage grass or hay, which have to be added.
Table 1: Calculation of the net pasture yield in kVEM ha-1
Conversion factor kVEM ha-1
Maintenance (715 cow d ha-1 ) 5.78 kVEM cow-1 d-1 4133
Milk yield (15647 kg FCM ha-1) 0.46 kVEM kg-1 FCM-1 7198
Requirements 11331
Concentrates (1430 kg/ ha-1)l 0.94 kVEM kg-1 1344
(Other feeds)
Net pasture yield 9987
5780 VEM per cow per day is for maintenance 1 kg of milk with 4% FCM contains 460 VEM Concentrate = 940 VEM kg-1 DM
For calculations of energy requirements formulas were based on the original formulas, equation 1. (Es, 1978) with adaptations for extra requirements due to grazing, equation 2 (Meijs, 1981).
NEL = (442 FPCM +42.4 w0.75) (0.9752 + 0.00165 FPCM) (1)
NEL = (442 FPCM +50.9 w0.75) (0.9752 + 0.00165 FPCM) (2)
It is difficult to assess the energy requirements associated with grazing. The requirements at maintenance are estimated to be 20% higher for grazing animals (Meijs, 1981). The average lactation cow weighed 550 kg with a production of 15 kg milk with 4% fat. Energy requirements of growing cattle and heifers at different live weights and growth rates are estimated as well (Es, 1978). For calculations the weight of herd was estimated based on breed and age. For stall fed animals one kg 4% FCM was found to contain 730 kcal (3054kJ), so its production requires 730/1.65 = 442 VEM. To determine FCM (4%) the following equation is used: FPCM = M(0.4 + 0.15p)
Where: P = fat% and M = Milk production, standard is 4% fat.
The maintenance requirements for housed cattle (Em) is 42.4 VEM per kg of metabolic body weight (MBW = BW0.75) (Es, 1978). This number originates from
a free stall barn. Expressed in VEM the maintenance requirement is 42.4 W0.75 VEM. The requirement has to be corrected by 300 VEM for every 50 kg below or
above 550 kg.
For growth extra energy is needed, one kg of body weight is estimated to contain 5000kcal, to gain one kg of BW during lactation and have a 1.65 energetic efficiency. The value of 1.65 was chosen arbitrarily. The requirements for growth are 5000/1.65 = 3000 VEM kg-1 BW gain. The dry period is less efficient (+10%)
leading to 3300 VEM. For calculating the VEM of feedstuff the ME contents at the maintenance feeding level is used, using a feeding level of 2.38. For higher or lower feeding levels the requirements deviate + or – 1.8% per level respectively. (Es, 1978).
Some notes regarding the model are; the model only calculates the VEM utilized during the grazing season, it does not take into account silage grass or hay consumed during the rest of the year. Something all calculations methods of Lantinga do not take into account is the energy required for the rest of the herd (calves, heifers, dry cows and bull). Additional energy required for replacement of cows are not incorporated. Therefore these were set equal to those used by the KW which is the most recent. Lastly these formulas are outdated cows have increased in weight and improved production, changing animal requirements, the CVB has adapted their calculations in more recent editions (CVB, 2010).
2.2.2. Leisen and Thomet
The energy calculation model of Leisen is a redesigned model of Thomet. Leisen is a grassland advisor; he collects data from farms across Europe (mostly the Netherlands and Germany) and compares these farms based on region and climate to see what causes the difference between farmers and within the farm itself. The model is designed for cattle grazing in different types of pasture. Instead of using the VEM system the model uses MJ NEL energetic value.
The model calculates how much herbage is available, by measuring the height of the crop that has been grazed recently. Milk production and the amount of animals grazing on the area are known, making is possible to determine the energetic requirements. From products such as wheat the energy content can be measured accurately. When subtracting the net energy provided through concentrate and other additional feeding the remaining energy is the net energy production of grassland. This calculation is done on a weekly basis. Therefore a more extended model is used for a whole year. To determine the net energy production of grassland, expressed per ha.
The following need to be filled in for calculation of the model: 1) Animal data, for energetic requirements of the herd
a. Cows, milk production, fat and protein level. For determination of the milk production all milk has to be given, milk to the factory, calves and for personal use.
b. Heifers, older or younger than 1 year; c. Calves;
For cows it is also important to know the calving interval, with this the amount of calves born can be calculated. Also the average age of the cows is needed, to know how much animals are needed each year for replacement.
2) Milk production: kg of milk and percentages of fat and protein. Also milk produced and given to the calves or used for own consumption. For milk production ECM is used. The formula for ECM can be found in Appendix 7.
3) Supplementary feeds such as concentrate, potatoes, etc fed to the cows are subtracted of the energy requirements to determine the amount of energy from roughages. Energy production of forage area is calculated as kg ECM per hectare from roughages. If available energetic values are used from analysis else assumption are made based on average values. The model also calculates the hectares required to completely feed the herd.
2.2.3. Kringloopwijzer
The calculation method used by KW originates from the Dutch BEX system (RVO, 2015). BEX stands for farm specific excretion. The BEX system is designed to calculate the real excretion of nitrogen (N) and phosphate (P) on a farm level. Farmers have the possibility to reduce their phosphate production. With the BEX systems farmers proof they operate more efficient than fixed governmental values and qualify for “Derogation” which allows them to apply more minerals on their own land. Over the past years the dairy sector has grown tremendously, jeopardizing its maximum phosphate level, 172.9 kiloton phosphate. If the dairy sector is not restraint the dispensation for “derogation” may be withdrawn. To prevent further increase of phosphate production, 2014 is used as a reference year for phosphate rights. With the use of the KW farmers can earn room to develop if they carefully manage their phosphate flow.
The calculation method used in the KW calculates the total energy production of the farm, including heifers and beef cattle. Other types of grazing animals are excluded. The KW is a program in which all nutrients flows of the dairy farm are monitored. This part exists out of data required to fill in the KW, based on the version of 2014.06 d.d. 9 July 2014. The model consists of several tabs which must be filled in completely before going to the next one. Data required to fill in the KW is;
General data (such as personnel data, year of input, and whether you wish to fill in BEX or BEX + cycles;
Animal data, how much of each animal category is present. In case other grazers are present, the number of animals: present, bought and sold needs to be filled in. For each animal category need to be indicated whether feed flow is separated or not;
Milk production and composition;
Animal manure and fertilizer, type of manure, type of manure application, storage etc;
The amount of hectares specific for each crop;
The consumed amount of feed, of each feed the amount and nutritional value need to be recorded. To fill in the data feed is separated for feed at the start of the year, end of the year produced during that year, and the amount sold and bought to calculate the amount of feed consumed.
explained below, for more details see appendix 1. The following steps originate from RVO (2015) and can be used to determine the kVEM production of grasslands:
1. Calculate the total energy requirements of the herd, minus energy consumed by other grazers. The KW uses weight of cows to determine the amount of energy needed.
Firstly the amount of energy (VEM) needed for the herd is calculated, based on the number of cattle and the nutritional need per animal. The energy
requirements are calculated according to custom calculation rules of the CVB (2010) (Schroder et al., 2014). The complete requirements of the farm dairy herd are calculated, including additional requirements for breed, weight, movement, lactation, gestation, replacement heifers, compensation of the Negative Energy Balance (NEB) in the beginning of the lactation and beef cattle if present. Other types of grazing animals are excluded. From the requirements the VEM-intake is calculated. VEM requirements of the total herd (kVEM/year) is the sum of the VEM requirements of cows, heifers and calves (Schroder et al., 2014). Formulas for calculation of the energetic requirements can be found in appendix 1.
2. Correct for energy consumed through purchased feed.
For the second step fed purchased feeds are subtracted of the total energy requirements of the herd. The rest of the energy requirements should be grown on the farm.
3. Calculate the herd VEM intake from roughages.
Of the remaining energy from roughages ratio’s between maize silage, grass silage and fresh grass are determined. The ratio between grass silage and maize silages is determined from fed amounts of silages. The ratio between fresh grass and silage grass is calculated on the type and amount of grazing applied (RVO, 2015). Important are the hours and months of grazing.Situations can occur in which the calculations deviate to much from the real grass intake. That is why a control calculations are executed, to check whether the assumed grass intake according to the standard calculation is realistic.
4. Determine the amount of energy utilized.
The amount of grass ensiled is different from the amount of grass consumed, due to conservation- feeding losses. For the calculation of grass silage these losses are corrected for to determine the yield per ha. Correcting for losses is done using standards (Remmelink et al., 2014). The total net VEM produces is the sum of pasture grass and grass silage consumed. The total VEM production is divided Divide this by the hectares of grass or by the number of cows to
determine the net energy production of grassland, expressed in either energy or milk (Remmelink et al., 2014).
A remark that should be made for all three calculation methods is that there is no data for weight on either farm; it is therefore estimated on breed, so 600 kg for an adult cow. Additional weight change for NEB is estimated at 100 kg (Tamminga et al., 2004). It would have been more accurate if animals would have been weighed. For instance if the herd average weight of a cow is higher energy requirements are underestimated as heavier animals require more energy for maintenance.
2.2.4. New Model
Inclusion of all milk flows (as applied by Lantinga and Leisen). All energy flows on the farm are included; next to milk provided to the factory milk fed to calves, used for personal consumption and otherwise is summed. If not energy requirements for milk are underestimated.
For calculations of energy in milk FPCM (KW and Lantinga) is chosen above ECM (Leisen). FPCM is already used in the Netherlands and the farms investigated. Both FPCM and ECM correct for energy in milk and fat, differences are small. Additionally the model of Leisen is different for energy using NE for lactation compared to VEM used by the KW and Lantinga. For comparison VEM is used as it originates in Netherlands and farms investigated use the VEM system.
In calculations for energy requirements of cows the KW is chosen, being the most specific. Leisen is only focused on the grazing season of cows. Lantinga does separate for cows in the grazing season and cows housed indoors. Both Leisen and Lantinga do not take into account additional requirements for replacement, gestation and NEB. In the KW these bonuses are fixed for the new model corrections were made.
When calculating the basic requirements of a cow, weight is important. In the KW weight depends on race; a separation is made for Jersey, other breeds and crossbreeds (50% Jersey). However among other breeds and between Holsteins herd’s different weight occur. Leisen uses a different approach correcting for every 50 kg weight difference to the standard 600kg Leisen corrects with 116 kVEM. Also Lantinga his calculations have corrections for weight change overtime, unfortunately weight data is unavailable. Therefore in all the models weight is set at 600kg.
In the KW energy requirements for replacement of cows are fixed at 36.3% with 131 kVEM per cow. In reality replacement is different for each farm. In the new model energy requirements for replacement is thus corrected based on true replacement. Using the data on heifers kept, energy for
replacement is recalculated. For the farm of Pool this led to a replacement of 22% and 78 kVEM per cow.
Second bonus used in the KW is for gestation and NEB. Cows require additional energy for gestation and for a loss and recovery of 100kg due to NEB (Tamminga et al., 2004). Again this bonus is fixed. In the new model the energy required for gestation and NEB is recalculated based on calving interval. In the KW it is assumed that 16% of the cows are in gestation that comes down to 307 days in lactation and 58 days in gestation per calendar year. As the allowance for gestation is based on this number, the energy expenditure for gestation and NEB is overestimated, for instance on the farm of Goor calving interval was 405 days. This would mean that instead of 191 kVEM per cow per year cows require 172 kVEM for gestation and NEB.
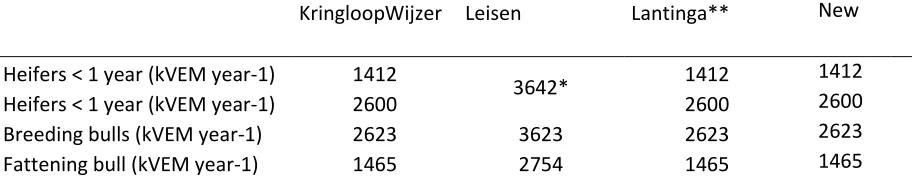
Requirements for heifers and other grazers were drawn from values used in the KW. Reason for this is that the KW has more accurate and animal specific data available. Also Leisen has fixed requirements for other grazers but less detailed as the KW. In Lantinga requirements for heifers are unavailable.
Lastly in the new model the amount of energy consumed through grass has to be determined. Gross amounts fed to the herd for concentrate,
2.3.
Comparison
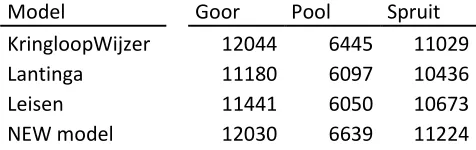
For comparison the calculations are compared for each of the three farms, there will be no comparison done between the tree farms as they are completely different types of farms with their own herd, history and management. These three farms are chosen to reveal differences between the models for calculation of the net energy production of grassland. Table 2-4 show farm characteristics of all farms containing information about the herd composition, crop
management, milk production and amount of grazing. Data is taken from the period of 1.1.2014 until 31.12.2014. Farm characteristics were used to calculate the models and provide background information on the farms.
For the farms of Spruit and Goor feed analysis were available, unfortunately there were no feed analysis performed on the farm of Pool for both purchased as produced roughages. The missing of these data greatly undermines the reliability of the outcome. However for comparison it will make no differences as the error is the same for all models. For farm of Pool values were estimated based on average values of roughages as used by BLGG in the Netherlands
(AgroXpertus, 2015d; a; b).
Table 2: Dairy herd composition
Dairy herd composition
Goor Pool Spruit
Cows 111 74 76
Heifers < 1 year 47 16 37
Heifers > 1 year 35 16 29
Bulls 0 1 0
Fattening bulls 0 0 32
Type of feeding Summerfeeding Unlimited grazing Unlimited grazing Breed Holstein Frisian Blister Head Mixture of milk breeds
Available for replacement 37% 22% 43%
Needed for Replacement 35% 11% 25%
Deviation 2 8 14
Heifers per 10 cows1
7.39 4.32 8.68
Age 1st calf (months)
24 24 25.5
Calving interval (days) 405 365 420
Table 3: Soil and crops
Soil and crops (expressed in hectares)
Goor Pool Spruit Crop area 44.8 41.2 38.1 Forage area 37.9 35.7 38.1 Maize area 6.9 0.0 0.0 Conservation grassland 0 5.5 0 Other arable land 0 0 0
Part of soil type (%)
[image:22.842.58.450.60.395.2]Grassland - Peat / clay / sand 0/100/0 80/0/20 100/0/0
Table 4: Stocking management
Grazing Goor Pool Spruit Animal category days hours days hours days hours Cow Limited 0 0 14 8 0 0
Unlimited 0 0 229 20 200 10
Heifers 0 275 180
3.1.
Introduction
3.2.
Grazing versus Cutting
Grazing is an important issue within the dairy sector. In many western countries, grass is a relative inexpensive feed source for the production of milk by dairy cattle. Grazing provide an environmental and animal welfare friendly image of the dairy sector. This chapter compares grazing with cutting on several levels: economics, ruminant physiology, environment, society, management, labour, threat towards grazing, production and energetic requirements.
For the provision of grass several systems are used. With grazing, cows graze on pasture for several hours per day during the growing season either unlimited, or limited (2-8 hours a day) with additional feeding in the stable. There are several type of grazing, rotational and continuous stocking are the two most
common types of grazing. Grass can also be provided as grass silage, grass is then mown, wilted and tedded to be stored airtight as silage. Thirdly grass can also be mown and fed as fresh grass in the barn during the summer; this is called ‘summer barn feeding’.
For the past decades there is a trend towards less grazing in most European countries. A lot of dairy farmers stopped grazing their cows. From the period 1997 to 2013 the amount of Dutch cattle grazing decreased from 92% to 70% (CBS, 2013). Additional the hours of grazing among grazers is declining as well. In 1998 cows grazed for 13 hours per day, whilst in 2006 cows grazed 8 hours per day (Aarts et al., 2005). This decline is caused by several changes in dairy farming. This decline is caused by economic, practical, social and personal motives. Most important reasons are; higher farm intensification (cows/ha), management, labour input, DM yield, high producing cows, and an increased use of milking robots.
3.2.1. Economics
Efficient use of grasslands is becoming growingly important, especially in the EU with the disappearance of the milk quota in April 2015, the milk price is no longer guaranteed. The expectation is that the coming years farmers have to deal with larger price fluctuations in milk and feed. The prognosis until 2023 is that the average milk price will be €33.50 per 100 kg milk, with 4.4% fat and 3.5% protein (Livestock and Vermeij, 2013). Ensuring low feeding cost is a method to deal with low prices. Conventional farms are on average larger with more cows per farm and per hectare with a higher milk production per cows. Average milk production on organic farms was 6.270 kg compared to 7.700 kg for conventional farms (Ruis and Pinxterhuis, 2007).
In many cases grazing proves to be financially interesting even under difficult circumstances such as: automatic milking system (AMS), small grazing surface, a high milk production per cow and a large herd. In calculations from Dillon et al. (2005) every 10% increase in grazed grass in a dairy ration reduced milk
production costs with 0.025 €/litre. Also in Dillon et al. (2008) increased levels of milk production originating from grass lower the cost of production. Countries with high intake from grazing have lower feed costs. The cost price of grazing is almost €0.10 per kg DM lower than for silage grass (Galama, 2013). Evers et al. (2008) investigated the effect of grazing instead of stalling. If conditions were normal the income of farms that apply grazing with 15.000 kg of milk ha-1 is € 0.50
to € 2.00 per 100 kg of milk higher than when cows were stalled. When farm intensity is increased, profit remains higher or equal for grazing. Cows harvest the grass themselves and at the same time bring manure and urine to the field. The economic benefit of grazing is largely determined by lower costs for contract work, concentrates, labour and manure disposal (Pol et al., 2013). If cows are milked by an AMS, grazing remains more profitable than stalling. Also at a high milk yield cow-1, income is higher with grazing than with stalling.
The biggest problem for grazing economically appears to be a small area for grazing. If stocking rate is more than 10 cow ha-1 stalling is more profitable than
grazing. The income at stalling is then € 0.75 100 kg-1 milk higher. If a lot of work has to be done by contract work and concentrate is expensive this drops € 0.25
income is determined by several factors, normally grazing leads to the highest income. However when prices for concentrate are low and the amount of contract work is low, stalling becomes interesting again. Grazing a large herd is more difficult as cows need to be able to consume sufficient amounts of fresh pasture grass. In the case 13.4 cows ha-1 have to graze summerfeeding becomes cheaper than grazing (13 cows per ha is an extreme value, impractical for
grazing). The extra cost for grazing outweighs its benefits. Also intake from grazing is low, 4kg DM d-1. To achieve this cows need sufficient grass and days of
grazing. Evers et al. (2008) also found that the income with grazing is € 1.50 to € 3.00 per 100 kg higher than with stalling and summer barn feeding. They also found a positive relationship between uptake of pasture grass and income.
In general, grazing generates more income than stalling, even on large and automated farms (Pol et al., 2013), unless stocking density is too high and a lot of additional feed is required.
3.2.2. Effect of stocking on ruminant physiology
Grazing cows is a management practice that has a large influence on animal health and welfare. The following part will shortly discuss some of the aspects of grazing versus summerfeeding on animal health and behaviour. Quality of these systems depends on management, housing and climate.
Expressing natural behaviour is an important aspect of animal welfare. The ability to express natural behaviour is remarkably better in grazing compared to indoors. In nature cows are used to spend a larger part of the day grazing, foraging from dawn to sunset (Fraser, 1983). Whereas indoors cow intake is mostly after feeding, time spend is relative short and depends on the energetic needs of the cow based on stage of gestation and milk production (Dürst et al., 1993). Grazing positively contributes to animal behaviour and welfare. In cubicle barns cows have the possibility to move around. In pasture cows have more space, being able to avoid dominant animals and move around freely and lie down comfortable. It is unclear however to what extend grazing affects animal welfare (Pol et al., 2002).
The effect of grazing on udder health are conflicting (Pol et al., 2002). Grazing reduces mastitis due to lower infection levels and less environmental bacteria (Washburn et al., 2002) lowering the risk for teat injuries. The combination of these factors lead to increased chance of high cell counts (Goldberg et al., 1992). Grazing is not all positive, head flies which occur only outside can cause summer mastitis. In general however grazing improves udder health. Another
disadvantage of cows grazing is they are more likely to get infected with parasites, such as worms and liver fluke (Borgsteede and Burg, 1982). Secondly cows are exposed to the elements of nature like sun and rain, temperatures above 25°C can cause heat stress.
In stables floors are wet and hard increasing the mechanical load of the claw. Relative soft, clean floors that provide sufficient grip for cows to express heat are preferred for a good health of claws and legs. Hard floorings can cause cracks which can be entered by urine and faeces (Belie and Rombaut, 2003). Where wet floors wear off the horn (Bonser et al., 2003). Products of urea multiply this effect by four times (Gregory, 2004). In pastures infectious pressure is much lower due to dry soft flooring and less faeces and urine.
reduced by 360 kg milk per lame cow (Green et al., 2002). Grazing improves claw health of dairy cattle. Claw disorders and leg injuries that occur in the stable gradually become more severe over time, during the grazing season cows can recover.
Cows prefer to lie on dry soft flooring. In pasture or soft bedding cows lie down faster and smoother.
In cubicles cows are limited in their movement when lying down or standing. In pasture space, lying comfort and grip are not an issue (Tucker et al., 2004). Also in cubicles cows are more reluctant to get heel skin damages, especially when rubber mats are placed. Rubber has a sanding effect on the heel skin. In the worst case the heel burst allowing bacteria to enter and cause inflammations. Deep litter with straw or sand prevents sanding, with rubber 90% of the cows have damages to the heels, while sand beddings are clearly better with just 24% (Weary and Taszkun, 2000).
Grazing brings animal welfare to a higher level and is preferred over cubicle housing, as it reduces the chance on hoof- and leg disorders and udder
inflammations. However the gap between grazing and non-grazing deteriorates. Grazing cows, graze less hours during the day, possibly limiting advantages of grazing. New stables provide better conditions such as; deep litter, better flooring, more m2 per cow and a better climate.
3.2.3. Environmental pressure grazing vs cutting
When looking at environmental effects of ruminants calculations from Bruggen and Faqiri (2015) has shown that a cow in pasture produces less ammoniac than a stabled cow. When urine and manure mix chemical processes are set in motion emitting a lot of ammoniac. Indoors slurry manure and urine are stored together and mixed before manure application in the field, increasing the ammoniac deposition. Also during storage and later when fertilizing ammoniac is released. Total ammoniac produced is therefore much larger. Cows kept indoors year round produce 8 kg of ammoniac more than cows grazing day and night during summertime. If grazing would increase to 80% ammoniac emission would decrease with 0.5 million kg compared to the year 2013.
For gasses methane and nitrous oxide expressed in CO2-equivalents the effect is negligible. Nitrous oxide needs oxygen to be formed. The lower levels of
nitrous oxide in storage are compensated for by higher levels of methane emission (Bruggen and Faqiri, 2015).
3.3.
Society
With the intensification of the dairy sector in the Netherlands and the growing distance between farmers and consumers, the image of the agricultural sector has deteriorated. The general public appreciates grazing animals in the landscape. The society associate grazing with animal welfare allowing dairy cattle to express their natural behaviour. To improve the sector’s image and to stop further drop in grazing cattle several milk factories provide bonuses to farms that have their cattle graze. For instance ongoing the 1st of January 2015 FrieslandCampina has raised the bonus from 0.50 to 1.00 euro per 100 kg milk if cows graze
3.4.
Threats towards less grazing
There are several reasons for farmers to feed their cows indoors. For instance, modern, large-scale farms with high yielding dairy cattle, such as those increasingly occurring around Europe, may reduce grazing in order to control the diet and optimise grassland utilization.
Unlimited stocking becomes harder as nutritional demands increase. Cows with high milk production capacity require additional feeding to meet nutrient requirements. The nutritional composition of ration in grazing fluctuates, leading to different levels of nitrogen in the rumen. As milk production increases, these fluctuations negatively affect animal performance. Cutting grass is more ideal for feeding a properly balanced diet and reach a high milk production. Restricted grazing provides cows with a more constant flow of nutrients due to additional feeding indoors, however this does limit feed intake from grazing.
Reported DMI levels of early lactating dairy cows grazing high quality grass or fed on freshly cut grass rarely exceeds 19kg/d (Bargo et al., 2003) and
corresponding milk production levels are some 28kg/d at maximum (Dijkstra et al., 2008). With grazing there are relative large fluctuations in the composition of the diet, especially with unlimited stocking energy can limit milk yield. Cows that graze mainly receive perennial ryegrass pasture in their diet, although good in terms of milk composition, milk production does not increase accordingly. In research from Kolver (2003) high producing cows received either a pasture-only diet or a TMR. The pasture-only diet had lower intakes for DM (19.0 vs 23.4 kg/d) and NEL; however intake of CP and NDF did not differ between the
pasture-only diet and TMR. Consequently cows consuming pasture gave less milk (29.6 vs 44.1 kg/d). Supply of metabolisable energy was the first-limiting factor for milk production. In grass-based systems, low grass dry matter intake (DMI) of pasture has been identified as the major factor responsible for limiting milk production by high producing dairy cattle (Kolver and Muller, 1998). Grazing cows were lower in live weight and body condition score (2.0 vs 2.5) Kolver and Muller (1998). The mobilization of energy reserves indicates that extra energy should be provided to support milk production.
The biggest problem in pasture based systems is low DMI. To achieve a high milk production a high DMI is needed. Johansen and Höglind (2007) showed that herbage DMI is positively influenced by herbage allowance if 12 to 24 kg of DM was offered, DMI increased with 0.24 kg for every extra kg DM of herbage allowance. However an increased herbage allowance decreases herbage utilization.
An increased SR limits DMI as less herbage is available per cow. In Bargo et al. (2002) pasture DMI of unsupplemented dairy cows increased from 17.7 kg/d to 20.5 kg/d as pasture allowance increased from 25 to 40 kg DM/cow per day (Bargo et al., 2002). Also milk production increased respectively with 19.1 vs 22.2 kg/d. Herbage intake can be increased by offering larger allowances, but with higher residuals in subsequent grazing (Taweel, 2006). Supplementation of concentrates lowered pasture dry matter intake (Bargo et al., 2002), thus lowering the efficiency of grassland productivity (milk production per ha), but increase efficiency on a cow level (milk production per cow). Production costs per ha increase due to extensification.
In New Zealand, Australia and many parts of Western Europe, pasture can be the sole feed of cows. However to make optimum use of the grass available one should apply seasonal calving to match the growth pattern of the pasture (Dillon et al., 1995). With summerfeeding the nutritional composition is kept similar during the whole year and average date of calving (CD) is irrelevant. In grazing systems however feed composition changes during the season. In seasonal calving the effect of days in lactation becomes more relevant. In research from Dillon et al. (1995) spring-calving in dairy cows was investigated. Comparing calving dates of 23 January and 15 March. Cows calving in March, with the beginning of grass growth showed a reduced milk yield per cow but higher
In expectation to the milk quota abolition, farmers anticipated to a restriction of herd size based on animal rights or phosphate production of a reference year. Farmers whom otherwise would have waited invested in large stables and expanded their herd size to increase milk production. Over the past decades herd size has increased severely. The average dairy farm had 42 cows in 1984 to 85 cows in 2014. Secondly in 2000, 45 dairy farms had 250 cows or more, this number has increased tremendous to 295 in 2014 (CBS, 2014). Increasing herd sizes makes grazing more difficult, the amount of available pasture may be inadequate, putting too much pressure on the crop and soil (Koopman, 2014). This leads to an increase in grazing pressure through higher stocking rate (SR). In most cases an increased milk production and herd size is not paired with an increased farm area. From the period 2003 to 2013 the farm intensity increased from less than 15.000 to 18.000 kg/ha. The expectation is that farmers will continue to expand their herd, but not grow accordingly in hectares increasing the average farm intensity to 22.000 kilogram in 2018.
To make efficient use of pasture (SR) is an important variable. Stocking rate (cows/ha) is defined as the number of animals per unit of land (Allen et al., 2011). Increased SR is associated with a decrease in sward height leading to an increase in tiller population density. Lower stocking rate gave greater live individual tiller weights throughout the experiment and a longer interval between defoliation of individual tillers (Baker and Leaver, 1986).
The effect of increasing SR on grass production within the literature is inconsistent. In Stockdale and King (1980) increasing SR led to a reduction in total grass production. They declared this reduction was due to a reduction in the photosynthetic ability of plants with high SR. Also Sollenberger and Vanzant (2011) found in literature that increasing grazing intensity decreased forage mass production and increased the nutritional value of the forage. However the increasing grazing intensity or SR was related with a reduced individual animal performance. In contrast, Macdonald et al. (2008) observed an increase in grass production at higher SR. Additional nutritional value of the pasture increased, reducing the impact of more cows per hectare. Higher SR reduced milk production per cow, but increased milk production per hectare. Increasing SR negatively affects the amount of pasture available to each animal, but increases the amount of
pasture harvested per hectare. There was only a 3% decline in the efficiency of converting feed energy into milk energy as SR increased (McDonald et al., 2008). In McCarthy et al. (2013) cows grazed paddocks on three different SR; low, medium and high, respectively 2.5, 2.9 and 3.3 cows ha-1. Increased SR was related
to more intensive grazing, resulting in sward of increased leaf content and nutritive value, associated with increased grass utilization and milk production per ha.
In research from Lantinga et al. (1999) animal performance of cows was compared under different nitrogen fertilizer levels, however when looking at increasing days in grazing milk production in kg FPCM per cow per day decreased but milk production in kg FPCM per hectare increased (table 1).
A grazing system requires short-term and long-term management decisions for adequate herd feeding and pasture budgeting over the grazing season. Grazing is more difficult to manage in combination with a milk robots (KOM, 2011). Grazing causes the diet composition to change which is undesired in grazing, furthermore the cow has to walk longer distances to the AMS increases the milk interval, making the robot less efficient. Research from Dooren et al. (2002) shows that only half of the farmers apply grazing in combination with AMS. Which is low compared to the 70% for farmers in the rest of the Netherlands. With a high milk production a farmer is more likely to stall his cattle permanently to keep the ration on a constant level ensuring a high yield.
From the reasons outlined above it is clear that current trends in livestock farming in Europe cause a decline in the popularity of grazing for dairy cows. Whether a farm continuous to graze or stock his cows depends on the economics, possibilities within the farm and personal wishes of the farmer.
3.5.
Energy and DM production
In the following part VEM and DM losses under grazing and cutting are discussed. When comparing both VEM values of fresh grass and ensiled material over the years 2010-2014 average VEM varied from 877 to 893 in grass silage and 925 to 947 VEM in fresh grass. Over the years 2010-2014 VEM values were 45 VEM higher in fresh grass. Also the DVE level was higher for fresh grass. The higher amount of VEM is due to more sugars in the fresh grass and secondly through loss of nutrients from ensiling, storage and feeding.
Aarts et al. (2008) investigated the dry matter yield on farms and found that farms that cut their grass have 15% higher DM yields that those farms that apply grazing. However the lower production is compensated by a higher nutritional value in VEM per kg of DM. (Remmelink et al., 2014)
The advantage of grazing is that the net energy production is equal to the net energy intake. For summerfeeding or feeding fresh grass in the stable feeding losses occur, feeding ensiled grass gives on top of that conservation losses. There is a clear effect of the weight of the cut on the VEM value of grass. Compared to cutting for conservation the VEM-value is 4% higher than for cutting for ensiling and 9% higher than for grazing (Remmelink et al., 2014).
In grazing losses of the bruto energy production are estimated on 20% with unlimited stocking, 14% for limited stocking. Harvesting losses related to ensiling are unknown, losses for harvest and conservation of conserved grass are estimated to be 25%. Of whom 5% is lost in the field and 20% energy is due to conservation. These large losses are due to relative weak bonds that break protein and energy down. Summerbarnfeeding has the least amount of losses, 7%
Remmelink et al. (2014) investigated several products for conservation, energy losses in the field, during conservation and feeding have a large deviation. Several aspects such as; quality of the material amount of dry matter harvested, working procedure, climate, storage have their effect, causing a large spread in grassland production. This makes it difficult to predict losses from harvest to intake by the cow. When calculating the energetic requirements of the herd these losses are irrelevant.
The NH3 fraction of 5 to 15 in the silage can drop VEM-value by 5 to 11%. A remark should be made that this drop in VEM is not just the drop NH3, but also due
to low DM levels of the analysed material (20-35%) (Schooten and Philipsen, 2011). They make a subdivision for conserved well wet silages (<35% DM), assuming 3-5% VEM drop, and 5-13% for average to poor conserved silages. For dry silage (>35% DM) VEM decrease is estimated at 2-3%.
Also over time silage degrade, for every months ensiled (Schooten and Philipsen, 2011) calculate 0.2-0.3% drop in VEM value.
According to Van der Pol et al. (2002) the highest return from grassland is achieved with summerbarnfeeding (fresh grass in the stable), achieving both a high production of grass and utilization by cattle. High losses for grazing combined with a low production led to the lowest return for unlimited stocking.
Summerfeeding achieve a high production, but had to accept relative high conservation losses, leading to similar utilization as for limited stocking (Pol et al., 2002).
The individual animal intake at grazing and efficient milk production is affected by multiple factors including, genotype (Horan et al., 2005), grazing SR and grazing intensity (McCarthy et al., 2013) the mean calving date (CD) and calving rate (Dillon et al., 1995).
The production of grassland and intake by ruminants depends on several factors. It is difficult to estimate the amount herbage due to heterogeneity of the sward. Herbage production is affected by several factors:
Supply of nutrients and water, if unequal distributed variation within the sward will increase;
Soil structure and composition, the ground close to water bins may produce less herbage due to intensive treading;
Botanical composition, high yielding species and varieties are better under similar circumstances.
As the grazing season progresses, variation in herbage mass will increase even more (Lantinga et al., 2004). Due to animal treading and selection, cows select for herbage species or plant parts (topping) and for areas free of manure and urine. Also faeces and urine are not evenly distributed in the field increasing herbage variation.
Herbage intake of dairy cattle can be determined by (Lantinga et al., 2004);
Factors of sward origin: digestibility, herbage mass and species, chemical composition and plant maturity;
Factors of animal origin such as: age, weight, stage of lactation and/or gestation, milk production and body condition score;
Management factors: grazing system, fertilization, SR, supplemented feed and herbage contamination. High SR forces animals to graze the grass short, leaving less residual herbage but with risk of milk production.
3.6.
Energy requirements for a dairy cow
In current practice a lot of data is available for each individual cow. If you ask a farmer how much milk a cow produces he can tell you exactly, however when asked how much grass is produced per ha, they can’t give a clear answer. It is unclear how much grass delivers in terms of milk. In practice the herbage yield of grass is not measured directly, whilst grass is the main source of nutrition for the dairy cow.
A cow needs energy for physiological processes. Depending on the state of the animal (lactation/gestation) extra energy is needed. The driving force behind milk production is energy, for dairy cattle in the Netherlands expressed in VEM since 1977. For this normative requirements have been set for cows housed in respiration chambers, which have been verified with feeding trails with cows in tie stalls.
In most European systems, NEL is calculated from the ME content of feeds predicted at maintenance intake and the kl (efficiency of ME utilization for lactation).
Kl is predicted from energy metabolizability (q = (ME/GE)). Maintenance requirements for lactating cows were derived from calorimetric studies (36).
Maintenance requirements amount to 72 kcal of NEL/kg of BW (The Netherlands). The NEL is related to the energy contained in the milk produced, which varies
according to milk composition, and is set at 748 kcal of NEL/kg FCM in the Dutch system. (Vermorel and Coulon, 1998)
To achieve insights in the energy flows, the energy requirements have to be determined.
In later research of Meijs (1981) requirements of cows grazing are 20% higher than stall fed cows. Whilst in Remmelink et al. (2014) grazing cows burn more energy, 6% for limited stocking and 7% for unlimited stocking than cows that roam in the stable. Movement may increase the energy requirements of grazing cattle by 10% or more compared to stall fed animals (Havstad and Malechek, 1982). Although this does not affect grass production, efficiency decreases. In research from Pol et al. (2002) unlimited stocking was compared with other grass management systems. Limited stocking led to an 9% higher netto kVEM efficiency, summerfeeding is 21% higher and cutting for conservation gives a 8% higher netto kVEM production (Pol et al., 2002). There is thus a large variation in calculating energy requirements related to grazing.
In RVO (2015) 10% extra is calculated for cattle in free stall compared to tie-stall. For grazing an additional energy is calculated at 7.5% and 10% for respectively limited and unlimited grazing for every month spend grazing.
Further maintenance requirements are higher if cows have to walk long distances to the milk parlour or when they graze on steep terrain. When walking 2.5 km per day extra maintenance requirements add up to 250 VEM per day for a 550 kg cow (Meijs, 1981).
Maybe even more important is the energy required for milk production, depending on percentages of fat and protein. Also per kg of body weight an energy correction has to be calculated. Furthermore cows require energy for gestation, negative energy balance and replacement of cows.
During pregnancy a lot of energy goes to the foetus and membranes, energy for pregnancy is less efficient than for milk production. During pregnancy requirements increase from 700 to about 2500 VEM per day (Es, 1978). After parturition, cows require a lot of energy for milk. Lactating animals have bigger organs, heart, lungs and gastrointestinal tract, causing their maintenance requirements to be higher than for non-lactating animals. And of course milk itself contains energy which must be produced.
Maintenance + growth Cows
Maintenance
Lactation (kg, %F, %P)
Gestation
Growth
Movement
Replacement
Grazing
Energy Requirements of the herd
Other cattle
Heifers
< 1 year > 1 year
Nuka’s
Bulls
[image:34.842.108.502.46.267.2] Beef cattle
Feed intake is limited and often not enough to support this high milk production in early lactation. Body reserves are mobilized to supply nutrients for its production. Lastly diets rich in nitrogen such as fresh grass can reach an excess of nitrogen which has to be removed, costing energy in the process.
By determination of the total energy requirement of the herd (cows, heifers, bulls, calves, etcetera other animals receiving feed of the herd) the amount energy needed can be determined. As one Dutch feeding unit for lactating animals (VEM) contains 1.650 kcal or 6.9kJ Net Energy for Lactation it can be calculated how much VEM is needed on the farm to feed all livestock. In general it is more common to use 1 kVEM equal to 6.9 MJ NEL. VEM is a relative energy measure:
barley is used as a reference material.
Next to the many advantages of grazing, applying grazing makes it harder to supply a constant diet of optimal quality. To support grazing many farmers provide supplementary feed in the stable.
A disadvantage of full grazing is an excess of microbial protein which can negatively affect fertility. The microbial protein is released as ammonia at an excessive level, unable to be utilized at a sufficient amount by the rumen microbes. Thus the liver has to metabolise the urea. This step is energy consuming and is a loss of nitrogen in urine (O’Grady et al., 2008).