Using NMR and SEM, to study the behaviour of pitch
Rhitu Rao1 Karen Stack1, Trevor Lewis1, Des Richardson2 and James Horne3
1School of Chemistry, University of Tasmania 2 Norske Skog Paper Mill (Australia) Ltd. 3 Central Science Laboratories, University of Tasmania
Abstract
Pitch, an agglomerated complex material formed by lipophilic wood extractives continues to be a challenging problem for paper makers. Various techniques have been used to contribute to the understanding of its chemical nature and behaviour under given conditions. This article discusses how Diffusion Ordered Spectroscopy (DOSY) and Environmental Scanning Electron Microscopy (ESEM) can contribute to the existing understanding of pitch behaviour.
Introduction
Colloidal extractives released during the papermaking process are capable of aggregating to form sticky material. These materials, collectively referred to as pitch, causes significant problems to paper makers. They are comprised of compounds which are lipophilic in nature, that is, it prefers non-polar medium rather than polar. Consequently, in aqueous medium these molecules aggregate to form substances with sufficient tack to interfere with paper formation and contaminate the environment around it.
Researchers have spent considerable time using various techniques in trying to understand the nature of pitch and the factors that affect its formation and depositions 1-4. Gas chromatography has been an essential tool in identifying the constituents of the pitch. Hexane extractives of Pinus radiate thermo-mechanical pulp show that the major lipophilic substances are resin acids, fatty acids, triglycerides and fatty acid esters5. It is important to note that the composition of pitch dictates the behaviour of pitch6,7. However, the composition is rarely consistent. Reports show that the ratio of individual components not only differs between species but also the regions they are harvested7,8. Wallis and Wearne5 concluded that the combination of GCMS and high performance
size exclusion chromatography (HPSEC) was useful for the analysis of extractives allowing the estimation of individual resin and fatty acids and steroids, steryl esters and triglycerides.
Studies with extracted pitch using a Particle Dispersion Analyzer (PDA) showed that the aggregation behaviour of extracted pitch is highly dependent also on environmental factors such as salt type and salt concentration9. Lee et al used an impinging jet to demonstrate that the adhesive nature of pitch was also dependent on the salt type10. Researchers have carried out several fundamental studies into interactions between pitch components11,12. Study carried out by Merta et.al with poly(diallyldimethyammonium chloride), PDADMAC, and fatty acid using small angle neutron scattering led to the conclusion that the aggregates do not follow well known models developed for similar systems12. How individual components contribute to the problem of pitch still remains to be understood. The uncertainty generally arises from the inconsistency in the natural composition itself. This is the main motivation to pursue fundamental studies using model systems.
For molecules to interact and form such nanoscale organized structures, physical proximity would be an essential prerequisite. In addition the net interaction between constituent molecules has to be attractive to lead to aggregate formation. A common theme is that the interactions which control the dynamics and organization of solutions are generally very weak13. Translational diffusion provides a non-invasive, direct and natural probe of the dynamics. This paper discusses how diffusion measurements can be used to study pitch behaviour. Pulsed Gradient Spin Echo (PGSE) NMR, and Diffusion Ordered SpectroscopY (DOSY) are two applications of NMR spectroscopy for the study of molecular diffusion in solution. They are applicable to complex mixtures with a range of diffusion rates.
in connecting the microscopic details about individual components to macroscopic behaviour of the material14,15. This paper will illustrate how scanning electron microscopy in the environmental mode can be used to observe the agglomeration process.
Experimental
Material: Model Compounds: Lauric acid (analytical grade 99% purity) and Oleic acid (technical grade 90%purity) were acquired from Sigma Aldrich. Abietic acid was obtained from the same source at only 70% purity. It was recrystallised twice from methanol. 10mM KNO3 solution was prepared using milliQ water and analytical grade potassium nitrate. The pitch used in the experiments was extracted from Pinus radiata thermo-mechanical pulp using the method described previously1. Gas chromatographic analysis reported its composition as follows: fatty acid= 81mg/g, resin acid=223 mg/g, triglycerides= 185mg/g. Aqueous solutions of fatty acids and resin acids were prepared using 1N NaOH solution. Colloidal samples were prepared by first dissolving the acid in deuterated acetone and then adding the solution to 10mM KNO3 solution.
DOSY NMR experiments were carried out using a VARIAN 400MHz Nuclear Magnetic Spectrometer. Diffusion studies were done in aqueous media with D2O as the internal standard. Presaturation of the water peak was carried out prior to each diffusion study. Sample concentration was kept constant for each acid being studied. A stimulated echo sequence with self-compensating gradient schemes and convection compensation was employed.
An FEI Quanta 600 Scanning Electron Microscope was used in Environmental mode. The particles for this study were prepared by injecting a solution of the material in acetone into 10mM KNO3 solution. An appropriate holder was used to carry the sample in the low pressure chamber with water vapour atmosphere. CryoSEM studies were done using field emission scanning electron microscope; a JEOL JSM-6701F with a Gatan Alto 2500 cryo chamber.
Results and Discussion Diffusion ordered spectroscopy
Diffusion is a consequence of constant thermal motion of molecules or atoms or particles (matter) and is one of the fundamental processes by which material moves. At very short time-scales diffusion is a many-body problem characterized by a single number, the self-diffusion coefficient, D15. Under ideal conditions the diffusion coefficient of a species can be correlated with the available thermal energy.
Thus diffusion behaviour is a measure of the translational motion of a molecule. According to the Stokes–Einstein equation, it is related to the size and shape of individual molecules and specific molecule systems, such as aggregates15. DOSY-NMR is a two-dimensional DOSY-NMR experiment, in which the signal decays exponentially according to the self-diffusion behaviour of individual molecules. This leads to two dimensions; one dimension accounts for conventional chemical shift and the other for diffusion behaviour. Since the diffusion behaviour is related to properties of an individual molecule, (such as size, shape, mass and charge), as well as its surrounding environment, (such as solution, temperature and aggregation state), each component in a mixture can be pseudo-separated, based on its own diffusion coefficient. The strength of DOSY is that it is non-invasive technique.
The measurement of diffusion is carried out by observing the attenuation of the NMR signals during a pulsed field gradient experiment. The degree of attenuation is a function of the magnetic gradient pulse amplitude (G) and occurs at a rate proportional to the diffusion coefficient (D) of the molecule.
The DOSY experiment is described by Eq. (1)
I = I0exp[−D(γgδ) 2
( - /3)] (1)
the signal of a DOSY experiment attenuates depending on the gradient strengths (g2) and diffusion coefficient (D) of individual components. The above equation holds strictly for simple DOSY-NMR experiments, and is modified slightly to accommodate more complicated pulse sequences. In practice, a series of NMR diffusion spectra are acquired as a function of the gradient strength or as a function of diffusion delay with fixed gradient strength. For example, the Figure 1 shows a stacked plot of a simulated mixture of three compounds. It represents the results of a DOSY experiment where the signal decays as a function of gradient strength (g). The figure shows that there is a more pronounced attenuation of the signal intensity for the fast diffusing species.
There are several pulse sequences available for the collection of DOSY data. The main variations are centred around an additional delay time for longitudinal eddy-current. Also added to the pulse sequences are additional spoil gradients, water suppression pulses to remove the water signal from the generated spectra, and additional dimensions (i.e. three dimensional NMR) for increased structure information17-19. For the purposes of this study, the simplest pulse sequence was investigated
As the DOSY NMR experiment is essentially a series of one-dimensional experiments where the signal is slowly attenuated, the collected one-dimensional data needs to be processed and collated into a two-dimensional spectrum. Figure 2 shows a typical 2D DOSY spectrum of a fatty acid.
Figure. 1. Decaying NMR data with increase of gradient.16
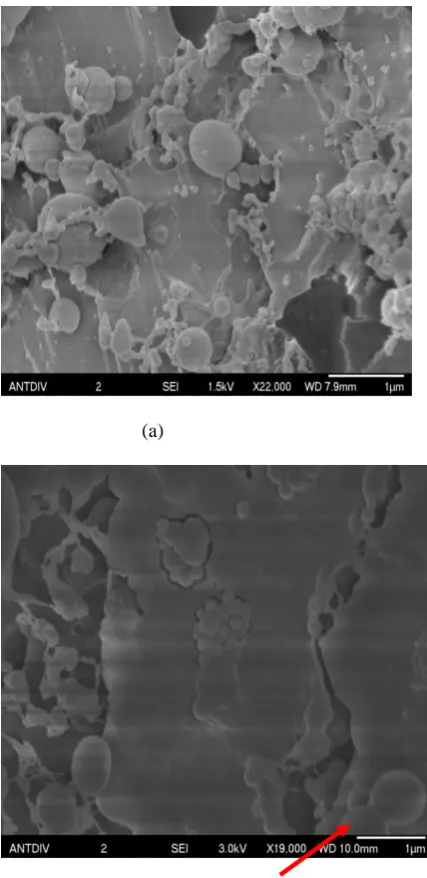
[image:3.595.315.526.80.290.2]DOSY experiments of aqueous solution of oleic, lauric and abietic acids were run at two different temperatures (20°C and 50°C) to try and establish an optimum temperature at which to run the experiment. Diffusion coefficients obtained using this technique for two fatty acids and a resin acid is listed in Table 1. Expectedly, lauric acid (m.wt.=200.3) diffused the fastest of the three. It is interesting to note that although oleic acid (m.wt.=283.4) and abietic acid (m.wt. = 302.5) are similar in size they diffused at significantly different speeds.
Figure 2: Two dimensional DOSY spectrum of lauric aicd with diffusion on the Y-axis and the chemical shifts on the X-axis..
[image:3.595.74.459.547.729.2]Table 1: Diffusion coefficient of the two fatty acids and abietic acid at pH 10 in an aqueous medium.
D/10-10m2/s
T(°C) oleic acid
abietic acid
lauric acid
20 0.4 3.3 4.8
50 4.2 54.5 320
The very slow diffusion by oleic acid suggests interactions between oleic acid molecules. This phenomenon is being further investigated. Increased temperatures indeed led to an increase in the value of diffusion indicating that the temperature has an impact on absolute diffusion although the internal interactions between fatty acid molecules does not seem to be disturbed by the increase in temperature. This technique is also a powerful tool to study complex colloidal material. Experiments using the same acids, (lauric, oleic, and resin acids), were undertaken at pH 5.5in 10mM KNO3 solution at three different temperatures. Under these conditions the acids are present in their colloidal forms. The results are presented graphically as a function of temperature in Figure .3. In colloidal form, abietic acid moves rapidily. Oleic acid remains the slowest.
Previous studies with dynamic light scattering support this observation by showing that abietic acid forms the smallest particle of the three20. Although not discussed in the present work it is worth mentioning that the technique can be used to study aggregation as well.
Figure 3: Effect of temperature on individual components and extracted pitch sample, in colloidal form, at pH 5.5 in 10mM KNO3 solution. Environmental Scanning Electron Microscopy
The Environmental Scanning Electron Microscope (ESEM) is one of the major innovations and a fundamental advancement in the field of electron microscopy21. ESEM is a scanning electron microscope (SEM) that allows a gaseous environment in the specimen chamber. It enables examination of practically any specimen under any gaseous conditions, unlike conventional SEM, which operates in vacuum. An electron microscope requires a good vacuum for the generation and propagation of the electron beam, which in the past meant that the specimen under examination had to be placed also in a vacuum. This condition limits the SEM, since either the specimens have to be modified and compromised by various treatments or the microscope's operational parameters must be constrained. The ESEM allows the examination of any specimen, wet or dry, insulating or conducting in situ and close to its natural state, while the environmental gas medium produces completely novel possibilities of operation and imaging.
The viewing of wet samples has become possible because water can be maintained in the liquid phase as long as the surrounding vapour is saturated. The saturation water vapour pressure varies with the specimen temperature from 609 Pa at the freezing point to around 2000 Pa at room temperature, a pressure range easily obtainable in a properly designed ESEM21. The conductive coating of specimens to suppress charge accumulation according to conventional practice is no longer
0 1 2 3 4 5 6 7 8 9 10
0 20 40 60 80
D/
10
-10
m
2/
s
Temperature (C) abietic
oleic
pitch
[image:4.595.315.537.67.265.2] [image:4.595.72.265.121.279.2]necessary because the gaseous layer around the specimen becomes ionized and suppresses charge accumulation.
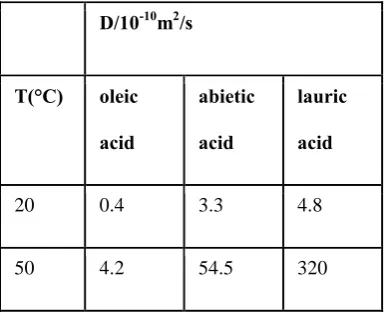
[image:5.595.316.526.80.276.2]Detailed description of ESEM is readily available in the literature. This discussion focuses on ESEM as a research tool to study colloidal material. Figure 4a to 4c shows colloidal particles formed by lauric acid are spherical. It also displays particle growth via coalescence.
This process of coalescence becomes very rapid in the presence of a salt and images change so fast that capturing the image becomes very difficult.
(a)
(b)
(c)
Figure 4. ESEM images of colloidal lauric acid undergoing coalescence. (a) particles are starting significantly small. (b) particles approaching through Borwnian motion. (c) coalesce leading to increased particle size.
Another possibility to observe such fast changing sample is to freeze the sample prior to visualization by SEM. CryoSEM promises such possibility22. In a cryo-scanning electron microscope images can be made of the surface of frozen material. The sample is rapidly frozen with liquid nitrogen. The cryo-chamber is equipped with a knife that can be handled from outside by means of a lever to fracture the sample for applications in which imaging of the surface of inner structures is needed. Next, humidity from the sample is sublimated and a thin layer of gold-palladium is "sputtered" on the material, this again for good conductance of electrons. Finally the entire or fractioned material is further inserted into a cool observation chamber.
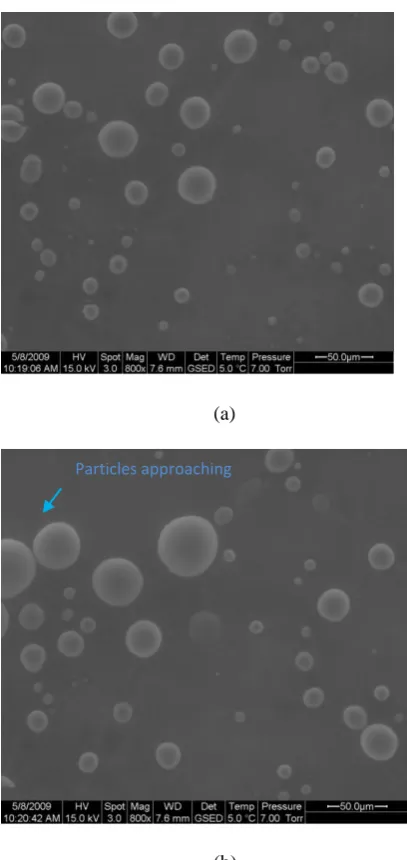
Observations using Cryo-Sem are shown in Figure 5a and 5b. Note that the samples were initially prepared at room temperature and then frozen soon after to lock any changes that were occurring. The image again confirms the spherical nature of the particles being formed. Also the process of coalescence can be observed. Although at present we do not have images as a function of time so that kinetics of change could be visualized, the capacity of the technique to look at fast changing system is well illustrated.
Particles approaching
[image:5.595.73.277.278.709.2](a)
[image:6.595.73.287.69.509.2]Coalescing particles
Figure 5: Cryo-SEM images of Pitch sample. (a) Spherical particle less than 1µm mostly is clearly visible. (b) Evidence of coalescence stopped due to freezing.
Conclusions
DOSY-NMR and ESEM have evolved into powerful tools for studying solution dynamics and probing colloidal structure, particularly that of complex mixtures. The parameter of interest, the diffusion coefficient, is of fundamental importance as it is determined by both the chemistry of the system, that is, the size and shape of the individual molecular species and its physical environment, that is, state, dissolved, dispersed, aggregated, and
so on. Understanding such behaviour is of central importance in studying colloidal dispersion. ESEM permits the observation of hydrated samples in their native state, and also does not require insulators to be coated with a conducting layer. These two factors make it ideal for studying colloidal dispersions as they aggregate. The examples discussed illustrate some of the many strengths of the ESEM and DOSY-NMR in the field of colloidal dispersions and aggregates and the study of pitch aggregation and deposition.
Acknowledgment
Cryo-SEM studies were carried out at the Australian Antarctic Division in Kingston, Tasmania.
Financial support for this project was provided by Norske-Skog Paper Mills(Australia) Ltd and an ARC Linkage grant.
References.
1. Lee, R., Stack, K., Richardson, D., Lewis, T. and Garnier G., ‘Photometric Dispersion Analyzer (PDA) to quantify pitch coagulation’, Proc. 63rd Appita Ann. Gen. Conf., Melbourne, Australia, 259,(2009).
2. Sihvonen, A.L., Sundberg, K., Sundberg, A. and Holmbom, B., Stability and Deposition Tendency of Colloidal Wood Resin, Nordic Pulp and Paper Res. J., 13 (1): 64, (1998).
3. Saarimaa, V., Lari, V., Sundberg, A.,
Pranovich, A., Holmbom, B., Mikael, S. and Folke, O., ‘Influence of pectic acids on aggregation and deposition of colloidal pitch’, Nordic Pulp and Paper Res. J., 21(5),:613(2006).
4. Vincent, D.L., ‘Studies on Pitch Deposition’, Pulp and Paper Mag., Can., 150-156, (1957).
6. Holmbom, B and Ekman, R., ‘The chemistry of wood resin’, in Pitch Control, Wood Resin and Deresination, Tappi Press, USA, 37, (2000)
7. McLean, D., Stack, K. and Richardson, D., ‘Wood pitch deposition versus composition’, 57th Appita Ann. Gen. Conf. Proc., Melbourne, 203, (2003).
8. Gutierrez, A., De Rio, J. C., Gnzalez-Vila, F. J. and Romero, J., ‘Variation in the composition of wood extractives from Eucalyptus globules during seasoning’, J. Wood Chemistry and Technology, 18(4), 439, (1998).
9. Lee, R., Stack, K., Richardson, D., Lewis, T. and Garnier G., ‘Kinetics of salt induced pitch coagulation under shear’, to be published in Colloids in Surfaces.
10. Lee, R., Stack, K., Richardson, D., Lewis, T., Garnier G. and Van De Van, T., ‘Measurement of pitch deposition by impinging jet microscopy- the effect of divalent salts’, Peer Reviewed paper to be presented at Appita Ann. Gen. Conf., Appita, 2010.
11.Qin, M., Hannuksela, T., and Holmbom, B., ‘Physico-chemical characterization of TMP resin and related model mixtures’, Colloids and Surfaces A: Physicochem. Eng. Aspects, 221, 243, (2003). 12.Merta, J., Garamus, V.M., Willumeit, R. and Stenius, P.,’Structure of complexes formed by PDADMAC and sodium palmitate’, Langmuir, 18, 7272(2002).
13.Price, W.S., ‘Application of Pulsed Gradient Spin-Echo NMR Diffusion Measurements to Solution Dynamics and Organization’, Diffusion Fundamentals,2,1(2005).
14.Prasad, V., Semwogerere, D., and Weeks, E.R., ‘Confocal microscopy of colloids’, J. Phys.: Cond. Mat., 19, 113102 (2007).
15.Tyrrel, H.J.V., and Harris, K.R., in Diffusion in Liquids: A Theoretical and Experimental Study, Butterworths, London, 1984.
16. Huo, R., Wehrens, R., van Duynhoven, J., and Buydens, L. M. C., ‘Assessment of techniques for DOSY NMR data processing’, Analytica Chimica Acta , 490, 231, (2003).
17.Brand, T., Cabrita, E.J., and Berger, S., ‘Theory and Application of NMR Diffusion Studies’, in Modern Magnetic Resonance – Part 1, Springer, Netherlands, (2007).
18.Pelta, M.D., Barjat, H., Morris, G.A., Davis, A.L. and Hammond, S.J., ‘Pulse sequences for high-resolution diffusion-ordered spectroscopy (HR-DOSY)’, Magn. Reson. Chem., 36, 706, (1998).
19. Xi, M. and Chaohui, Y., ‘Phase-shift presaturation for water peak suppression in biomolecular NMR experiments’, Science in China, 40(4), 345, (1997).
20.Rao, R.,’Progress Report#8’ UTas Inernal Report, (2009).
21.Methews, R. G. and Donald, A. M., ‘Conditions for imaging emulsions in the environmental scanning electron microscope; Scanning, 24, 75, (2002).