This is a repository copy of
Modelling drivers' car parking behaviour using data from a
travel choice simulator
.
White Rose Research Online URL for this paper:
http://eprints.whiterose.ac.uk/2003/
Article:
Bonsall, P.W. and Palmer, I.A. (2004) Modelling drivers' car parking behaviour using data
from a travel choice simulator. Transportation Research. Part C: Emerging Technologies,
12 (5). pp. 321-347. ISSN 0968-090X
https://doi.org/10.1016/j.trc.2004.07.013
Reuse See Attached
Takedown
If you consider content in White Rose Research Online to be in breach of UK law, please notify us by
White Rose Research Online
http://eprints.whiterose.ac.uk/
Institute of Transport Studies
University of Leeds
This is an author produced version of a paper published in
Transportation
Research. Part C: Emerging Technologies.
This paper has been peer-reviewed
but does not include final publisher proof-corrections or journal pagination.
White Rose Repository URL for this paper:
http://eprints.whiterose.ac.uk/
2003/
Published paper
Bonsall, P.W.; Palmer, I.A. (2004) Modelling drivers' car parking behaviour using data from a travel choice simulator. Transportation Research. Part C: Emerging Technologies, 12(5), pp.321-347
Modelling Drivers’ Car Parking Behaviour using Data
from a Travel Choice Simulator
Peter BONSALL1*, Ian PALMER2
1
The Institute for Transport Studies, University of Leeds, LS2 9JT, UK
2
formerly of The University of Leeds, now with MVA Limited, Manchester
(Proof version, October 2002, prior to publication as pp 321-347 of Transportation Research vol 12 C issue 5, October 2004))
ABSTRACT
This paper reports on models developed from data collected using the PARKIT parking
choice simulator. PARKIT provided an experimental environment in which drivers’
choice of car parks, and of the routes chosen to reach them, could be observed and the
influence of different levels of parking-stock knowledge (derived from experience or from
information provided via roadside message signs) monitored. Separate models were
estimated for the drivers’ initial choice of car park and for their revision of that choice as
their journey progresses and they learn about actual conditions. The importance of price,
walking time and driving distance is confirmed but the addition of variables describing the
drivers’ choices on previous days, their expectations and their immediately preceding
route-choice, greatly improved the models’ explanatory power. It is noted that variables
such as these are not generally considered because they are rarely available to the
modeller. Different discrete choice model structures were found to be appropriate for
different decisions. Route choice was represented as an exit-choice model (whereby each
journey is treated as a sequence of decisions – one at each intersection encountered). The
paper discusses the incorporation of these choice models into a network assignment model
and concludes that much of the power of the choice models is lost if the network model is
not able to support use of information about travellers’ socio-economic characteristics and
Keywords:
1 INTRODUCTION
1.1 Background
As congestion in urban areas continues to rise it becomes increasingly difficult for drivers to
find conveniently located parking spaces. This in turn brings problems for the urban economy
and the environment; perceived shortages in parking can dissuade people from travelling to
the city centre for work and leisure, while those that do drive in the centre spend unproductive
time searching for spaces or waiting in queues, thus further exacerbating congestion. Surveys
of drivers undertaken in British cities over the past ten years or so have indicated that up to
25% of the average total travel time of journeys to central urban areas is taken up in searching
for a parking space (Polak & Vythoulkas, 1993) while a study in Frankfurt (Axhausen et al,
1994) put the proportion during peak congestion at 40%. Research in London (May &
Turvey, 1984) calculated that between 30% and 40% of the travel distance for journeys
terminating in the central area was attributable to parking search.
In an effort to reduce these problems, an increasing number of city authorities are introducing
dynamic Parking Guidance and Information (PGI) systems which, via roadside variable
message signs at some distance from the parking facilities, offer drivers real-time information
on parking space availability and help them to make more informed choices. Such systems,
first introduced in Aachen during the early 1970’s, should also lead to a more efficient
utilisation of the parking stock by directing drivers away from congested sites and towards
According to research by Leichter and Schober (1985), full compliance with a system of static
parking direction signing could lead to a reduction in average journey time of up to 25%. The
potential benefits of a dynamic PGI system should be even greater but will crucially depend on
the level of compliance achieved. Factors affecting compliance have been found to include:
how information is disseminated; journey characteristics; parking preferences; and the level of
familiarity and local knowledge of the driver population (Axhausen et al, 1994). The drivers
who find PGI systems most effective tend to be visitors who are unfamiliar with the local
parking sites and so have no strong parking preferences. More frequent drivers, with local
knowledge of parking opportunities, are faced with trade-offs between search time, price and
location (with consequences for driving time and walk time).
The information that PGI systems offer has to be incorporated into an already complex
parking choice and search process. A number of researchers have sought to understand these
trade-offs and to model this decision process - see for example reviews by Young and Taylor
(1991), Young et al (1991), Muromachi et al (1992), Polak and Vythoulkas (1993), Polak et al
(1993), and Thompson and Bonsall (1997). It is generally agreed that the existing models
have suffered from a shortage of good data on search and choice processes; hence our interest
in new sources of such data.
1.2 The Role of Simulators
Substantial use is now being made by behavioural researchers of simulators which allow close
observation of subjects acting in an experimentally controlled world. The ‘travellers’ are
asked to undertake journeys which involve making choices in response to stimuli provided at
simulators depending on the level of computing technology available and the precise nature of
the experiment. However, all simulators share the common feature of placing subjects in
semi-realistic travel environments which allow for efficient collection of data on aspects of
their behaviour. Simulators provide the opportunity to collect data on behaviours and
situations which would be difficult to study in real life and which might not be so reliably
collected with standard questionnaires. It is argued (e.g. by Bonsall, 1993, and by
Koutsopuolos et al, 1995) that they have a particular role in the exploration of responses to
as-yet-unimplemented components of the transport system such as the various forms of
information and driver assistance currently under development.
Simulators have been developed for a wide range of purposes within the field of traveller
behaviour research. They range in complexity and expense from full scale driving
simulators such as those owned by major car manufacturers to PC-based devices which
are, in effect, animated or illustrated questionnaires (e.g. Swanson et al, 1997). The most
complex/expensive simulators have a manifestly high degree of ecological validity and
their use is appropriate when considering man-machine interface (MMI) issues,
particularly those related to safety. A particular growth area, however, has been in the use
of much cheaper, PC-based, devices designed to provide a more or less realistic
environment in which to study subjects’ route choice behaviour in a range of
circumstances. Several examples of such devices, usually known as ‘travel simulators’ or
‘route choice simulators’, are conveniently reviewed by Koutsopoulos et al (1995) or more
recently by Bonsall (2003). The validation work undertaken at Leeds with the IGOR and
VLADIMIR simulators (Bonsall et al, 1995, 1997) lead to the conclusion that such
simulators provide a very useful method for collection of data and that, if carefully
from that observed in real life. A particular feature of these simulators is that the
experimental subjects can experience a wide range of option attributes in the context of the
simulated journey rather than, as is the case with more conventional stated preference
methods, having a subset brought to their attention via an abstract list of attributes. This
more naturalistic approach should give the analyst more confidence that, if an option
attribute appears to be influencing behaviour, this is not simply because it was brought to
the subject’s attention in the option descriptions.
This paper describes models built on data from a simulator developed at the University of
Leeds within a joint research project with Imperial College and the University of
Southampton. The project was funded by the UK Engineering and Physical Sciences
Research Council and aimed to explore the effectiveness of PGI systems. The simulator
(‘PARKIT’) was specifically designed to explore the influence of PGI on parking choice and
search behaviour. PARKIT is similar to VLADIMIR in that it includes a fairly faithful
representation of the range and relative duration of the various stimuli involved when making
a journey, and thus differs from other ‘parking choice simulators’ (see Jones et al, 1994, and
Kurauchi et al, 1997) which do not seek to do this.
2 DESCRIPTION OF THE TRAVEL SIMULATOR USED IN THE STUDY
2.1 Introduction
• an introduction to familiarise the subject with what is required of them and to allow them a
‘test-drive’ in a simple network;
• a series of five journeys made by the subject in the simulated world;
• questions asked of the subject before and after each journey, and at the end of the session;
• a series of more detailed dialogues with the subject after completion of their final journey.
PARKIT runs on a portable PC. Its software maintains a log of all decisions made, and of all
answers provided by the subject. This facilitates subsequent analysis and allows for very
detailed investigation of the decision process.
2.2 PARKIT’s Representation of the Travel Experience
PARKIT provides a fairly detailed representation of the travel experience including driving,
searching for a parking space, queuing (if necessary) and walking to the final destination. Key
aspects of this experience are the context, audio-visual stimuli, the representation of the
passage of time, and driver control.
The context
Prior to each journey, the ‘driver’ is supplied with text describing the context of the journey
he/she is about to make. This includes the journey purpose and other relevant information
such as any required time of arrival at the specified destination.
These include:
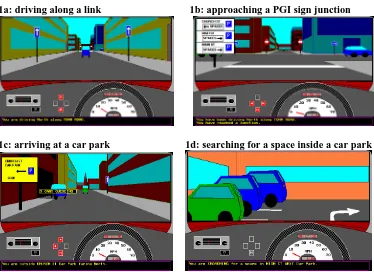
• a driver’s-eye view of a car dashboard including an animated clock, odometer, speedometer
and view through the windscreen (see Figure 1a);
• a sequence of computer-generated through-the-windscreen views of the urban streetscape
along the route ‘driven’ by the subject. New views replace earlier ones at a rate which
reflects the speed and a turn to the left or right causes the view to slide sideways in the
appropriate direction. The use of digitised photographs of real street scenes (as is done
in VLADIMIR) was considered but, rejected because it would have constrained the
experimental design and risked giving the subjects unwanted cues from the photographs
(see Swanson et al, 1997);
• roadside signs and parking information as seen through the windscreen (see Figure 1b);
• through-the-windscreen views of conditions while queuing to park (see Figure 1c) and
while driving within an off-street car park (see Figure 1d);
• an engine sound which is emitted while the subject is ‘driving’ and whose note is
proportional to speed;
• a pedestrian’s view of the walk from the car park to the final destination.
+++++++++++++++++++++
PLACE FIG 1 ABOUT HERE
++++++++++++++++++++++
Previous work with VLADIMIR suggested that time spent on different elements of the
simulated journey is an important determinant of the subject’s perception of the journey
and hence of their behaviour. PARKIT seeks to ensure that the subject experiences the
consequences of his/her decisions in a very direct way. For example, completion of an
off-side turn (crossing a stream of traffic) takes longer than that of a near-off-side turn, a decision
to enter a queue is followed by an enforced wait, choice of a car park at some distance
from the final destination results in a time consuming walk.
Perception of the passage of time is dependent on the nature of the activity being
undertaken - particularly how stimulating it is. Thus there is a case for differential
factoring of the time spent driving, queuing, searching for a space within a car park, and
walking to the destination. In the interests of efficiency of data collection, PARKIT
journeys have to be represented in less than real time. In order to complete four or five
journeys within a 45 minute session, the overall journey time needs to be reduced to roughly a
tenth of real-time. This constraint, together with the conventional wisdom that excess time is
perceived to be twice as irksome as in-vehicle time, led to the adoption of a 1/12 factor for
drive time and a 1/6 factor for queuing, parking and walking time.
The subject’s perception of the passage of time is reinforced by the dashboard clock (running
at an appropriately accelerated rate) while he is in the car. During the walk to the final
destination this function is performed by an animated wristwatch and an empty rectangle
whose initial length is proportional to the distance to be walked and which is progressively
filled from the left as the subject ‘walks’ this final stage of the journey.
The subject controls the ‘car’ by pressing appropriate keys on the keyboard. The options
available to the driver at any point in the exercise are highlighted in red in the centre of the
dashboard. While driving, the options at each intersection are to continue forward, turn
left or turn right; when a car park is reached the options are to drive on or enter the car
park (joining the queue if there is one); and after joining a queue the driver has the option
of leaving it to rejoin the road. Choice of an option is confirmed by the highlight turning
yellow. A decision to turn left or right is confirmed by a light on the dashboard flashing
yellow while a ticking (‘indicator’) sound is heard.
On-line help, for example to remind the subject of the options currently available or of the
journey purpose and expected arrival time, is accessed at any stage via a special key. Use
of the help facility is logged for potential analysis along with other items such as the
amount of time taken by the subject to make each decision. Other features of the interface
include display of a compass among the equipment on the dashboard and provision of text
at the bottom of the screen to inform the ‘driver’ of his/her current location. These features
can assist drivers in navigating in the simulated city.
2.3 Representation of knowledge
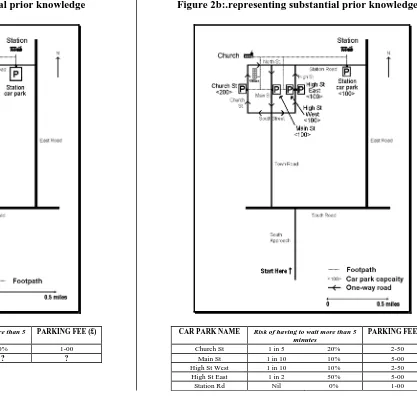
Before each journey the subject is given a hardcopy briefing sheet which represents the prior
knowledge he is assumed to possess. By varying the amount of information shown on the
sheet, different levels of prior knowledge can be simulated. Figure 2 shows examples of
sheets appropriate to different levels of prior knowledge. Figure 2a is quite schematic and
European-style city. Figure 2b contains much more detail including the price and expected fullness of
each car park – a level of detail which implies considerable familiarity with the city and its
parking stock. Note that expected fullnesses are presented in terms of probabilities of having
to wait more than five minutes to get into a particular car park and that they are expressed both
as ‘percentage chances’ and as ‘x times out of y’. This mode of presentation was chosen after
some experimentation with alternatives and allows for differences in the way people perceive
probabilities. Although use of the hardcopy sheets necessitates the presence of survey staff to
administer them, this arrangement proved better than providing the prior ‘knowledge’ via the
screen. (Subjects often wish to consult their ‘knowledge’ while making the journey and
toggling back and forth between the journey screens and ‘knowledge’ screens could be quite
confusing for them.)
The second important source of ‘knowledge’ is, of course, the experience which the subject
accumulates on each journey. If a subject makes a series of journeys in the same network they
may be build up their own picture of the network structure, the traffic conditions, the location
of car parks, their prices, typical delays encountered when entering them and the walking
distance required to reach the final destination.
The third source of knowledge, and the original motivation for our research, is information
displayed on roadside signposts or via PGI displays. PARKIT subjects are provided with this
information via their windscreen views (as in Figure 1b).
+++++++++++++++++++++
2a and 2b should be side by side
++++++++++++++++++++++
2.4 Questions and Dialogues
Although the simulated journeys are the main feature of PARKIT, the questions and dialogues
fulfil an important function in the experiment. The questions are designed to elicit information
about the subjects’ perceptions, expectations and intentions before setting out on the journey
and about their impressions immediately afterwards. Questions asked before starting the
journey focussed on the drivers’ intentions and expectations (see, for example, Figure 3a)
while questions asked after the journey were concerned to discover whether the driver was
satisfied with the route and car park they had just used and whether, on a subsequent occasion,
they might set off at a different time or choose a different route or car park. Note that
questions are not asked during a journey because, even though it would be useful to get data
on how perceptions and intentions alter during a journey, en-route questions would detract
from the primary goal of making the journeys as realistic as possible.
+++++++++++++++++++++
PLACE FIG 3 ABOUT HERE
Big enough for text to be legible
++++++++++++++++++++++
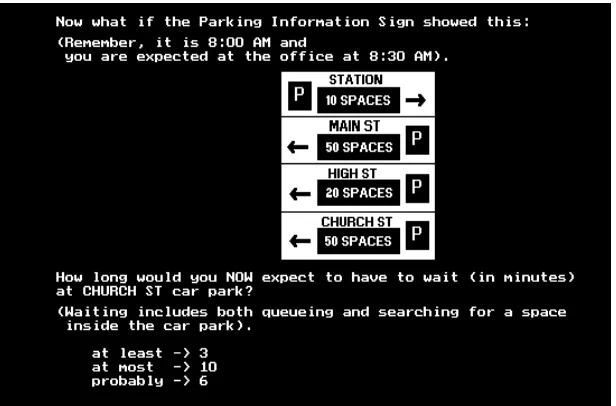
Once sufficient journeys have been completed, PARKIT enters ‘dialogue’ mode which
enables subjects’ responses to a range of specific stimuli to be assessed more quickly than
for example, explore the effect of different PGI information on expected wait times at car
parks. Thus a dialogue might involve displaying a given sign and then asking a series of
questions - as in Figure 3b. It may be supposed that, because the subject will by this stage
have just completed several PARKIT journeys and have experienced the consequences of
their decisions, the answers to these questions will be more reliable than would otherwise be
the case.
Once all journeys and dialogues have been completed, or if an interview duration limit has
been passed, a series of debriefing questions are asked. These collect socio-economic
characteristics and attitudinal data as well as asking the subject’s opinion of the realism of
their behaviour in PARKIT. This question enables data to be flagged for exclusion from
subsequent analysis if, for example, the subject does not maintain that their behaviour in
PARKIT was the same as it would be in real life.
2.5 Experimental Design
The experimental design was intended to produce data to support investigation of the factors
affecting drivers’ choice of car parks and the influence of PGI information on that choice. It
was further intended to reveal whether behaviour was dependent on the characteristics (age,
sex and income) of the subjects, the extent of their prior knowledge of the network and
parking stock, and the nature of the journey being undertaken. These issues were catered for
via an experimental design which allocated subjects to a configuration of five journeys and
The map in Figure 2b shows the network and car park stock used throughout the study. The
layout includes interesting route and car park choices such as those between the route to the
town centre (with its range of car parks) and the route to the station (with its single, less
centrally located, car park) or between Church Street (with its single car park with 200 spaces)
and High Street (with its two car parks with 100 spaces each). Although we were interested in
subjects’ behaviour in networks with which they were not very familiar, we did not, in these
experiments, wish to study the problems which occur when drivers get lost. We therefore took
steps to make navigation easy; for example, the network was a simple grid, all streets and car
parks were descriptively named, the pre-trip briefing sheets included an annotated map, a
compass was included on the dashboard to complement the north-arrow on the map, and text
was provided at the bottom of the screen to indicate what street the driver was currently on
and which way he was heading.
The drivers’ level of prior knowledge was controlled via the pre-trip briefing sheets. Each
subject made one trip with minimal information on the sheet (as in Figure 2a which only
indicates the basic structure of the city and that there is parking at the rail station) and then
four more trips with much more information (as in Figure 2b which provides full details of the
network and parking stock including prices and typical risks of having to queue). The drivers’
experience of the network was allowed to build up through each journey made.
Two journey purposes were employed in the experiments; one was a journey to “an important
business meeting” which was due to start at 0830 (the current time being 0800), the other was
an off-peak shopping trip. Each purpose had an associated destination within the city centre.
Half of the subjects were allocated to each journey purpose and retained that purpose for all
Three different regimes of parking charges were devised, each giving rise to a different
expected pattern of queuing at car parks. (The table under the map in Figure 2b is an example
of one such regime together with the resulting expected queuing pattern). Each subject
completed two journeys under one regime and then three more under another regime. They
were informed of the current regime of prices and expected queuing pattern via the pre-trip
briefing sheet. There was, however some daily variation in the queuing pattern and drivers
would not be aware of the precise conditions on any given day until they saw a PGI or reached
a car park. All three patterns were primed to include particularly severe congestion in the city
centre car parks on the fifth journey.
Two types of PGI sign were employed in the experiments; ones displaying simply either
“FULL” or “SPACES”, and ones displaying the actual number of spaces available. An
experimental design was devised to allow us to explore whether the different types of sign had
different impacts on behaviour, whether PGI had a different impact on drivers who were
unfamiliar with the city and whether the presence of PGI changed the unfamiliar drivers’
perception of the stock. This involved exposing half our subjects to each type of PGI and,
across this, having half our sample receive PGI while they were still unfamiliar with the city
while the other half did not receive it until they had become familiar. In each case, the subject
was provided with an example and text description of the relevant type of PGI system just
before the first journey on which they were to experience it.
The content of the PGI signs varied from one journey to the next but was always consistent
with the actual fullness of the car parks as it would be when the drivers got to them. For the
at the car park. A separate study (Lai, 1997) used PARKIT to investigate the effect of varying
the occupancy threshold used to control the switching of signs from “SPACES” to “FULL”
and found that, if the threshold were raised such that the signs sometimes said “SPACES”
when the wait time was excessive, drivers began to ignore the signs.
PARKIT’s dialogue facility was used to explore how subjects’ intended choice of car park and
their perception of likely waiting times was influenced by information they saw on the PGI
signs. As in the previous 5 journeys, subjects were presented with pre-trip information and a
journey scenario and then asked which car park they intend to try first and what maximum,
minimum and probable wait times they expected at that car park. At which point, instead of
continuing their journey, they were presented with a set of PGI information and asked to
review their choice of car park and their expectation of the maximum, minimum and probable
wait time at that car park. These questions were repeated for two further sets of PGI
information and then the sequence was then repeated with different pre-trip information and
three further sets of PGI information.
The overall structure of a PARKIT session is summarised in Table 1.
+++++++++++++++++++++++
PLACE Table 1 ABOUT HERE
+++++++++++++++++++++++
PARKIT surveys were carried out in 1997 and 1998 in London, Southampton and Leeds. The
London sample (of 46) were recruited from among regular car drivers recruited at the main
shopping centre in Kingston. The PARKIT sessions were conducted at the respondents’ own
homes. The Southampton sample (of 50) were drawn from an address list collected for the
ROMANSE research project; individuals were contacted by telephone and those who were
willing to participate in the study were invited in to the university for the PARKIT interview
and were offered £10 to cover expenses. The Leeds sample (of 55) were recruited from
among employees of companies in Leeds city centre, with the interviews being conducted at
the subject’s workplace (see Firmin, 1999, for details of the survey procedure).
3. RESULTS
3.1 Preliminary Analysis of the Data
Fifteen out of the 151 subjects thought that their behaviour in real life would be other than
what it was in PARKIT and one thought that it would be very different. The data from these
subjects was excluded from the subsequent analyses.
A number of interesting tendencies were apparent in the subjects’ behaviour and in their
answers to questions. Subjects’ behaviour during the parking journeys appears to have been
intuitively reasonable and there was evidence of some interesting price/wait/walk tradeoffs
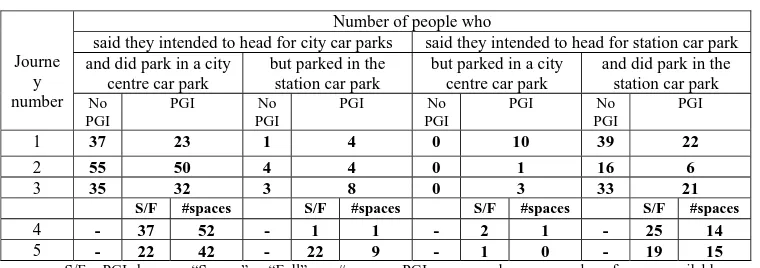
and of the effect of increased knowledge. Key results, including intentions and eventual
Row one shows that a majority of drivers on their first (unfamiliar) journey preferred to head
for the Station where, from their prior knowledge as summarised in Figure 2a, they knew there
would be a car park. However, several of the unfamiliar drivers who had PGI available were
persuaded to change their initial intention and to park instead in the City Centre. Comparison
of rows one, two and three shows that many of the drivers without access to PGI, although
initially wary of heading for the city centre, were prepared to venture there after they became
more familiar with the city but, by their third journey, many of them had concluded that the
Station was preferable after all. Rows one to three also suggest that PGI was the main reason
for drivers changing their mind after their initial statement of intent. Comparison of rows one
to four shows that, as drivers became more familiar with the city, they were less influenced by
the PGI and more likely to stick to their initially intended car park. On the fifth journey a
particularly strong message was displayed on the SPACES/FULL signs (namely that all city
centre car parks were full). This message influenced about half those who had been heading
for the City Centre to go to the Station instead. Overall it is clear that most PGI messages
succeeded in influencing only a minority of drivers - most drivers ended up parking in the car
park that they had initially intended to head for.
+++++++++++++++++++++++
PLACE Table 2 ABOUT HERE
+++++++++++++++++++++++
Analysis of the data from the pre-trip questions revealed a clear link between the expected
length of queues at city centre car parks and intentions to use the station car park; the mean
expectation of city centre queues was 12 minutes for those intending to head for the city centre
the dialogues (Thompson, 1998) suggested that there were some interesting gender-related
differences in the way in which the expected waiting times were influenced by the information
provided.
3.2 Approaches to Modelling Behaviour Revealed in the PARKIT Data
The immediate aim of our analysis was to provide colleagues in Southampton with
behavioural models which could be used within a network assignment model to predict
drivers’ response to PGI (see Waterson et al 2001). This required us to devise models which
would be compatible with the CONTRAM environment in which they were to be applied – a
constraint which ruled out many of the more advanced approaches to modelling the impact of
information on driver behaviour (see Bonsall, 2000). The CONTRAM model used in the
study was able to represent individual travellers with an origin, a destination and an assumed
binary level of familiarity with the network and parking stock. The parking stock could be
represented in some detail (location, price and, via demand-capacity relationships, degree of
congestion and queuing).
The project team took the view that drivers could be assumed to choose a car park before
setting off on their trip (with the possibility of revising this choice if they received PGI
before commencing the trip – for example via TV, radio or Internet) and that, once they
had set off, they could be assumed to drive a path through the network taking account of
their intended car park, of their knowledge of other potential car parks, of conditions
encountered en route and of any PGI information received. The car park where they
eventually parked might or might not be the one they intended to use when they set off.
(if pre-trip PGI becomes available), some sort of route choice and, possibly, a decision to
stop and park. Sections 3.2.1-3.2.4 will discuss the use of PARKIT data to support such
models.
Appendix 1 lists and defines the variables used in the models. Numerous alternative
specifications were tested prior to selection of those discussed below. In each case the
performance of a number of different specifications were compared. Simpler structures and
fewer parameters were preferred unless a more complex structure, or longer list of parameters,
produced a significant reduction in the final likelihood. In seeking to explain a driver’s
decisions and behaviour during a given journey we made use of data relating to that journey
and to journeys previously made by that driver. This allowed us to pick up any lagged effects
or habit effects but, given our decision to use a standard/nested logit structure, ruled out a
more formal investigation of serial correlations between different journeys.
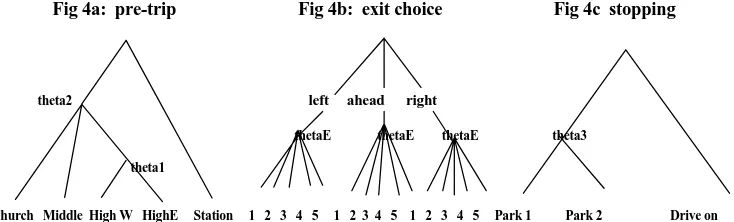
Figure 4 indicates the nesting structures referred to in the sections 3.2.1-3.2.4.
+++++++++++++++++++++
PLACE FIG 4 ABOUT HERE
++++++++++++++++++++++
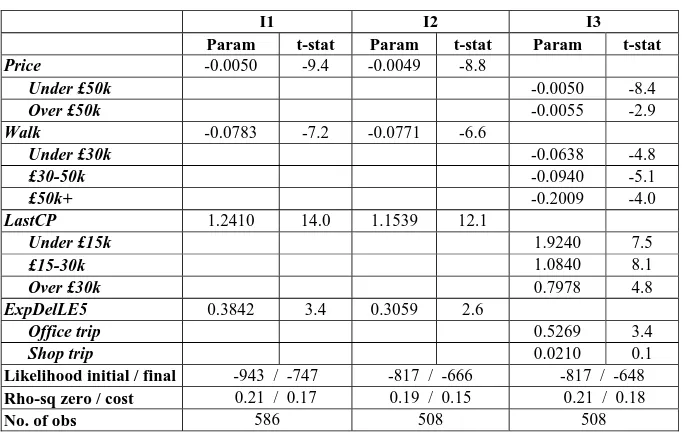
Prior to each main journey in PARKIT, subjects were asked which car park they intended
to head for. The best models of this, based on data from subjects who were deemed to be
familiar with the network, are shown in Table 3. Model I1 includes all data, while models
I2 and I3 exclude data from subjects who refused to reveal their income. The dominant
factor explaining intentions is clearly the tendency of drivers to select the car park they had
used in their most recent journey. This suggests that, in PARKIT as in real life, people’s
behaviour has a strong routine or habit component. The habit component appeared to be
particularly strong amongst the lowest income group. The price of the car park and
implied walk times influenced the choice; higher income people were less likely to choose
car parks which would result in a long walk to the destination. The value of walk time
(15.5 p/min) implicit in the ratio of the price and walk parameters is close to standard
values but the absence of a significant income effect on the price parameter in Model I3
was surprising (see later discussion). The effect of the prior expectation of queuing delays
at car parks was best represent by a simple binary variable and, as might be expected, had
more influence on the work journeys (for which there was a tight deadline) than on the
shopping trips. Drive time is conspicuously absent from the list of significant explanatory
variables, suggesting that, before setting off on their journey, the drivers considered the
drive time as being of little consequence in their choice of car park.
Nested models with structures such as that shown in Figure 4a (which reflects the structure
of the city network) were estimated but, since the scale parameters were not significantly
different from unity, a simple multinomial structure was maintained.
+++++++++++++++++++++++
PLACE Table 3 ABOUT HERE
3.2.2 Familiar drivers’ revised choice – after seeing pre-trip PGI
This model seeks to show how pre-trip PGI influences drivers to revise their choice of car
park. The data came from the PARKIT dialogues where, having asked drivers which car
park they would head for based on the car park attributes and their experience, we
introduced pre-trip PGI information and then asked which car park they would now head
for. These data were used to calibrate a nested logit model reflecting the network
structure: a lower nest for the High St car parks, and a higher nest for the city centre car
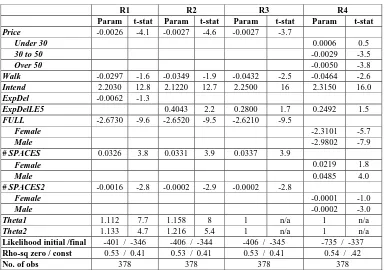
parks against the station car park (see Figure 4a). The models are shown in Table 4. In
Models R1 and R2 the estimated structural parameters are greater than, though not
significantly different from, unity and so in Models R3 and R4 the theta coefficients are set
to 1. Note that the nested structure was maintained so that PGI information that applied to
groups of car parks could be included in the calibration without having to impose an
arbitrary process to “split” the information between the constituent car parks.
Model R1 is an attempt to fit a linear parameter to the probability of having to wait (as
supplied on the pre-trip briefing sheet) and, unsurprisingly, the fit is poor. R2 indicates
that this variable is better represented as a simple binary operator – which suggests that
drivers perceive the probabilities in quite simple terms. The relative size of the PGI
variables (and their t-statistics) indicates that they are seen as more influential than the
information provided on the pre-trip briefing sheets. The FULL variable has a strong
negative effect in all the models. For the range of spaces for which the models were
calibrated, the #SPACES and #SPACES2 variables taken together have a positive effect
has a strong positive weight equivalent to the negative weight of a FULL PGI – which
indicates a reluctance by drivers to abandon their original choice.
Model R3 presents R2 with constrained structural parameters to replicate a multinomial
logit model. As expected the change in parameter values, except for ExpDelLE5, is
negligible. R4 then represents a segmented version of the combined R3 model. This
indicates that females are less influenced than males by the PGI information, particularly
when the information is presented as the number of spaces still available. Segmentation of
Price indicates that the under 30s are insensitive to price in the presence of PGI while the
over 50s still include it in their decision making.
All three combined models produce values of walk time of round 13p/min - which is again
fairly close to standard values. The fact that drive time still does not appear in the models
reinforces our conclusion that, once other more dominant factors such as price have been
considered, drivers are not taking much notice of drive time during their pre-trip
consideration of car parks.
+++++++++++++++++++++++
PLACE Table 4 ABOUT HERE
+++++++++++++++++++++++
Our previous work on driver route choice has persuaded us that route choice in the
presence of en-route information is conveniently modelled as a series of en-route choices
at each intersection reached rather than as a full path or route identified in advance and
adhered to whatever conditions are met. We therefore decided to model the route choice
within PARKIT as a series of exit choices. The possibility of specifying separate models
for route choice on the way to a car park and for the decision to join a queue to enter a car
park was investigated but, for familiar drivers, was not found to outperform a single model
wherein the decision to enter a car park would be represented simply as an exit choice
within the route choice model. The model was formulated such that the utility for an exit
was the logsum of the utilities for the car parks that could be reached via that exit. Since at
a number of decision points all of the car parks could be reached via any exit, car parks
were “assigned” to the exit that led to the minimum distance route to that car park.
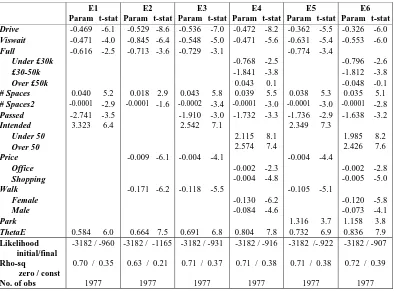
Table 5 shows a number of the models calibrated on this basis while Figure 4b shows the
nesting structure used. The scale parameter ThetaE for logsum of an exit can be
interpreted as a spread parameter - the higher the value, the better the model explains the
behaviour (i.e. the more deterministic the decision process as implied by the explanatory
variables). A single scale has been used for all exits as the model has been conceived as a
generic exit choice model – the model does not know whether an exit is, say, an off-side
turn.
+++++++++++++++++++++++
PLACE Table 5 ABOUT HERE
A particular feature of these exit-choice models (notably E3, E4, E5 and E6) is the low
relative weighting given to the price of parking and the lack of any significant difference in
the way that price is viewed by people with different incomes. It appears that, once they
set off on their journeys, PARKIT drivers take little further account of the relative costs of
parking in the different car parks. This may be because they have already taken this into
account in their initial choice of car park - an idea supported by the observation that the
price coefficient in E2 (which does not include the Intended variable) is twice that in E3,
E4, E5 or E6 (which do include the Intended variable). However, this is not a complete
explanation because the price coefficient in E2 is still quite low and, as was noted in model
I3, there was no significant difference in the way that price was viewed by people with
different incomes for the initial choice either. A possible explanation of the relatively low
weightings on price is that, while PARKIT provides subjects with a reasonable proxy for
the passage of time, it does not ask them to part with money when “paying” the parking
charges. The apparent tendency of people to put less emphasis on price when they are on
work trips may reflect the fact that the work trip had a time constraint which would cause
drivers to prefer an expensive car park with no queue to a cheaper one with a queue.
Females seem to be more off-put than males by a long walk to their final destination but,
even for females, the weighting of Walk is low relative to that of Drive. The low
weighting on walk is probably due to the fact that walk time, like price but unlike drive
time, featured strongly in the initial choice of car park and is thus represented via Intended.
The contribution of the PGI variables to overall utility is less than in our I-series or
R-series models - which suggests that PGI information may have less impact away from the
choice revealed no obvious gender difference in the response to PGI. Models E4 and E6
suggest a curious income effect in the response to a FULL PGI sign. We have no
satisfactory explanation for this.
The net effect of the Intended car park dummy which was seen in the R-series models
appears to be maintained in the E-series models and we note that older drivers are less
likely than younger drivers to change their intentions.
3.2.4 Unfamiliar drivers’ behaviour
The models presented in Tables 3, 4 and 5 were calibrated on data from familiar drivers
(those whose prior knowledge was obtained from Figure 2b rather than Figure 2a).
Attempts were made to calibrate models of unfamiliar drivers’ pre-trip choice of car park
and of their choice of route but without any success. It appears that, in the absence of prior
experience and knowledge, the pre-trip and route choices of unfamiliar drivers were
essentially random. In the light of this evidence it was decided that, in CONTRAM,
unfamiliar drivers would be represented as randomly selecting a car park near their
destination and then following the shortest route to that car park. It was however thought
useful to explore the possibility of a model which could represent their decision, having
arrived at a car park on their route, whether to stop and park or to drive on.
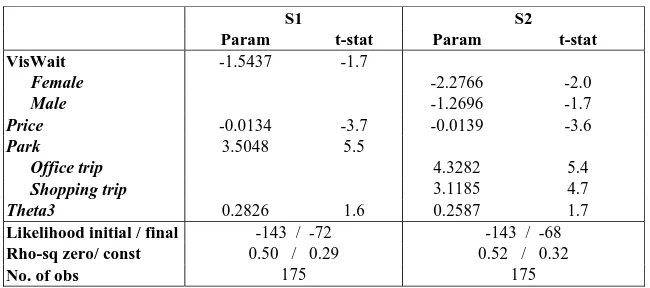
Table 6 shows models calibrated on the stopping behaviour of unfamiliar drivers in
PARKIT (those whose prior knowledge was as per Figure 2a). The models are based only
on the length of any queue and the price of the car park (as displayed outside the car park).
+++++++++++++++++++++++
PLACE Table 6 ABOUT HERE
+++++++++++++++++++++++
The models’ overall fit is good but this is largely due to the fact that most drivers decided
to park at the first car park they came across – a fact reflected in the large value for Park.
Clearly the drivers were not very particular about the characteristics of the car park and
were happy to use the first parking place they found in the unfamiliar network. We
recognise that this result reflects the limited nature of the prior knowledge included in
Figure 2a - had Figure 2a included details of the car park nearest to the destination then the
results might have been quite different.
Contrary to the general stereotype, we note from model S2 that females are more likely
than males to be put off by a visible queue. The fact that people were more likely to stop
on work trips than on shopping trips may reflect the greater time pressure associated with
the work trips.
3.2.5 Expectation of wait time
Although not necessary for the prediction of behaviour in the CONTRAM model, or in
general modelling, it was thought it might be interesting to use data from the PARKIT
dialogues to investigate the factors influencing subjects’ expectations of the wait time at
each car park. The analysis was conducted with regression models because they allow a
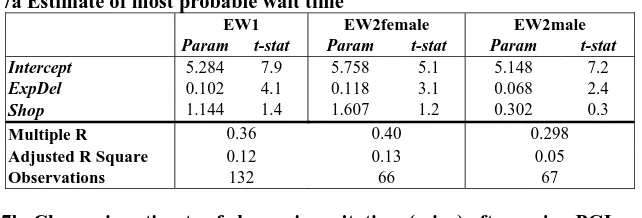
approximately normally distributed, a linear regression was deemed appropriate. Two
models were developed. The first sought to discover whether the drivers’ initial
expectation of the most probable waiting time could be explained by the information on
likely car park delays provided in the pre-trip briefing sheet (ExpDel), the trip purpose
(Shop) and the driver’s gender. The second explores factors influencing the degree to
which the driver’s initial expectation is modified by seeing PGI information shortly after
departure. The results are shown in Table 7.
+++++++++++++++++++++++
PLACE Table 7 ABOUT HERE
+++++++++++++++++++++++
The intercept in model EW1 indicates that, for an office trip, even when the pre-trip
briefing sheet suggested a zero probability of having to wait more than 5 minutes, the
average expected wait across the initially chosen car parks was more than 5 minutes. This
suggests either that our subjects did not understand the information on the pre-trip briefing
sheet, or that they were of a pessimistic disposition! ExpDel is entered as a linear variable
and indicates that an increase of 10% in the pre-trip probability of having to wait at least 5
minutes leads to a 1 minute increase in the estimate of the probable wait at a chosen car
park. [Given that the pre-trip briefing sheet presented the probability of a 5 minute wait in
percentage terms, other functional forms might be expected to perform better, several were
tested but none gave improved model fit.] Although not statistically significant, the Shop
dummy variable suggests that, other things being equal, longer wait times are expected on
males, females put much more weight on the information received in the pre-trip briefing
sheet and also add more on to their estimates for shopping trips.
Table 7b shows the extent to which the subjects’ expected wait times changed after seeing
PGI information. Reassuringly, PGI information has a significant influence - if a sign
indicates “FULL” the expected wait time rises by an average increase of 3.3 minutes, and
the higher the number of vacant spaces indicated for the chosen car park the greater will be
the reduction in estimated wait time. The PGI information apparently has more impact on
females’ expected wait times than on those of males.
The subject’s own initial expectation of probable wait time (InExpPWT) has a very
significant influence - the larger the initial expectation the lower the increase in
expectation. This ‘compensation’ effect, which is most marked for females, suggests a
regression to the mean which probably reflects a tendency to expect wait times within a
reasonable range whatever the PGI says (thus an initially high expectation cannot be
increased as much as an initially low one). The Shop dummy indicates that the extra wait
time associated with shopping trips is further reinforced, particularly for females, when the
expectation is revised after seeing PGI. Unsurprisingly, the pre-trip information does not
have a significant influence on the change.
The finding from EW4 that PGI has more influence on females’ than males’ expectations
of wait time is interesting when compared to the finding from model R4, which suggests
that females’ choices of car park are less influenced by PGI. It appears that, although
females take more notice of PGI in their estimates of wait times, their eventual choice of
. CONCLUSIONS AND FURTHER WORK
4.1 Conclusions on the Models
The development of models for application in CONTRAM was constrained to exclude
variables which would not be available within a CONTRAM environment. Models I1, R3, E5
and S1 were deemed to be the best models from PARKIT data which met this constraint.
These models provided a good explanation of the data but were not as successful in this
respect as those models which utilised more of the disaggregate and lagged information
available within PARKIT.
The link between expectation and choice is clearly not straightforward. The EW models
are interesting but clearly do not provide a complete explanation of drivers’ expectations
of wait times.
4.2 Conclusions on PARKIT as a Source of Data for Analysis of Parking Behaviour
The results have demonstrated that PARKIT produced data with which to estimate the
effect on route choice and car park choice of conventional variables such as journey time
and cost as well as of less widely modelled variables such as the information provided on
PGI signs, and the different contributions of drive time, walk time and queuing time.
different choices and to report their impressions, we have been able to explore issues such
as learning, habituation, anticipation, intention and the dynamics of an evolving decision.
Naturally, the calibrated values of the behavioural coefficients reflect the attributes of the
network and parking stock in which the behaviour was observed (in our case this is the
PARKIT network shown in Figure 2b) and, except where the models include separate
coefficients for people with different characteristics, the characteristics of the observed
population of drivers. A particular strength of the PARKIT approach is that these influences
are not hidden, as they often are in data derived from observing behaviour in “real” networks,
and may be identified by appropriate experimental design.
The richness of the PARKIT database and the high degree of experimental control afforded
to the analyst, allowed examination of issues such as habituation of behaviour and the
impact of prior knowledge which are difficult or impossible to address with more
conventional data sources.
Almost all the PARKIT subjects claimed to have behaved in the PARKIT environment as
they would have done in the real world (data from those not making this affirmation were
excluded from the analysis). This claim would seem to be supported by the intuitively
reasonable values derived for most of the behavioural coefficients in the modelling work.
However a concern remains that PARKIT subjects perhaps took less notice of price than
might be expected. This may be because, while they were made to suffer the time
consequences of their choices (eg having to wait while their car was queuing to enter a car
park), they did not have to pay the parking charges out of their own pocket. There is an
fee. This approach was indeed used by the authors in their previous work on road user
charges although, as discussed in Bonsall (2002), it is not without difficulties.
Another concern with the current work is whether the representation of prior knowledge
via briefing sheets such as those in Figures 2a and 2b is adequate. As was noted in section
3.6.4, the behaviour of unfamiliar drivers reflected the “knowledge” contained in Figure
2a. It may be that this characterisation of a newcomer’s knowledge would not be
appropriate for those drivers who would not dream of setting off on a journey without
precise instructions on how to reach the destination by car and on the location of the
nearest car park. We would certainly not wish to suggest that Figure 2a, or any other
single characterisation of restricted knowledge, is appropriate for all drivers and, in an
ideal experiment, would wish to explore the effect of allowing for different patterns of
unfamiliar drivers’ knowledge. One approach might utilise the subjects’ actual knowledge
of a real city but this would require a survey of current knowledge and considerable loss of
experimental control.
The experimental protocol outlined in Table 1 seeks to present the software, familiarise the
user with its use and then use it to explore a range of issues connected with network
knowledge, learning and experience - all within a 45 minute session. This may be thought
to be a trifle ambitious and some would question whether, using such a protocol, we can
really expect the subjects to be responding in a realistic manner to the stimuli presented.
We cannot, of course, prove that the behaviour exhibited in PARKIT is representative of
that in the real world, but we can draw some comfort from the subjects’ own assertions that
they were behaving as they would in the real world, from the fact that the behaviour is
VLADIMIR, was painstakingly compared with that in real life, the fit was very impressive
(see Bonsall et al, 1997).
Having now used data from the PARKIT simulator, we conclude that it is a very powerful tool
for the investigation of parking behaviour. The fact that PARKIT runs on a PC made it
possible to take the tool to the subjects rather than requiring the subjects to visit a research
office or laboratory. This facilitated achievement of a large and representative sample of
subjects. Although the presence of an interviewer was not strictly necessary (thus allowing
savings in cost and removal of a potential source of bias), it was in practice convenient to have
survey staff on hand to administer the session and record their impressions of how the subject
performed. A typical PARKIT session lasted around 45 minutes – which was long enough for
the subject to get into the spirit of the exercise but not so long as to risk respondent fatigue.
In conclusion, PARKIT appears to have been well received by subjects and survey staff and
the resulting data appears to be sound and to reflect a number of interesting facets of
behaviour and perception relevant to parking choice behaviour and to responses to
information. The flexibility offered by PARKIT offers the possibility of exploring a very wide
range of issues.
4.3 Further Work
This paper has highlighted that further work could be undertaken in the statistical modelling of
parking choices, the factors affecting the parking environment and the development of the
Our work has raised a number of statistical modelling issues which could usefully be further
explored. These include:
• the use of lagged variables to represent the (reducing) impact on exit choices of
decisions made, and PGI information received, at earlier stages of the journey - it is
recognised that this may require a move away from the standard logit approach.
• alternative nesting structures and the flexibility offered by Mixed Logit;
• the extent to which PARKIT has been able to capture any tendency of drivers to prefer
near-side turns over off-side turns.
PARKIT was written such that the details of the simulated world, the journeys, the
questions and the dialogues can be altered by the experimenter. This flexibility allows the
software to be configured to study a wide range of parking-related choices. Potentially
influential aspects of the parking environment which could be further explored in
PARKIT, include:
• representing a spectrum of levels of network familiarity rather than simply dividing the
population into those who are “unfamiliar” and those who are “familiar” – similarly it
would be interesting to explore the effect of different characterisations of the knowledge
possessed by unfamiliar drivers;
• allowing subjects to get lost in the network. This could perhaps be achieved by having a
more complex network, less meaningful street names, no compass, and no detailed map but
the exercise would then really becomes a route choice experiment for which VLADIMIR
might be better suited than PARKIT;
• further investigation of the effect of the accuracy of PGI information on drivers’ response
• investigating the influence of supply variables (network layout, parking stock, congestion
patterns, etc) on the specification and generalisability of the resulting models.
Aspects of PARKIT which would benefit from further research include:
• testing the sensitivity of the results to the multipliers used to represent the passage of time
while engaged in different elements of a journey (the values of in-vehicle time and walking
time derived from the coefficients of our models suggests that the representation of
walking used in our PARKIT work was not inappropriate but a question remains as to
whether the result was due to the higher fraction of real time or to the deliberately tedious
nature of the screens displayed during the walk phase of a journey);
• exploring different ways of expressing the risk of having to queue at car parks; and
• testing the effect of requiring simulator subjects to part with real money when “paying” a
parking charge.
Acknowledgements
We are pleased to have this opportunity to acknowledge the financial support of the UK
Engineering and Physical Sciences Research Council for the development of PARKIT and to
thank colleagues in Leeds, London and Southampton for their contribution to discussions
during the development of PARKIT, to the conduct of the surveys and to the initial analysis of
the dialogues. Particular thanks in these respects are due to Peter Balmforth (who
programmed the PARKIT software), and to Mario Alves, Kiron Chatterjee, Paul Firmin, John
Appendix 1: Definition of variables used in models
Parameter Long Name Description
Drive Drive time Minimum drive time to a car park via this exit (in minutes)
Vis-wait Visible queue Extent of queuing outside a car park that could be seen by the driver (translated, via the queue dissipation rate, into minutes of queuing)
Price Price of Parking The price in pence to park at a car park - for the duration of stay specified in the pre-trip briefing information
Walk Walk time The time required to walk (at a 5 kph) from a car park to the final destination (in minutes)
Full PGI sign says FULL Dummy variable for a car park, set if the driver has passed a PGI sign saying that the car park is “FULL”
#Spaces Number of spaces The number of parking spaces available at a car park as displayed on the most recent PGI sign passed by the driver
#Spaces2 No. of spaces squared The square of #Spaces (#Spaces2 is used in conjunction with #spaces to explore non-linearities in the influence of the number of spaces, e.g. a positive coefficient on #spaces combined with a negative coefficient on
#spaces2 would suggest a positive but decreasing function) ExpDel Prob of expected wait
of 5 minutes
The probability of having to wait more than 5 minutes at a car park. (“prior information” given on the pre-trip information sheet)
ExpDel0 ExpDel5 ExpDel10 ExpDel20 ExpDel50
chance of waiting more than 5 minutes is X% (X = 0, 5, 10, 20 or 50)
Dummy variables for a car park, set when the probability of having to wait more than 5 minutes is X (“prior information” given on the pre-trip information sheet)
ExpDelLE5 chance of waiting more than 5 minutes is no more than 5%
Dummy variable for a car park, set when there is no more than a 5% probability that the wait to enter the car park will exceed 5 minutes (“prior information” given on the pre-trip information sheet)
InExpPWT Initial expectation of probable wait time
Subject’s initial expectation of the probable wait time at the car park (from dialogue questions)
Passed Car Park has been passed
Dummy variable for a car park, set if driver has already passed the car park on the current journey.
Intended Intended car park Dummy variable for a car park, set if the driver indicated, prior to the journey, that this was the car park he was heading for
LastCP Last car park used Dummy variable for a car park, set if it was used by the driver in his/her immediately previous journey
Shop Shopping trip Dummy variable for trip context, set to 1 if the trip is a shopping trip, otherwise zero.
Park Whether the exit leads to a car park
Dummy variable for an exit, set to 1 if it leads directly into a car park, otherwise set to zero
ThetaE Log sum for an exit Scale parameter for the log of the sum of the utilities for car parks assigned to an exit at a decision point.
Theta1 Log sum for High St Scale parameter for the log of the sum of the utilities for the High St car parks
Theta2 Log sum for City Centre
Scale parameter for the log of the sum of the utilities for the city centre car parks
Theta3 Log sum for parking Scale parameter for the log sum of the utilities for any visible car parks at a decision point
Allen, PA (1993). Driver response to parking guidance and information systems, Traffic
Engineering and Control, 34(6), pp. 302-307
Axhausen, KW, Polak, JW, Boltze, M and Puzicha, J (1994). Effectiveness of the parking
guidance system in Frankfurt/ Main, Traffic Engineering and Control, 35(5).
Bonsall, PW (1993). Research methods for the study of driver response to in-vehicle and
roadside guidance methods. Selected Proceedings, World Conference on Transport
Research, Lyon, France, Volume IV, pp. 2519-2530.
Bonsall, PW (2000). Modelling information systems and other ITS innovations. In Hensher
DA and Button KJ (eds) Handbook of Transport Modelling, Pergamon Press.
Bonsall, PW (2002). Motivating the respondent- how far should we go? Paper presented at
Conference of the International Association for Travel Behaviour Research, University of
Texas, Sept 1997, and subsequently published in Mahmassani HS (ed) In Perpetual
Motion; Travel Behavior Research Opportunities and Application Challenges,
Pergamon Press.
Bonsall, PW (2003). Route Choice Simulators. In Schreckenberg M and Selten R (eds)
Human Behaviour in Traffic Networks, Springer Verlag, forthcoming.
Bonsall, PW, Clarke, R, Firmin, PE and Palmer, IA (1994). VLADIMIR and TRAVSIM -
powerful aids for route choice research, Proc PTRC 22nd European Transport Forum,
Seminar H, pp. 65-76.
Bonsall, PW, Firmin, PE, Anderson, M, Palmer, IA, and Balmforth, P (1997). Validating
VLADIMIR: Can the results of a route choice simulator be trusted?, Transportation
Research C 5(6).
Bonsall, PW and Merrall AC (1997). Analysing and modelling the influence of roadside
variable message signs on driver route choice. In Hensher DA, King J and Oum T (eds)
Selected Proceedings of 7th World Conference on Transport Research. Vol 1, pp.
11-26, Pergamon.
Bonsall, PW and Palmer, IA (2000). Route choice in response to variable message signs;
factors affecting compliance. In Emmerink R and Nijkamp P (eds) Behavioural and
Network Impacts of Driver Information Systems, Ashgate.
Firmin, P.E. (1999), Interactive computer-based interviewing using an artificial world for
capturing real-world car parking behaviour, paper presented at Association for Survey
Computing Conference, Imperial College London, January 1999.
Jones, PM, Storey, H and Valleeley, M (1994), Understanding traveller reactions to ATT
(advanced transport telematics) through Insight, Proceedings of International
Symposium on Advanced Transport Applications, Aachen Oct-Nov 94, ISATA,
Croydon.
Koutsopoulos, HN, Polydoropoulou, A and Ben-Akiva M (1995). Travel Simulators for data
collection on driver behaviour in the presence of information, Transportation Research C
3(3),pp. 143-159.
Kurauchi, F, Iida, Y, Yoshiya, Y and Kato, M (1996). Experimental analysis on driver
response to Parking Guidance and Information Systems, Paper presented at the First
Congress of Hong Kong Societies for Transportation Studies.
Lai, F (1997), Parking guidance and information systems: performance of thresholds for
switching variable message signs, MSc(Eng) Dissertation, Institute for Transport Studies,
University of Leeds.
Leichter, K and Schober, W (1985). SIMNET: Handbook, Technische Universitat Berlin,
May, AD and Turvey, I (1984) The effects of wheel-clamps in central London; results of a
before and after study, ITS Working Paper 194, Institute for Transport Studies, University
of Leeds.
Muramachi, Y, Harata, N and Yoshida, A (1992). The simulation method of city centre
parking policies related to shoppers' trips, Papers presented to the 6th World Conference on
Transport Research, Lyon.
Polak, JW and Axhausen, KW (1993). Requirements and possibilities for including the
effects of parking in a strategic transport model for London, Report to the UK Dept of
Transport, TSU, University of Oxford.
Polak, JW, Axhausen, KW, Jones, PM, Cook, A and Wofinden, D (1993). Modelling parking
search behaviour in Central & Inner London: Final Report to the UK Dept of Transport,
TSU, University of Oxford.
Polak, JW, Hilton, IC, Axhausen, KW and Young, W (1990). Parking Guidance and
Information Systems: performance and control, Traffic Engineering and Control, 31(10),
pp. 519-524.
Polak, JW and Vythoulkas, PC (1993). An assessment of the state of the art in the modelling
of parking behaviour, Report to the Transport Research Laboratory.
Swanson J, Ampt E and Jones P (1997). Measuring bus passenger preferences, Traffic
Engineering and Control, 38(6) pp. 330-336.
Thompson, RG, (1998). Analysis of PARKIT dialogues, ITS Technical note, Institute for
Transport Studies, University of Leeds.
Thompson, RG, and Bonsall, PW (1997). Drivers’ response to parking guidance and
Waterson, BJ, Hounsell, NB and Chatterjee K (2001) Quantifying the potential savings in
travel time resulting from parking guidance systems - a simulation case study. Accepted
for publication in the Journal of the Operational Research Society.
Young, W, and Taylor, MAP (1991). A parking modal hierarchy, Transportation, 18(1), pp.
37-58.
Young, W, Thompson, RG, and Taylor, MAP (1991). A review of urban parking models,
List of Figures:
Figure 1: Various PARKIT screens showing driver’s-eye view of progress of journey Figure 2: Pre-trip Briefing Sheets
List of Tables:
Table 1: Summary of Experimental Design
Table 2: Tabulation of behaviours apparent in the PARKIT data
Table 3: Model of the initial choice of car park, prior to beginning journey Table 4: Models of revised choice – after pre-trip PGI
Table 5: Exit Choice Models for En-route Decisions Table 6: Stopping Model for Unfamiliar Drivers
Table 7: Regression Models of Expected Wait Times (mins)
Figure 1: Various PARKIT screens showing driver’s-eye view of progress of journey (black and white versions of colour originals)
1a: driving along a link 1b: approaching a PGI sign junction
1c: arriving at a car park 1d: searching for a space inside a car park
Figure 2 Pre-trip Briefing Sheets (reduced from A4 sized originals).
Figure 2a:.representing minimal prior knowledge
CAR PARK NAME Risk of having to wait more than 5 minutes
PARKING FEE (£)
Station Road Nil 0% 1-00
Town Centre ? ? ?
Figure 2b:.representing substantial prior knowledge
CAR PARK NAME Risk of having to wait more than 5 minutes
PARKING FEE (£)
Church St 1 in 5 20% 2-50
Main St 1 in 10 10% 5-00
High St West 1 in 10 10% 2-50
[image:48.842.96.522.97.472.2]