1
Influence of Sketch Types on Distributed Design Team Work
Schembri M.
1, Farrugia P.
1, Wodehouse A.
2, Grierson H.
2and Kovacevic
A.
31Concurrent Engineering Research Unit, Department of Industrial & Manufacturing
Engineering, University of Malta, Msida, Malta
2Department of Design, Manufacture & Engineering Management, University of
Strathclyde, Glasgow, United Kingdom
3School of Mathematics, Computer Science and Engineering, City University London,
London, United Kingdom
Corresponding author: Philip Farrugia
Room 006, Faculty of Engineering Building, University of Malta, Msida MSD2080, Malta
Tel: +356 23402045 Fax: +35621343577 e-mail: [email protected]
2
Influence of Sketch Types on Distributed Design Team Work
Product development is a collaborative activity more often than ever carried out by distributed design teams. It is critical to determine how sketches are used in such environments in order to improve the design process. Sketches produced by students participating in a collaborative design project of three European Universities are classified according to the intention of the designer when producing a sketch, the level of detail shown in the sketch and the phase when the sketch was produced. The adapted classification system used in this paper helps to analyse type of sketches with most variety of ideas. Furthermore, this paper reviews which type of sketches offer the most potential to be further developed. Results show that persuasive sketches offer the broadest range of ideas since they are produced as a combination of ideas from brainstorming sessions. Shared sketches help to achieve consensus in decision making since the sketches are most likely to be produced by the entire group rather than individually.
Keywords: design collaboration; communication tools; sketch taxonomy; engineering design process
1. Introduction
Industrial designers often collaborate to work with other designers living in different countries (Chandrasegaran et al. 2014). Daily et al. (2000) describe how industrial designers working in distributive environments benefit from cost savings and a reduction in the time to market a product. Communication is often challenged in geographically distributed working environments. Although a significant proportion of design team communication is facilitated by face-to-face dialogue and text based communication systems such as email, designers also use drawings and sketches to communicate ideas and information (Bellamy et al. 2005). This paper aims to identify how sketches can be used in distributed design environments to improve the design process.
3
2. Background
2.1 The importance of sketches in the design process
Engineers are often criticized of not being able to think without sketching out rough ideas (Ullman, Wood, and Craig 1990). Thomas E. French declared that ‘freehand sketching is the mode of expression...It is the chief engineer’s method of design’ (Ferguson 1994). Sketches are preliminary, rough designs (Pei, Campbell, and Evans 2011) produced to externalize the mental images of the designer to solve design problems (van der Lugt 2005). Miller (1956) (as cited in Purcell and Gero (1998)) had indicated that the capacity of the short term memory was limited to seven pieces of information. Sketches are the ‘medium of thought’ (Hewitt 1985). They relieve the limited capacity working memory (both long-term and short-term) of the designer (Tversky and Masaki 2009; Craft and Cairns 2009). Thus, the mental capacity of the designer can be used for other mental activities such as generating ideas (Craft and Cairns 2009).
One of the important roles of sketching is that due to its iterative, cyclical and dialectic properties, particular features represented in the sketch tend to inspire the designer and thus enable ideas to be refined and revised to generate more concepts (Suwa, Gero, and Purcell 1992). This cycle of sketching, examining and interpreting is continued until the designer is satisfied with the design (Suwa, Gero, and Purcell 1992; Fish and Scrivener 2014).
2.2 Sketches as an aid to collaboration
Engineers often collaborate in order to achieve results that may be difficult to achieve individually (Vreede and Briggs 2005). Participating designers often come from different educational backgrounds having specialised in different areas and having different approaches to the design work. This can be a source of disharmony and conflict within a group but design representations can enhance collaboration and communication in a team as they overcome the barriers of common language (Pei, Campbell, and Evans 2010). Sketching encourages communication between team participants (Chandrasegaran et al. 2014). By communicating well, the participants can share their ideas (M. L. Maher, Simoff, and Cicognani 1998) and arrive at a common goal (Gül and Maher 2009).
4 However, this shared understanding that sketches promote requires the participating designers to be willing to share their mental models. Furthermore, all participating designers should be able to see the sketches and manipulate them (Eris, Martelaro, and Badke-Schaub 2014). Therefore sketches can act as a means of communication only when they are accessible to all participating designers.
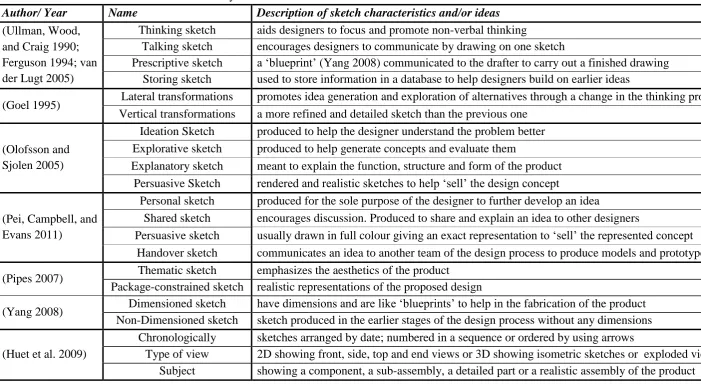
2.3 Classification systems based on the type, level and phase of sketches
Table 1 gives an overview of the different classification systems found in the literature to describe the type of sketches. The classification system presented by Ullman, Wood, and Craig (1990), Ferguson (1994) and van der Lugt (2005) indicate how sketches are used by the designer in the design process. Ullman, Wood, and Craig (1990) presented sketches as a means of storing ideas while Ferguson (1994) showed how sketches are used in the earlier stages of the design process as thinking, talking and prescriptive. Van der Lugt (2005) combined and improved the work carried out on these classification systems.
Goel (1995) uses a more cognitive approach to classify sketches. This classification system organizes sketches according to the type of operation involved between successive sketches, i.e. whether the designer developed a particular idea (vertical transformation) or expressed a different conceptual idea (horizontal transformation).
Both Olofsson and Sjolen (2005) and Pei, Campbell, and Evans (2011) identified ways in which sketches can be classified according to the need or intention of the designer while sketching. The classification system presented by Olofsson and Sjolen (2005) puts more emphasis on the initial stage of the design process where the designer needs to understand the problem statement and start to generate concepts. The classification system of Pei, Campbell, and Evans (2011) focuses on the final stage of the design process and involves the production of models/prototypes and manufacturing of the designed product.
5 Table 1. A list of the different classification systems found in literature
Author/ Year Name Description of sketch characteristics and/or ideas
(Ullman, Wood, and Craig 1990; Ferguson 1994; van der Lugt 2005)
Thinking sketch aids designers to focus and promote non-verbal thinking
Talking sketch encourages designers to communicate by drawing on one sketch
Prescriptive sketch a ‘blueprint’ (Yang 2008) communicated to the drafter to carry out a finished drawing Storing sketch used to store information in a database to help designers build on earlier ideas
(Goel 1995) Lateral transformations promotes idea generation and exploration of alternatives through a change in the thinking process Vertical transformations a more refined and detailed sketch than the previous one
(Olofsson and Sjolen 2005)
Ideation Sketch produced to help the designer understand the problem better Explorative sketch produced to help generate concepts and evaluate them
Explanatory sketch meant to explain the function, structure and form of the product Persuasive Sketch rendered and realistic sketches to help ‘sell’ the design concept (Pei, Campbell, and
Evans 2011)
Personal sketch produced for the sole purpose of the designer to further develop an idea
Shared sketch encourages discussion. Produced to share and explain an idea to other designers
Persuasive sketch usually drawn in full colour giving an exact representation to ‘sell’ the represented concept Handover sketch communicates an idea to another team of the design process to produce models and prototypes. (Pipes 2007) Thematic sketch emphasizes the aesthetics of the product
Package-constrained sketch realistic representations of the proposed design
(Yang 2008) Dimensioned sketch have dimensions and are like ‘blueprints’ to help in the fabrication of the product Non-Dimensioned sketch sketch produced in the earlier stages of the design process without any dimensions (Huet et al. 2009)
Chronologically sketches arranged by date; numbered in a sequence or ordered by using arrows
6 Mcgown et al. (1998) and Rodgers et al. (2000) present a different classification system based on how an idea is represented in the sketch rather than how the sketch is used. They refer to features such as the use of annotations, colour and shading to describe the complexity of the sketch (Table 2).
Table 2. Classification system based on the level of complexity of sketch content (Mcgown et al. 1998; Rodgers et al. 2000)
Level Description
Level 1 monochrome line drawing without annotations or shading
Level 2 monochrome sketch with motion arrows and/or annotations or shading Level 3 monochrome sketch with annotations and shading
Level 4 Level 3 sketch with extensive use of shading and colour Level 5 a realistic Level 4 sketch that uses digital software
Pugh (1991) sub-divides the tasks that have to be carried out in a design process into distinct phases as shown in Table 3. Although Pugh (1991) did not define this classification system exclusively for sketches, it is another means how sketches can be categorized.
Table 3. Classification system based on the phase when the sketch is produced (Pugh 1991)
Phase Description
Phase 1 Problem definition - understanding the needs of the customer Phase 2 Concept Generation – brainstorming to help generate ideas Phase 3 Concept Evaluation, Selection and Development
Phase 4 Prototyping and detailed development – production of CAD drawings Phase 5 Finalization of the design.
7 for personal use to help in non-verbal thinking, not all shared sketches are produced to aid verbal communication. Talking sketches suggest that the designers use such sketches to discuss a particular aspect of the design. However, some idea generation techniques such as the 6-3-5 method in which six designers generate three ideas which are passed around every five minutes, and the C-sketch method in which sketches are passed to the next designer to modify, add or delete aspects of the sketch in an agreed length of time, do not incorporate time for discussion (Kulkarni et al. 2001). Sketches generated by using these techniques would then be classified as ‘thinking’ sketches when using the taxonomy presented by Ferguson (1994). The following section presents related work and highlights two research questions which are addressed by classifying the sketches.
3 Related work and research questions
In the study carried out by Sachse, Ro, and Schu (2003), it was concluded that students who were supported by sketching while designing, produced design solutions that were of a higher quality than those who were only partly supported by sketches or who were required to solve the problem mentally. Goldschmidt (2014) has shown that designing can still take place without sketching especially if the designer is blessed with a vivid imagination. While imagination is limited to only one image at a time, sketching allows the designer to visualise a number of representations at once and thus the designer would be able to combine or compare these representations. Although literature describes how sketching enhances creativity (G. Goldschmidt 1991; van der Lugt 2005) and presents the type of sketches that enhance creativity (Wodehouse et al. 2013), it does not address the type of sketches which reflect the creativity of the designer best. The first research question addressed in this paper therefore aims to determine and assess such sketches.
Leman Figen Gül and Maher (2006) while analysing different design teams working together established a classification system for design collaboration. This classification system describes collaborative design as being either ‘Mutual’ whereby all the participants work well together; ‘Exclusive’ where the team members work on different parts of the problem while occasionally consulting with each other or ‘Dictator’ where there is just one leader superior over the other team members. Based on this study, Leman Figen Gül and Maher (2006) concluded that exclusive collaboration is the best type of collaboration as the students working in this mode in this study produced the best results based on shared agreement. A collaborative project can be successful if there is good communication between the designers (Maier, Eckert, and Clarkson 2005). Although, Heiser, Tversky, and Silverman (2004) suggest that sketches facilitate the communication of ideas and thus promote collaboration, they do not address the type of sketches that are mostly involved in promoting collaboration. The second research question addressed in this paper is therefore concerned with what type of sketches help the designers to achieve consensus on the product to be developed.
8 Which type of sketches best reflects the creativity of the designer in a distributed
design context?
Literature describes ‘thinking’ sketches as enhancing the idea generation process. Does this imply that the designer exhibits his/her creativity through ‘thinking’ sketches or shared sketches?
How do the different types of sketches help the designers to achieve consensus?
Literature shows that ‘talking’ sketches help engage and achieve consensus within a team. However, is there a relationship between the type of sketch produced and consensus between participating members of a team?
4 Research methodology
The research study presented in this paper was conducted following a Global Design Project. Students participating in this project were introduced to tools and best practices which are required to collaborate in a distributed environment. This class aims at providing students with the skills and competence necessary to communicate, share and store information in an industrial collaborative environment and solve real-life design problems. Although the Global Design Project has been conducted for a number of years, the data collected and analysed in this paper is only based on one particular year, session 2014-2015, as data obtained from past projects was not sufficiently detailed to address the research questions discussed in this paper.
4.1 Participants and design brief
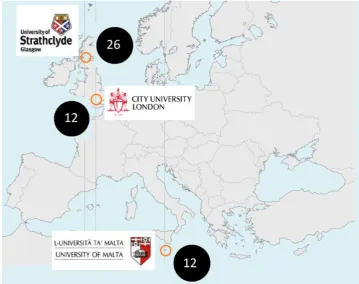
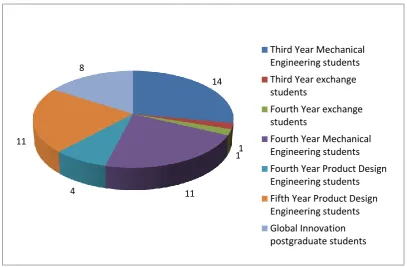
In this multidisciplinary design project, five teams were given the task to design a more effective aeroplane tray table. Although an effort was made to have the same number of students from each institution in each group, this was not always possible. The teams comprised of two to three Mechanical Engineering Students from City University London, two to three Mechanical Engineering Students from the University of Malta and four to six Product Design Engineering/ Global Innovation students from the University of Strathclyde, Glasgow (Figure 1).
10 The students collaborated both synchronously and asynchronously for eight weeks in order to develop designs for an aeroplane tray table that would make it easier to eat a meal at the table while at the same time increasing the functionality
14
1 1
11 4
11
8
Third Year Mechanical Engineering students Third Year exchange students
Fourth Year exchange students
[image:10.595.84.492.133.400.2]Fourth Year Mechanical Engineering students Fourth Year Product Design Engineering students Fifth Year Product Design Engineering students Global Innovation postgraduate students
11 for example improving the role of electronics in the table. All the students were encouraged to participate in the conceptual design stage by generating sketches. However, the teams were allowed to decide amongst themselves whether the sketches and design concepts should be generated among the co-located team members and then shared with the other team members or if this should be carried out among all the team members directly. The design of the aeroplane tray table involved not only sketches but also a detailed CAD model and a prototype of the final design.
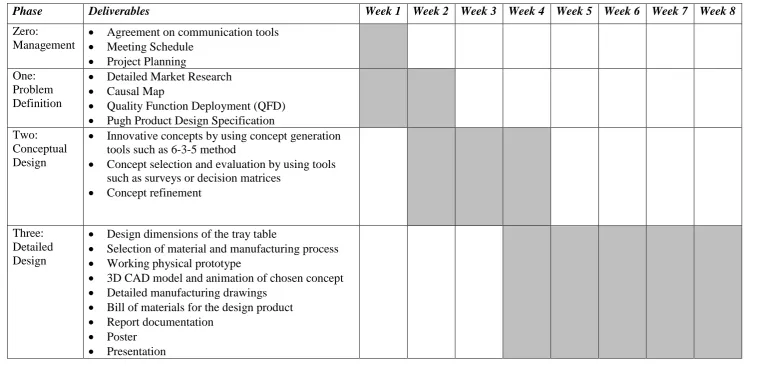
The teams were required to plan and manage their work by making use of a Gantt Chart highlighting the finishing target date for the different activities (Table 4). Each team was also encouraged to include additional information which is considered beneficial in managing their work such as the team members responsible for particular activities. The students had scheduled weekly meetings to conduct the design work and to discuss any difficulties with their respective tutor. The students were also encouraged to interact with their team members by organizing additional meetings to ensure that all tasks are completed.
The teams were asked to keep record of the outcomes using digital technology, e.g. cameras, video conferencing tools, etc. All project outcomes were suggested to be stored on a cloud storage folder that would be shared and accessible to all team members. Although how sketches are to be shared among the geographically distributed team members was not specified, all teams opted to make a virtual copy of the sketches and then save them in the cloud storage folder to allow easy access to each team member.
4.2 Data collection methods
At the end of the project, the students had to present their work in project reviews in order to describe a design process they used. At the outset of the exercise the students were provided with templates to maintain weekly logs of both synchronous and asynchronous communication. They were also asked to keep a record of all the shared documents and of all the sketches generated throughout the Global Design Project to help the students review and monitor their activities to achieve the best possible results. In this way, all the documents and sketches generated could be evaluated more easily.
The generated shared documents and sketches were also important in the marking assessment of the students. The participating students were assessed on the final design quality. This was based on the design method and design solution implemented and on the written report presented at the end of the project. Furthermore, equal importance was given to the design tools used in the project and on the team communication, planning and management.
12 Table 4. Gantt Chart showing the breakdown of the tasks that were required to be carried out.
Phase Deliverables Week 1 Week 2 Week 3 Week 4 Week 5 Week 6 Week 7 Week 8
Zero: Management
Agreement on communication tools Meeting Schedule
Project Planning One:
Problem Definition
Detailed Market Research Causal Map
Quality Function Deployment (QFD) Pugh Product Design Specification Two:
Conceptual Design
Innovative concepts by using concept generation tools such as 6-3-5 method
Concept selection and evaluation by using tools such as surveys or decision matrices
Concept refinement
Three: Detailed Design
Design dimensions of the tray table
Selection of material and manufacturing process Working physical prototype
3D CAD model and animation of chosen concept Detailed manufacturing drawings
Bill of materials for the design product Report documentation
13 useful they were deemed to be to help them arrive at the final designed product. The questionnaire was made up of six scaled questions. The students were allowed to add any further comments/reasons to each answer. The questionnaires were distributed to the fifty participating students using the traditional paper and pen method. Forty-six of these questionnaires were received and evaluated.
4.3 Method of evaluation
4.3.1 Classification of sketches
By classifying sketches, observations can be made on the sketching process in collaborative environments that might help the designers to improve the design process and thus produce better design solutions. This work adopts three classification systems based on the existing literature:
1. The first based on the phase in which the sketch has been produced (Pugh 1991); 2. The second based on the categorization scheme of Mcgown et al. (1998) and
Rodgers et al. (2000) that define the level of complexity of a sketch. It should be noted that some modifications to this classification scheme was necessary in order to encompass all the sketches generated (Table 2). This modification allowed sketches with motion arrows but without annotations to be considered as Level 2 sketches as often such sketches are less ambiguous; and,
3. The third classification system used is based on that identified by Pei, Campbell, and Evans (2011) to describe the intention of the designer. This classification system was used since as indicated van der Lugt (2005), a single sketch may serve multiple functions and thus it would be difficult to know how the sketch was used, e.g. to aid thinking or to aid in communication. However, the intention of the designer is more evident from the phase in which the sketch was created as well as from the level of detail. By recalling the phase when the sketch was produced, designers can recall the reason why it was produced.
14 6-3-5 method and is therefore a shared sketch. The use of motion arrows help the other designers to understand the concept suggested by the designer and is therefore classified as a Level 2 sketch. Sketch 3 in Figure 3 was used in the detailed design stage (Phase 3). The high level of complexity (Level 4) represented by the use of colour, shading, annotations and motion arrows, collectively indicates that the designer tries to ‘sell’ the idea. For this reason it is classified as a persuasive sketch.
4.3.2 Analysis of the questionnaire
A questionnaire was used to evaluate the students’ assessment on the use of sketches and how useful they were considered to be during the design process. Graphs were used to present the data. Each question was analysed separately while column graphs were generated to represent the opinion of each group. The mean rating and standard deviation of each scale item was calculated for each question.
In order to calculate the internal consistency of the team members within a particular group, the Cronbach’s alpha reliability test was used. The Cronbach’s alpha test has an upper bound of one but is unbounded from below (George and Mallery 2008). Internal consistency is generally assessed according to Table 5.
[image:14.595.83.525.179.415.2]
Figure 3. Examples of classified sketches. Sketch 1
Level 1 Personal Sketch
Level 2 Shared Sketch
Level 4 Persuasive Sketch
15 Table 5. Commonly accepted rule for describing the internal consistency of the
Cronbach’s alpha (George and Mallery 2008)
Cronbach’s Alpha Internal Consistency
0.9 – 1.0 Excellent
0.8 – 0.9 Good
0.7 – 0.8 Acceptable
0.6 – 0.7 Questionable
0.5 – 0.6 Weak
Less than 0.5 Unacceptable
5 Results
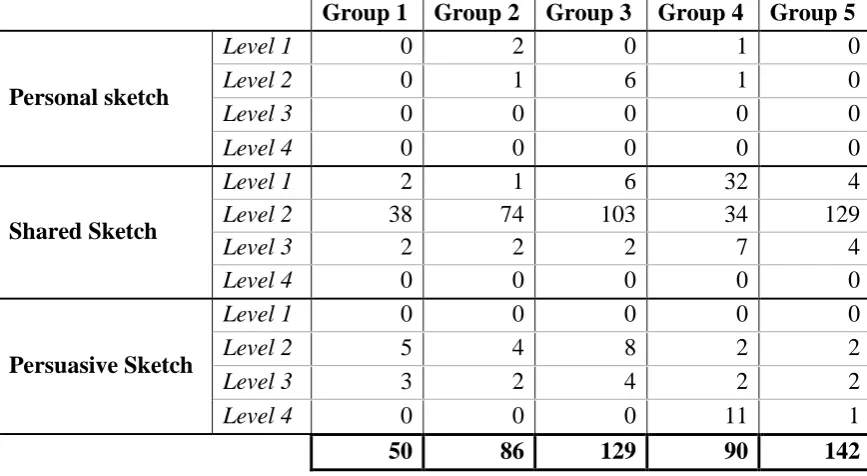
Quantitative data collected from the classification of sketches of the five participating groups is summarized in Table 6. The sum of all the sketches produced by each group is recorded in the last row of Table 6. It should be noted that no sketches were classified as ‘handover sketches’ or Level 5 sketches as the project used in this study did not require the participants to reach the final stage in the design process.
Table 6. Results obtained after classifying the sketches produced by the students
Group 1 Group 2 Group 3 Group 4 Group 5
Personal sketch
Level 1 0 2 0 1 0
Level 2 0 1 6 1 0
Level 3 0 0 0 0 0
Level 4 0 0 0 0 0
Shared Sketch
Level 1 2 1 6 32 4
Level 2 38 74 103 34 129
Level 3 2 2 2 7 4
Level 4 0 0 0 0 0
Persuasive Sketch
Level 1 0 0 0 0 0
Level 2 5 4 8 2 2
Level 3 3 2 4 2 2
Level 4 0 0 0 11 1
[image:15.595.86.520.448.686.2]16 5.1 Persuasive sketches include the most distinct ideas
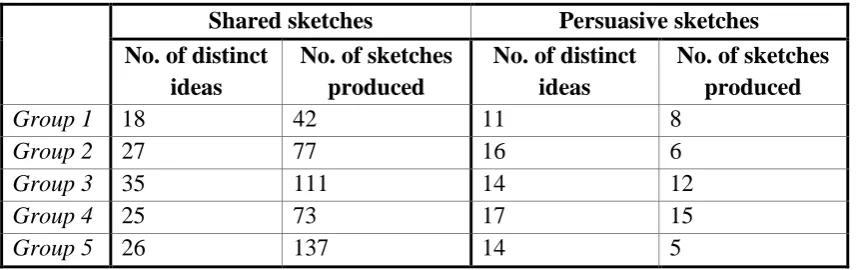
[image:16.595.85.514.386.521.2]The first research question focuses on the type of sketches that best reflect the creativity of the designer. Creativity in this context is defined as the ability to combine distinct ideas i.e. ideas which describe a particular function of the tray table or a different opening/closing mechanism of the tray table, into one sketch. Some examples of distinct ideas found in the sketches generated in the different groups include the tray table coming out from the arm rest of the passenger’s seat, a cup holder mechanism and a cushion to rest on during flight. To address this research question, a list of all the distinct ideas presented in the sketches was created and the number of the sketches associated with each distinct idea was noted. The number of distinct ideas presented in shared and persuasive sketches were then determined (Table 7). It should be noted that personal sketches were not included in the analysis to determine the type of sketches that best reflect the creativity of the designer and for this reason Table 7 does not include a reference to all the sketches generated. The number of personal sketches generated was too small to draw a proper conclusion from the results obtained. Furthermore, some of the personal sketches produced were too ambiguous to identify the idea they represent.
Table 7. Results showing the number of distinct ideas presented in shared and persuasive sketches and the number of shared and persuasive sketches produced
Shared sketches Persuasive sketches No. of distinct
ideas
No. of sketches produced
No. of distinct ideas
No. of sketches produced
Group 1 18 42 11 8
Group 2 27 77 16 6
Group 3 35 111 14 12
Group 4 25 73 17 15
Group 5 26 137 14 5
17 Figure 4. Graph showing the percentage of distinct ideas presented in shared and
persuasive sketches to the number of shared and persuasive sketches generated
5.2 Shared sketches help achieve team consensus
The second research question addressed in this paper focuses on what type of sketch helps the team to achieve consensus. From the analysis of the questionnaire it could be deduced that students participating in the Global Design Project found sketches very useful to improve the product outcome (Figure 5).
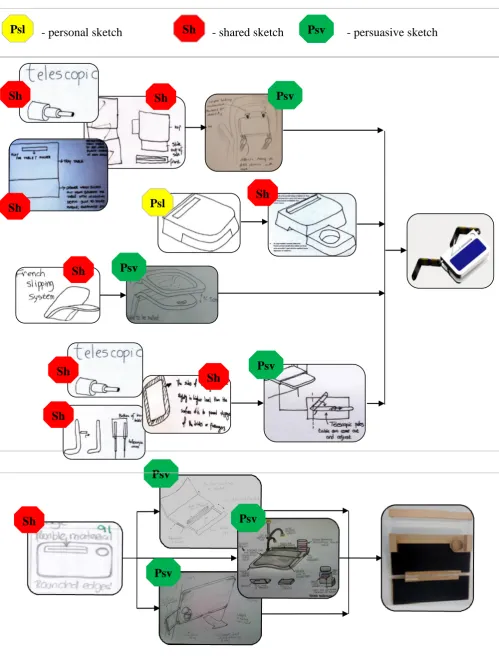
[image:17.595.105.492.478.707.2]18 In order to see any working patterns in the sketches produced, the logs of information presented by the students were used to order the sketches of each group according to how the sketches were developed from the conceptual stage to the production of the prototype. In the students’ logs of information, the date when a sketch was produced was not recorded. This resulted in some difficulty in knowing the exact phase of when a sketch was produced. Figure 6 shows an example of how conceptual sketches generated by Groups 2 and 5 during the 6-3-5 method and in individual brainstorming sessions were selected and developed until they reached the final stage of prototyping. As can be seen in Figure 6, while the sketches used for further development by Group 5 were all shared sketches, Group 2 used personal sketches as well in order to develop the concept to the prototyping stage.
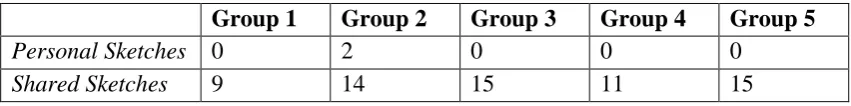
[image:18.595.85.511.417.470.2]Table 8 shows quantitative data of the type of Phase 2 sketches selected to be further developed to produce a prototype. It also indicates that the majority of the sketches selected to be further developed were shared sketches. Although Groups 2, 3 and 4 had produced personal sketches, only Group 2 selected a number of these concepts (two) to be further developed.
Table 8. Results of all the five groups showing patterns in Phase 2 sketches chosen for further development
Group 1 Group 2 Group 3 Group 4 Group 5
Personal Sketches 0 2 0 0 0
Shared Sketches 9 14 15 11 15
19 Figure 2. Sketches showing how a concept idea was developed until a prototype were created by Groups 2 and 5
Sh
Psv
Psv
Psv
- personal sketch - shared sketch - persuasive sketch
Psl Sh Psv
Sh
Psv
Sh
Sh Sh
Sh
Sh
Sh
Sh
Psv
20 5.3 Internal group reliability of questionnaires
[image:20.595.83.514.226.345.2]To identify how closely related the results of the team members within a particular group were, and thus verify the reliability of the results obtained from the questionnaires, the Cronbach’s alpha reliability test was carried out. Table 9 shows the Cronbach’s alpha results for all the five groups.
Table 9. Results of Cronbach’s alpha reliability test for each participating group
Group Number of participants who
answered the questionnaire Cronbach’s Alpha
1 10 0.868
2 8 0.682
3 9 0.873
4 10 0.863
5 9 0.827
Table 9 shows that the participants in all five groups with the exception of group 2 showed good consistency in answering the questionnaire. On the other hand the Cronbach’s alpha for group 2 lies in the questionable region. Therefore, the results obtained from groups 1, 3, 4 and 5 are more reliable than those of group 2.
6 Discussion
6.1 Persuasive sketches include the most distinct ideas
21 Figure 3. A persuasive sketch produced by Group 4 showing a number of distinct ideas grouped together in one sketch.
Shared sketches often include more distinct ideas than persuasive sketches (Table 7). Most shared sketches are produced in Phase 2 rather than in Phase 3 when the participating teams are still generating ideas. Shared sketches produced during Phase 2 may include wild ideas that may be difficult to implement however they can inspire the other participants and help the generation of new ideas. One shared sketch often illustrates just one distinct idea. This allows other participating designers to focus on that idea to improve and refine it making it more functional.
Persuasive sketches on the other hand are most often produced when the basic idea of the product has been chosen and the designer is developing an idea further so that it can meet all the necessary requirements and thus have commercial potential. During Phase 3 the designer often combines the distinct ideas presented in the group brainstorming sessions where shared sketches had been generated. The concepts which were not considered good enough to be further developed are discarded. This is the main reason for the drop in the number of distinct ideas shown in Table 7 between shared sketches and persuasive sketches.
One further reason for shared sketches to display a smaller percentage of distinct ideas in comparison to the percentage of persuasive sketches is that certain brainstorming sessions are time constrained. Thus the designers often generate only one idea per sketch. Persuasive sketches on the other hand are more likely to be generated at a more leisurely pace after the participating team members have carried out a discussion on the sketches generated during Phase 2. Designers then try to combine the strengths of the conceptual ideas which were considered to be good enough. These are further developed into one concept to offer the other designers a reason to ‘sell’ that idea.
22 requires imagination. Some ideas may conflict with one another if not carried out cautiously. The ability of the designer to recognize good ideas that can work together and consider different alternatives of making them work together ensures creativity. By producing a balance between the number of shared sketches and persuasive sketches produced, the designers can not only develop a particular idea until it has the potential to be implemented but also the designers can develop different ways in which a number of ideas can be combined. By doing so, it is ensured that all potential designs are considered. 6.2 Shared sketches help achieve team consensus
As shown by the results of the questionnaire (Figure 5), sketches were considered to be very useful by the majority of the participating students. Students commented that sketches were beneficial - ‘the basis for all good ideas’ and also ‘very good for communicating ideas and ensuring others understood the verbal descriptions’.
Despite claims that ‘talking’ sketches emphasize team engagement and consensus, little formal experimental evidence exists to prove that ‘talking’ sketches help the participants in a group arrive at an agreement. Through consensus, better decisions can be taken by all the group members. Furthermore, this encourages a better group relationship as all the participating members would have agreed on the conceptual idea that should be improved and promoted to the detail design stage.
Table 8 indicates that the majority of the conceptual ideas considered to be good enough to be further developed were shared sketches (sixty-four out of sixty-six). Some characteristics that indicate whether a sketch was produced to help communication of ideas to other participants include the use of annotations and the high level of clarity displayed by the sketch. As can be seen from the personal sketch used for further development by Group 2 (Figure 6), the lack of annotations makes a sketch ambiguous and difficult to understand. Although the literature describes how ambiguity can aid idea generation through interpretation (Goel 1995), it should be emphasized that some degree of clarity is necessary to ensure that the other participants can understand the idea behind the sketch. Imagination for idea generation can still be encouraged through the use of limited annotations that will help the designer to not only understand the basic idea of the sketch but allow room for interpretation. The need for clarity in distributed teams is particularly important as it would prevent the need for a thorough explanation to accompany a sketch. As indicated by students’ responses in the questionnaires, it is very difficult for designers to explain an idea or sketch through videoconferencing. This is primarily due to the poor internet connection across the three sites and the inability to see all participants well. Furthermore, it is difficult for a designer to hold a sketch to the camera and point at the correct features to help communicate an idea.
23 each other’s ideas to explore different possibilities how a particular function can be carried out. Furthermore, such sketches are often accompanied by a group discussion to evaluate the sketches and assess the strengths and weaknesses of each concept. For this reason, such sketches are often considered to belong to the whole group. Designers find it easier to select concepts produced by the group rather than by an individual so as to avoid any element of bias towards the sketches produced by a particular designer. 6.3 Difficulties experienced in distributed design
Literature explains how distributed design offers a number of challenges for the designers that need to be overcome to design a product successfully (Jones et al. 2011). Although using video conferencing tools helped to overcome some communication problems, it was still difficult for the students to convey their ideas without the use of sketches.
Although sketches helped to overcome the language barriers, however from the questionnaires it could be deduced that the shared sketches were often not clear enough. Due to the poor Internet connection, it was often difficult for the students to verbally explain the sketches to the other team members. Even the sketches that were shared using the cloud storage folder were sometimes too light to be understood completely by the other team members. Therefore while sketches can help to convey the mental image of the designer, being of too poor a quality can prevent the viewer from understanding the embodied meaning.
Another difficulty experienced by the distributed design team was that not all three institutions were familiar with the same CAD package to generate detailed design. While having students from different educational backgrounds collaborating together can help to achieve a more innovative design product, there can also be some difficulties related to the learning of new software and new design techniques in a very short period of time. This hinders the collaborative process of such a design project.
7 Conclusions and Future Work
In order to amend classification systems of sketches previously discussed in open literature, in this paper sketches are classified as personal, shared and persuasive. This research showed that persuasive sketches best reflect the creativity of the designer as they combine a number of ideas in one sketch. By providing a balance between shared sketches and persuasive sketches, the design team ensures that all possibilities in developing an idea and combining a number of potential concepts are exhausted.
24 less ambiguous and easier understood by all group members. As future directions in research and application of sketches it is recommended that:
1. Further clarification of the proposed classification of sketches is to be carried out by a group of researchers in order to minimize bias
2. Spreading the study over a longer period with more time dedicated to concept generation and development as this could help in more systematic analysis of the influence of sketching on the design team work
3. Distributed design teams are encouraged to use remote sketching collaboration tools, such as online whiteboards to sketch and share ideas with other team members.
Acknowledgements
The authors are grateful for all the studdents who participated in the survey. Special thanks go also to Prof. Liberato Camilleri for his contribution in the statistical analysis of the data.
8 References
Bellamy, Tom, Anthony Williams, Willy Sher, and Sue Sherratt. 2005. “Design Communication: Issues Confronting Both Co-Located and Virtual Teams.” In
Procs 21st Annual ARCOM Conference, 1:353–61. Association of Researchers in Construction Management (ARCOM).
Chandrasegaran, Senthil, Sriram Karthik Badam, Zhenpeng Zhao, Niklas Elmqvist, Lorraine Kisselburgh, and Karthik Ramani. 2014. “Collaborative Sketching with skWIKI: A Case Study.” In Proceedings of the ASME 2014 International Design Engineering Technical Conferences & Computers and Information in Engineering Conference, 1–10. Buffalo, New York, USA.
Craft, Brock, and Paul Cairns. 2009. “Sketching Sketching : Outlines of a Collaborative Design Method.” In BCS - HCI ’09 Proceedings of the 23rd British HCI Group Annual Conference on People and Computers: Celebrating People and
Technology, 65–72.
Daily, Mike, Mike Howard, Jason Jerald, Craig Lee, Kevin Martin, Doug Mcinnes, Pete Tinker, and Randall C Smith. 2000. “Distributed Design Review in Virtual
Environments.” Proceedings of the Third International Conference on Collaborative Virtual Environments, 57–63.
25 and Distributed Environments.” Design Studies 35 (6). Elsevier Ltd: 559–92. doi:10.1016/j.destud.2014.04.002.
Ferguson, Eugene S. 1994. Engineering and the Mind’s Eye. Cambridge, Mass: MIT Press Ltd.
Fish, Jonathan, and Stephen Scrivener. 2014. “Sketching and the Mind’s Visual Eye: Cognition” 23 (1): 117–26.
George, Darrenaul, and P Mallery. 2008. SPSS for Windows Step by Step: A Simple Guide and Reference 15.0 Update. 8th Editio. Pearson Allyn and Bacon. Goel, Vinod. 1995. Sketches of Thought. Massachusettes: MIT Press Ltd.
Goldschmidt, G. 1991. “The Dialectics of Sketching.” Creativity Research Journal 4 (2): 123–43.
Goldschmidt, Gabriela. 2014. “Modeling the Role of Sketching in Design Idea
Generation.” In An Anthology of Theoris and Models of Design, edited by Amaresh Chakrabarti and Lucienne T. M. Blessing, 433–50. London: Springer London. doi:10.1007/978-1-4471-6338-1.
Gül, L. F., and M. L. Maher. 2009. “Co-Creating External Design Representations: Comparing Face-to-Face Sketching to Designing in Virtual Environments.”
CoDesign 5 (2): 117–38. doi:10.1080/15710880902921422.
Heiser, Julie, Barbara Tversky, and M I A Silverman. 2004. “Sketches for and from Collaboration.” Visual and Spatial Reasoning in Design III, 69–78.
Hewitt, M. 1985. “Representational Forms and Modes of Conception; an Approach to the History of Architectural Drawing.” Journal of Architectural Education 39 (2): 2–9. http://www.tandfonline.com/doi/abs/10.1080/10464883.1985.10758387. Huet, Greg, Hamish McAlpine, Ricardo Camarero, Stepher j. Culley, Tatjana Leblance,
and Forting Clement. 2009. “The Management of Digital Sketches through PLM Solutions.” In Proceedings of ICED 09, the 17th International Conference on Engineering Design, 239–50.
Jones, Sara, Veselin Rakocevic, Meirion Williams, and Eli Atanasova. 2011. “Use of a Multi-Touch Surface to Support Distributed Design Meetings as Part of a Problem-Based Learning Approach to Teaching Design.” In International Conference on Engineering and Product Design Education, 696–700.
Kulkarni, Santosh, Joshua D Summers, Noe Vargas-hernandez, and Jami J Shah. 2001. “Evaluation of Collaborative Sketching ( C-Sketch ) as an Idea Generation
Technique for Engineering Design.” The Journal of Creative Behaviour 35 (3): 168–98.
Maher, Mary Lou, and L. F. Gül. 2006. “Studying Design Collaboration in
26
Graphics, Imaging and Visualisation: Techniques and Applications, CGIV’06, 471–77.
Maher, Mary L, Simeon J Simoff, and Anna Cicognani. 1998. “Observations from an Experimental Study of Computer-Mediated Collaborative Design,” 1–20.
Maier, a. M., C. M. Eckert, and P. J. Clarkson. 2005. “A Meta-Model for Communication in Engineering Design.” CoDesign 1 (4): 243–54. doi:10.1080/15710880500478353.
Mcgown, Alistair, Graham Green, Paul A Rodgers, Engineering Design Centre, and Trumpington Street. 1998. “Visible Ideas: Information Patterns of Conceptual Sketch Activity.” Design Studies 19 (4): 431–53.
Olofsson, Erik, and Klara Sjolen. 2005. Design Sketching. Second Edi. KEEOS Design books AB;
Pei, Eujin, Ian Campbell, and Mark Evans. 2011. “A Taxonomic Classification of Visual Design Representations Used by Industrial Designers and Engineering Designers.” The Design Journal 14 (1): 64–91.
Pei, Eujin, Ian R. Campbell, and Mark a. Evans. 2010. “Development of a Tool for Building Shared Representations among Industrial Designers and Engineering Designers.” CoDesign: International Journal of CoCreation in Design and the Arts 6 (3): 139–66. doi:10.1080/15710882.2010.510197.
Pipes, Alan. 2007. Drawing for Designers: Drawing Skills, Concept Sketches,
Computer Systems, Illustration, Tools and Materials, Presentations, Production Techniques. London: Laurence King Publishing.
Pugh, Stuart. 1991. Total Design. New Jersey: Pearson Education (US).
Purcell, A T, and J S Gero. 1998. “Drawings and the Design Process.” Design Studies
19 (4): 45–483.
Rodgers, P A, Colinton Road, G Green, and A Mcgown. 2000. “Using Concept Sketches to Track Design Progress.” Design Studies 21 (5): 451–64.
Sachse, Pierre, Winfried Hacker, and Sven Leinert. 2004. “External Thought—does Sketching Assist Problem Analysis?” Applied Cognitive Psychology 18 (4): 415– 25. doi:10.1002/acp.992.
Sachse, Pierre, Anne Ro, and Martina Schu. 2003. “Support Value of Sketching in the Design Process.” Research in Engineering Design 14 (2): 89–97.
doi:10.1007/s00163-002-0028-7.
27 Suwa, Masaki, John Gero, and Terry Purcell. 2000. “Unexpected Discoveries and
S-Invention of Design Requirements: Important Vehicles for a Design Process.”
Design Studies 21 (6): 539–67.
Suwa, Masaki, John S Gero, and Terry A Purcell. 1992. “The Roles of Sketches in Early Conceptual Design Processes.” In Proceedings of the Twentieth Annual Meeting of the Cognitive Science Society, 1043–48. Lawrence Erlbaum.
Tversky, Barbara. 1999. “What Do Sketches Say about Thinking ?” In Proceedings of AAAI Spring Symposium on Sketch Understanding, edited by T. Stahovic, J. Landay, and R. Davis.
Tversky, Barbara, and Suwa Masaki. 2009. “Thinking With Sketches,” 75–85.
Ullman, David G., Stephen Wood, and David Craig. 1990. “The Importance of Drawing in the Mechanical Design Process.” Computers & Graphics 14 (2): 263–74.
doi:10.1016/0097-8493(90)90037-X.
Van der Lugt, Remko. 2005. “How Sketching Can Affect the Idea Generation Process in Design Group Meetings.” Design Studies 26 (2): 101–22.
doi:10.1016/j.destud.2004.08.003.
Vreede, Gert-jan De, and Robert O Briggs. 2005. “Collaboration Engineering : Designing Repeatable Processes for High-Value Collaborative Tasks.” In
Proceedings of the 38th Annual Hawaii International Conference on System Sciences, 00:1–10.
Wodehouse, Andrew J, Philip J Farrugia, Hilary J Grierson, and C Borg. 2013. “A Training Strategy For Managing Distributed Conceptual Design Work.” In
Proceedings of the 19th International Conference on Engineering Design, edited by Udo Lindemann, Srinivasan V, Yong Se Kim, Sang Won Lee, John Clarkson, and Gaetano Cascini, 1–10.