ISSN 0252-8266
eurostat
EUROSTATISTIK
Daten zur Konjunkturanalyse
EUROSTATISTICS
Data for short-term economic analysis
EUROSTATISTIQUES
Données pour l'analyse de la conjoncture
m
eurosta
STATISTISCHES AMT DER EUROPAISCHEN GEMEINSCHAFTEN
STATISTICAL OFFICE OF THE EUROPEAN COMMUNITIES
OFFICE STATISTIQUE DES COMMUNAUTÉS EUROPÉENNES
L-2920 Luxembourg - Tél. 4 3 0 1 1 Télex : Comeur Lu 3 4 2 3
B-1049 Bruxelles, Bâtiment Berlaymont, Rue de la Loi 2 0 0 (Bureau de liaison)
Tél. 235 1 1 1 1
EUROSTATISTIK
Daten zur Konjunkturanalyse
EUROSTATISTICS
Data for short-term economic analysis
EUROSTATISTIQUES
Données pour l'analyse de la conjoncture
Luxembourg : Office des publications officielles des Communautés européennes, 1982
Kat./cat: CA-BK-82-011-3A-C
Inhaltswiedergabe nur mit Quellennachweis gestattet
Hinweis
Die Veröffentlichung
Eurostatistik — Daten zur Konjunkturanalyse
¡st
eine von drei Schlüsselveröffentlichungen des Eurostat, die dem Leser
einen Überblick über die wichtigsten quantitativen Daten geben sollen,
die für die Gemeinschaft und die Mitgliedstaaten zur Verfügung stehen.
Die anderen Veröffentlichungen in dieser Reihe sind
Statistische
Grundzahlen
mit Daten für ein bestimmtes Jahr sowie
Eurostat-Revue
mit einem Zehnjahresüberblick über die Gemeinschaft in Zahlen.
Eine monatliche Veröffentlichung mit laufenden Wirtschaftsdaten muß
ständig angepaßt und auf den neuesten Stand gebracht werden. Zu
Beginn des Jahres
7
982 wurde mit der Einbeziehung von Daten für
Griechenland und der Abwandlung der Aufmachung eine bedeutende
Änderung vorgenommen. Im Laufe des Jahres 1982 werden nach und
nach Gesamtzahlen für die 10 Mitgliedstaaten der Gemeinschaft
aufgenommen. Sobald genügend Daten zur Verfügung stehen, wird das
Basisjahr 19 75, das die Grundlage für diese Veröffentlichung bildet,
durch das Jahr 1980 ersetzt werden. Zu einem späteren Zeitpunkt ist
vorgesehen, Daten für die beiden beitrittswilligen Länder Portugal und
Spanien sowie für die Vereinigten Staaten und Japan hinzuzufügen.
Es werden vier Arten von Daten in
Eurostatistik
veröffentlicht. Auf den
Seiten 5 und 6 findet sich ein Artikel .Kurz notiert", der sich mit den
jüngsten Tendenzen bei den verfügbaren Daten befaßt. Die Seiten 15
bis 20 enthalten eine schematische Darstellung der wichtigsten
wirtschaftlichen Reihen für die Gemeinschaft und die Mitgliedstaaten.
Die Seite 23 ist die erste von 56 Seiten mit .Gemeinschaftstabellen".
Dieser Abschnitt enthält von Eurostat auf der Grundlage von
Gemeinschaftskriterien harmonisierte Daten. Die neuesten Daten sind
vorläufig und in einigen Fällen von Eurostat geschätzt. Schließlich
enthält die Veröffentlichung noch einen Abschnitt , Ländertabellen ", der
eine Auswahl der in jedem Land am häufigsten verwendeten
Konjunkturindikatoren enthält. Hierbei handelt es sich um nationale
Reihen auf der Grundlage nationaler Definitionen. Zu Vergleichszwecken
ist auch eine Tabelle für die Vereinigten Staaten enthalten.
In allen Fällen stehen auf Anfrage Zeitreihen über die Cronos-Datenbank
des Eurostat zur Verfügung. Es werden außerdem statistische Bulletins
über Arbeitslosigkeit, Preise, industrielle Produktion, Zahlungsbilanzen,
Außenhandel und Energie monatlich oder vierteljährlich veröffentlicht. In
Eurostatistik
selbst ist ein absolutes Minimum an Erläuterungen zur
Methodik enthalten. Ausführliche Informationen über Definitionen und
Methodik sind bei Eurostat erhältlich.
Eurostatistik
wird am Ende eines jeden Monats in einer gemeinsamen
Ausgabe für Deutsch, Englisch und Französisch veröffentlicht. Darüber
hinaus steht auf Anfrage eine Ergänzung mit Übersetzung der Titel und
der Erläuterungen ins Dänische, Griechische, Italienische und
Inhaltsverzeichnis
Zeichen und Abkürzungen
Seite
.Kurz notiert"
Schaubilder
GEMEINSCHAFTSTABELLEN
1 . Volkswirtschaftliche
Gesamtrechnungen
ESVG
Veränderung des Volumens
Veränderung der Preise
2. Beschäftigung
Bevölkerung
Beschäftigung
3. Arbeitslosigkeit
4. Indizes der industriellen Produktion
Industrie, Baugewerbe
Erzeugung nach Kategorien
Erzeugung nach Produktionsbereichen
Konjunkturempfindliche Bereiche
5. Meinungsumfrage in der Industrie (
1)
6. Produktionsstatistik
Industrieerzeugnisse
Landwirtschaftliche Erzeugnisse
7. Außenhandel
Hauptindikatoren
Handel mit Drittländern
Innergemeinschaftlicher Handel
Handel nach Ländern
8. Preise
Indizes der Verbraucherpreise
Indizes der Erzeugerpreise
Indizes der Löhne und Gehälter in der Industrie .
9. Finanzstatistik
Wechselkurse
Wichtigste Finanzstatistiken
1 0 . Zahlungsbilanz
Wichtigste Salden
LÄNDERTABELLEN
Belgique/België
Danmark
BR Deutschland
ΕΛΛΑΔΑ
France
Ireland
Italia
Luxembourg
Nederland
United Kingdom
United States
5
15
21
23
23
2 4
25
OK—
0
14
6
+
8
%,T4/T0
%,T12/T0
·/., SALDO
28
31
31
32
33
35
3 /
41
41
45
4 6
4 6
4 9
55
61
65
65
68
69
70
7 0
7?
74
/ 4
79
85
86
87
88
89
90
91
92
93
94
95
*
1975 = 100
EUR 9 = 100
EUR 10 = 100
MIO
MRD
Τ
TROEE
GWH
M3
DM
FF
UT HFL
BFR
LFR
UKL
IRL
DKR
USD
ECU
SZR
EG
Eurostat
EUR 9
EUR 10
UEBL/BLEU
ACP
ESVG
NACE
S ITC
Nichts
Weniger als die Hälfte der verwendeten Einheit
Kein Nachweis vorhanden
Von 1 bis 4
6 und 8
Prozent
Prozentualer Zuwachs eines Vierteljahres
gegenüber dem entsprechenden Vierteljahr des
Vorjahres
Prozentualer Zuwachs eines Monats gegenüber
dem entsprechenden Monat des Vorjahres
Saldo zwischen den positiven Antworten
(Zunahme. Verbesserung der Situation) und den
negativen Antworten (Abnahme,
Verschlechterung der Situation) der
Konjunkturbefragung bei den Unternehmern in
der Gemeinschaft
Saisonbereinigt (Ländertabellen)
Basisjahr
Prozentuale Angaben im Verhältnis zur
Gemeinschaft der 9 ( = 1 00)
Prozentuale Angaben im Verhältnis zur
Gemeinschaft der 1 0 ( = 1 00)
Million
Milliarde
Metrische Tonne
Tonne Rohöleinheiten
Gigawattstunde = 10
6kWh
Kubikmeter
Deutsche Mark
Französischer Franc
Italienische Lira
Holländischer Gulden
Belgischer Franc
Luxemburgischer Franc
Pfund Sterling
Irisches Pfund
Dänische Krone
USDollar
Europäische Währungseinheit
Sonderziehungsrechte
Europäische Gemeinschaft[en]
Statistisches Amt der Europäischen
Gemeinschaften
Gesamtheit der Mitgliedsländer der
Europäischen Gemeinschaften bis 1 9 8 0
Gesamtheit der Mitgliedsländer der
Europäischen Gemeinschaften ab 1 981
Belgischluxemburgische Wirtschaftsunion
Länder Afrikas, der Karibik und des Pazifiks —
Abkommen von Lome
Europäisches System Volkswirtschaftlicher
Gesamtrechnungen
Allgemeine Systematik der Wirtschaftszweige in
den Europäischen Gemeinschaften
Eurostatistik : Kurz notiert
1. Arbeitslosigkeit —
Arbeitslose
11,5 Millionen eingeschriebene
Ende Oktober 1982 sind 11,5 Millionen Arbeitslose bei den
Arbeitsämtern der Gemeinschaft der Neun registriert. Damit
steigt die Arbeitslosenquote gemessen an den zivilen
Erwerb-spersonen von 1 0 , 2 % Ende September auf 1 0 , 3 % Ende
Oktober 1982. Angesichts eines erneuten Anstiegs bei den
saisonbereinigten Werten wird deutlich, dass sich die Lage auf
dem Arbeitsmarkt in den Mitgliedstaaten im Oktober 1982
verschlimmert hat. Dies trifft auch für das Vereinigte Königreich
zu, in dem die absoluten Zahlen zwar um 1,4% abgenommen
haben, die saisonbereinigten Werte jedoch eine Zunahme
auf-weisen.
Die grössten Steigerungen bei den absoluten Zahlen
einge-schriebener Arbeitsloser gegenüber September 1982 finden
sich in Luxemburg ( + 1 6 , 4 % ) und in Dänemark ( + 1 0 , 5 % ) .
Ebenfalls über der durchschnittlichen Zunahme von 1,9% für
die Neunergemeinschaft liegen die BR Deutschland ( + 5,5%).
Frankreich ( + 3,7%), Irland ( + 3.0%) und die Niederlande
( + 2,2%). In Italien wird der Gemeinschaftsdurchschnitt in etwa
erreicht, während sich in Belgien gegenüber dem Vormonat
kaum eine Veränderung ergibt.
Die höchste Arbeitslosenquote in der Gemeinschaft der Neun
weist Ende Oktober 1 982 wie auch schon in den Vormonaten
Belgien (14,8%) auf, gefolgt von Irland (13,5%), dem
Ver-einigten Königreich (12,8%), den Niederlanden (11,1%) und
Italien (10,9%). Etwas unter dem Durchschnitt der
Gemein-schaft liegen Frankreich (9,6%) und Dänemark (9,4%). Die
niedrigste Arbeitslosenquoten finden sich nach wie vor in
Luxemburg (1,5%) und in der BR Deutschland (7,3%). Die
sich ständig verschlimmernde Situation auf dem Arbeitsmarkt
wird besonders bei einem Vergleich mit Oktober 1 981 deutlich.
Für die Neunergemeinschaft machte die Zunahme in diesem
Zeitraum 1 7,4% aus. Ein sehr starkes Anwachsen der
Arbeits-losigkeit findet sich im letzten Jahr vor allem in der BR
Deutsch-land ( + 40,6%), den NiederDeutsch-landen ( + 38,6%), Luxemburg
( + 33.9%) und Irland ( + 27,7%).
2. Verbraucherpreise im Oktober 1 9 8 2
Zwischen September und Oktober 1982 stiegen die
Ver-braucherpreise in der Europäischen Gemeinschaft um
durch-schnittlich 0,9%. Ein Preisanstieg unter dem allgemeinen
Durchschnitt war in der BR Deutschland und den Niederlanden
(jeweils 0,3%), in Frankreich und dem Vereinigten Königreich
(jeweils 0,5%) und in Belgien (0,8%) zu verzeichnen. In
Däne-mark und in Luxemburg lag der Preisanstieg mit 1 % bzw. 1 , 1 %
leicht über dem Durchschnitt, während des Anstieg in Italien
(2.0%) und Griechenland (2,4%) bedeutend höher ausfiel.
Die Steigerungsrate der letzten 1 2 Monate für EUR 1 0
insge-samt betrug 1 0 , 1 % , dies ist die niedrigste Steigerungsrate seit
Mitte 1 979. In den Niederlanden ( + 4,7%), in der BR
Deutsch-land ( + 4,9%) und im Vereinigten Königreich ( + 6,8%) waren
die niedrigsten Zuwächse zu verzeichnen. Steigerungsraten um
den Gemeinschaftsdurchschnitt werden aus Frankreich
( + 9,4%). Belgien ( + 9,8%), Dänemark ( + 1 0 , 3 % ) und
Luxemburg ( + 1 0 , 4 % ) gemeldet. Die höchsten Anstiegswerte
waren in Irland ( + 1 7 . 0 % ) , in Italien ( + 1 7 , 4 % ) und
Griechen-land ( + 20%) zu verzeichnen.
3. Index der industriellen produktion : Deutlicher Rückgang
seit Juni 1 9 8 2
Der Vorläufige Index der industriellen Produktion in der
Gemein-schaft lag im Juli bei 101.5 und im August 1982 bei 85,5
( 1 9 7 5 = 1 0 0 ) , was einem Rückgang von 3,1 bzw. 2 , 6 %
gegenüber den entsprechenden Monaten der Vorjahres
ent-spricht und somit die Tendenz zur Verschlechterung bestätigt,
die sich bereits im Juni mit einem Rückgang des Index um fast
2 % abgezeichnet hatte. Der durchschnittliche Rückgang des
Index für die drei Monate Juni bis August 1 982 (diese Monate
sind nur schwer einzeln zu bewerten aufgrund der Auswirkung
der Betriebsferien auf die Produktion) gegenüber dem gleichen
Zeitraum des Vorjahres beläuft sich auf 2.5%. Hieraus geht
deutlich hervor, dass sich die Hoffnungen auf einen
Auf-schwung, die sich auf die Festigkeit der Produktionsentwicklung
in den Monaten April und Mai 1 982 gegründet hatten, nicht
bestätigt haben.
Der saisonbereinigte Index der Produktion lag im Juli bei 11 2,5
und im August 1982 bei 1 12,0 (1975 = 100), im Vergleich zu
114,8 im Durchschnitt der ersten fünf Monate des Jahres.
Bei den drei grossen Gruppen von Industrieerzeugnissen lässt
sich ein allgemeiner Rückgang der kurzfristigen
Wachstumsindi-katoren feststellen : sie lagen im August 1982 für
Grundstoff-und Produktionsgüter bei —2,3%, für Investitionsgüter bei
— 2 , 5 % und für Verbrauchsgüter bei — 1,2%.
4. Eisen und Stahl — Erzeugung um 2 3 , 9 % niedriger als
vor einem Jahr
Die Rohstahlerzeugung der Gemeinschaft (ohne Griechenland)
ist im Oktober 1 982 gegenüber dem Vormonat saisonbereinigt
um 3 , 1 % auf 8,4 Mio t zurückgegangen. Die Veränderung
beträgt gegenüber Oktober 1981 - 2 3 , 9 % . genüber Oktober
1980 —19,6%. Dies ist gleichzeitig das absolut niedrigste
Oktoberergebnis seit Bestehen der Gemeinschaft der Neun. Die
Erzeugung Januar bis Oktober 1 982 ist damit um 8 , 8 %
niedri-ger als im Vergleichszeitraum 1 9 8 1 . Der sehr schwache
Auf-tragseingang bei Massenstahl im August 1982 von nur 4,5
Mio t (Veränderung gegenüber Juli 1982 saisonbereinigt
- 1 2 , 3 % , gegenüber August 1981 - 2 5 . 1 % ) war ein
deutli-ches Vorzeichen für die niedrige Produktionstätigkeit der
folgen-den Monate. Nicht zu übersehen ¡st ferner der kräftige Anstieg
der Importe aus Drittländern im ersten Halbjahr 1982
gegenüber dem ersten Halbjahr 1981 ( + 59%).
5. Entwicklung der Energiewirtschaft im ersten Halbjahr
1 9 8 2
wer-den mussten, lassen sich einige Elemente erkennen, die die
festgestellten Tendenzen für das erste Vierteljahr 1 982
bestäti-gen. Auf Gemeinschaftsebene kennzeichnen folgende
Tatbe-stände die Entwicklung der Energiewirtschaft im Verlauf des
ersten Halbjahres 1982 verglichen mit dem gleichen
Vorjahreszeitraum :
— Deutlich verlangsamter Rückgang des
Gesamtenergiever-brauchs im ersten Halbjahr 1982 (1,8% gegenüber 6 , 3 %
im gleichen Zeitraum 1 981 ).
— Unterschiedliche Entwicklung des Bruttoinlandsverbrauchs
bei dem Einsatz der einzelnen Energiequellen — von
- 5 , 0 % bei Erdöl bis + 1 1 , 6 % bei Kernenergie — wodurch
die Tendenz bestätigt wird, dass andere Energiequellen das
Erdöl ersetzen, wenn auch immer noch im begrenzten
Masse. Daraus ergibt sich eine leichte, aber fortgesetzte
Aenderung der Anteile an festen Brennstoffen und
Kernener-gie, bei denen eine Zunahme von 2 4 , 0 % auf 2 4 , 7 % bzw.
von 6,0% auf 6,9% zu verzeichnen ist, während der Anteil
des Erdöls von 4 9 , 4 % auf 4 7 , 8 % zurückgegangen ist.
— Zunahme der Primärenergieerzeugung um etwa 7 Mio t
Rohöleinheiten ( + 2,8%), hauptsächlich zurückzuführen auf
das aus der Nordsee gewonnene Rohöl, auf die Kernenergie
und, in geringerem Masse, auf die Braunkohle.
— Verringerung der Nettoenergieeinfuhr (Einfuhr minus
Aus-fuhr) um 7,2%. Insbesondere war ein Rückgang bei
Stein-kohle (8.4%) und bei Rohöl (11,4%) festzustellen.
Auf-grund eines sehr starken Anstiegs der Einfuhr von
Erdöler-zeugnissen lag der Rückgang für Rohöl und raffinierte
Erdöl-erzeugnisse insgesamt jedoch nur bei 8 , 1 % .
— Schliesslich ist ein Rückgang der Energieabhängigkeit um
weitere 2,5 Punkte auf ein Niveau von nunmehr 4 5 %
festzustellen. Die Aussenabhängigkeit bei Erdöl konnte
auf-grund des mit einer Steigerung der Rohölerzeugung und
einem Lagerabbau bei Erdölerzeugnissen verbundenen
Ein-fuhrrückgangs auf 3 6 % verringert werden.
6. Landwirtschaft — Index der Erzeugerpreise
landwirt-schaftlicher Produkte
Im zweiten Quartal 1 982 erhöhte sich der Gesamtindex der
Erzeugerpreise landwirtschaftlicher Produkte (ohne Obst und
Gemüse) für EUR 10 um 13,9%. Dieser Prozentsatz, der in
etwa den Prozentsätzen der drei vorausgegangenen Quartale
entspricht, bestätigt die gegenwärtige Stabilisierung der
Preis-steigerungsrate des landwirtschaftlichen Outputs bei ungefähr
14%. Bei den pflanzlichen Erzeugnissen (ohne Obst und
Gemüse) erhöhte sich der Index um 1 7 , 5 % und stieg damit
deutlich beschleunigt gegenüber dem vorausgegangenen
Quar-tal an.
Bei einem Ländervergleich zeigt sich, dass in den meisten
Ländern (7 von 10) die jährliche Steigerungsrate der
Erzeuger-preise landwirtschaftlicher Produkte in diesem Quartal niedriger
ist als vor drei Monaten. In den Niederlanden, im Vereinigten
Königreich, in Irland und in Dänemark ist dieser Rückgang
besonders ausgeprägt. Eine Ausnahme bilden jedoch drei
Länder : Frankreich, Luxemburg und vor allem Italien. Im
allge-meinen bewegen sich die jährlichen Steigerungsraten jetzt
zwi-schen + 4 , 1 % in der Bundesrepublik Deutschland und
+ 2 1 , 9 % in Griechenland.
7. EG-Aussenhandel
In dem Zeitraum Juni bis August 1 982 nahmen die
EG-Ausfuh-ren in Drittländer gegenüber dem entsprechenden
Vorjahreszeit-raum wertmässig nur um 3 % zu (ohne den Beitrag der
Nieder-lande, für die jüngere Daten des Jahres 1982 noch nicht
vorliegen). Hinter dieser Zahl verbirgt sich jedoch eine sehr
unterschiedliche Entwicklung bei den einzelnen Erzeugnissen.
Auf der Basis von Angaben aus acht Mitgliedstaaten läßt sich
erkennen, daß die Nahrungsmittelexporte um 2 4 % , die
Ausfuh-ren chemischer Erzeugnisse und sonstiger bearbeiteter WaAusfuh-ren
um etwa 3 % zurück gegangen sind. Andererseits stiegen die
Ausfuhren von Maschinen und Fahrzeugen um 9%. In Irland
(11%), der Bundesrepublik Deutschland (8%), Griechenland
und dem Vereinigten Königreich (jeweils 5%) lagen die
Aus-fuhrleistungen über dem Gemeinschaftsdurchschnitt, während in
Frankreich, Italien und Dänemark ein Rückgang um 5%, 2 %
bzw. 1 % zu verzeichnen war.
Die Einfuhren aus Drittländern nahmen in diesem Zeitraum um
2 % zu. Die Einfuhren von Rohstoffen, Brennstoffen, Oelen,
Fetten und Wachsen waren niedriger als im Zeitraum Juni bis
August 1 9 8 1 . Bei anderen Kategorien war ein
überdurchschnitt-licher Anstieg der Importe zu verzeichnen.
Die Einfuhren nach Belgien-Luxemburg und Irland lagen im
Zeitraum Juni bis August 1982 unter denen des
entsprechen-den Vorjahreszeitraums. In zwei Mitgliedstaaten, der
Bundesre-publik Deutschland und Irland, war im Handel mit Drittländern
ein Ueberschuss festzustellen.
8. Innergemeinschaftlicher Handel
Der innergemeinschaftliche Handel lag im Zeitraum Juni bis
August 1 982 um 8 % über dem des entsprechenden
Vorjahres-zeitraums (auf der Basis von Angaben aus neun
Mitgliedstaa-ten). Diese Zahl weist auf einen verlangsamten Anstieg hin; die
entsprechende Zahl für den Zeitraum März bis Mai lag bei
1 9%. Wie beim EG-Aussenhandel zählten Belgien-Luxemburg
und Irland zu den Ländern mit den niedrigsten
Einfuhrzuwachs-raten. Frankreich wies in diesem Zeitraum die niedrigste
Aus-fuhrzunahme auf.
9. Finanzen : Zinssenkungen und Währungsunruhen
Die US-Zentralbank unterstrich mit der Senkung des
Diskontsat-zes von 9,5 auf 9 , 1 % am 19. November erneut die Absicht,
die Geldpolitik zu lockern.
Auf den Devisenmärkten kam das Pfund Sterling im November
unter erheblichen Druck. So sackte der Kurs für ein Pfund
Sterling von 1,82353 ECU zu Beginn des Monats auf
1,73942 ECU am 2 4 . 1 1 . , was einen Wertverlust von 4 . 8 %
innerhalb eines Monats darstellt. Das Pfund Sterling befindet
sich nunmehr gegenüber dem ECU auf dem niedrigsten Stand
seit September 1 9 8 1 .
Technischer hinweis
Notice
Eurostatistics — data for short-term economic analysis
is one of three
key Eurostat publications designed to give the reader an overview of the
most important quantitative information available for the Community and
Member States. The other publications in this series are
Basic Statistics
giving data for a specific year, and
Eurostat review
with its summary of
the Community in figures over the past 10 years.
A monthly publication with current economic data must be continually
adapted and updated. At the beginning of 1982 a major modification
took place with the inclusion of data for Greece and a change in
presentation. Totals for the 10-member Community are being
progressively introduced in 1982. Once sufficient data are available,
the base year 19 75 which is fundamental to this publication will be
replaced with 1980. At a later stage it is planned to add data for the
two applicant countries, Portugal and Spain, as well as for the United
States and Japan.
Four kinds of information are published in
Eurostatistics.
Pages 9 and
10 offer an article 'In brief' which looks at the latest trends in the data
available. Pages 15 to 20 provide the reader with a visual presentation
of the most important economic series for the Community and the
Member States. Starting on page 23 there are 56 pages of 'Community
tables '. This section contains data harmonized by Eurostat on the basis
of common criteria. The most recent data are provisional and in some
cases estimated by Eurostat. Finally there is a section 'Tables by
country' which contains a selection of economic indicators most often
used in each country. These are national series based on national
definitions. For comparison a table for the United States is also
included.
For all series, historical data are available on request from Eurostat's
data bank Cronos. Statistical bulletins on unemployment, prices,
industrial production, balance of payments, external trade and energy
are also published monthly or quarterly.
Eurostatistics
itself contains an
absolute minimum of methodological notes. Detailed information on
definitions and methodology may be obtained from Eurostat.
Contents
Symbols and abbreviations
'In brief'
Graphics
COMMUNITY TABLES
1
.
National accounts ESA
Volume
Price
2. Employment
Population
Employment
3. Unemployment
4. Index of industrial production
Industry, construction
Production by category
Production by branch
Branches in difficulty
5. Opinions in industry
16. Output
Industrial products
Agricultural products
7. External trade
Main indicators
ExtraCommunity trade
IntraCommunity trade
Trade by country
8.
Prices
Consumer prices
Producer prices
Wages and salaries in industry .
9. Financial statistics
Exchange rates
Main financial statistics
1 0 . Balance of payments
Main balances
TABLES BY COUNTRY
Belgique/België
Danmark
BR Deutschland
ΕΛΛΑΔΑ
France
Ireland
Italia
Luxembourg
Nederland
United Kingdom
United States
°age
9
15
21
23
23
24
25
25
26
28
31
31
32
33
35
37
41
41
45
46
46
49
55
61
65
65
68
69
7 0
7 0
72
74
74
79
85
86
87
88
89
9 0
91
92
93
94
95
0
14
6 + 8
%
%,T4/T0
%,T12/T0
%, BALANCE
*
1975 = 100 EUR 9 = 100
EUR 10 = 100
MIO MRD Τ
TOE
GWH M3 DM FF UT
HFL
BFR LFR UKL IRL DKR USD ECU SDR EC Eurostat EUR 9
EUR 10
UEBL/BLEU ACP
ESA
NACE
srrc
Nil
Data less than half the unit used
No data available
from 1 to 4
6 and 8
Percent
Percentage increase on the corresponding
quarter of the previous year
Percentage increase on the corresponding
month of the previous year
Balance between positive replies (increase,
improvement in the situation) and negative
replies (reduction, worsening of the situation) in
the shorttermtrends enquiry conducted among
heads of enterprises in the Community
Seasonally adjusted (Tables by country)
Reference year
Data for countries expressed as a percentage of
the Community of 9 total
Data for countries expressed as a percentage of
the Community of 1 0 total
Million
Thousand million
Tonne
Tonne of oil equivalent
Gigawatt hour ( = 1 0
6kWh)
Cubic metre
Deutschmark
French franc
Italian lira
Dutch guilder
Belgian franc
Luxembourg franc
Pound sterling
Irish pound
Danish crown
US dollar
European currency unit
Special Drawing Right
European Communities
Statistical Office of the European Communities
Total of the member countries of the EC until
1 9 8 0
Total of the member countries of the EC from
1981
BelgoLuxembourg Economic Union
African, Caribbean and Pacific countries of the
Lomé Convention
European System of Integrated Economic
Accounts
Eurostatistics: in Brief
1. Unemployment — 1 1 , 5 million unemployed registered
There were 1 1,5 million persons registered as unemployed in
the Community of the Nine at the end of October 1 9 8 2 ; the
unemployment rate for the civilian working population rose from
1 0 . 2 % at the end of September 1 982 to 1 0 . 3 % at the end of
October. There was a further increase in the seasonally adjusted
totals for unemployment, indicating that the situation in Member
States worsened during October 1 982. This is true even for the
United Kingdom where, despite a 1.4% drop in the absolute
figures, the seasonally adjusted figures indicate an increase in
the numbers of unemployed.
The largest percentage increases in the absolute figures for
registered unemployed as compared with September 1982
occurred in Luxembourg ( + 1 6 . 4 % ) and in Denmark
( + 1 0 . 5 % ) . Increases above the 1.9% average for the
Commu-nity of the Nine also occurred in Germany ( + 5.5%). France
( + 3.70/0), Ireland ( + 3.0%) and the Netherlands ( + 2.2%). In
Italy the increase was near the Community average, while in
Belgium there was practically no change over the previous
month.
At the end of October 1 982, as in previous months, the highest
unemployment rate in the Community of the Nine was
regis-tered in Belgium (14.8%), followed by Ireland (13.5%). the
United Kingdom (12.8%). the Netherlands (11.1%) and Italy
(10.9%). France (9.6%) and Denmark (9.4%) were slightly
under the Community average. As before, the lowest
unemploy-ment rates were in Luxembourg (1.5%) and the F.R. of
Ger-many (7.3%). The continued deterioration in the labour market
situation is clear from a comparison with October 1 9 8 1 . Since
then, unemployment in the Community of the Nine has risen by
17.4%. Particularly large percentage increases in
unemploy-ment over the past year have occurred in the F.R. of Germany
( + 40.6%), the Netherlands ( + 38.6%). Luxembourg
( + 33.9%) and Ireland ( + 27.7%).
2. Consumer prices in October 1 9 8 2
Between September and October 1 982, consumer prices in the
European Community increased on average by 0.9%. Increases
below the general average were recorded in Germany and the
Netherlands (both 0.3%); France and the United Kingdom (both
0.5%) and Belgium 0.8%. Increases in Denmark at 1 % and
Luxembourg at 1 . 1 % were slightly above the average while the
increases in Italy (2.0%) and Greece (2.4%) were significantly
more.
The increase over 1 2 months for the Community of Ten is
1 0 . 1 % ; the lowest such increase since mid-1979. The lowest
increases were in the Netherlands ( + 4.7%), Germany
( + 4.9%) and the UK ( + 6.8%). Near to the average were
France ( + 9.4%). Belgium ( + 9.8%), Denmark ( + 1 0 . 3 % ) and
Luxembourg ( + 1 0 . 4 % ) . The highest increases were recorded
in Ireland ( + 1 7 . 0 % ) , Italy ( + 1 7.4%) and Greece ( + 20.0%).
3. Index of industrial production: Clear downward trend
since June 1 9 8 2
The provisional index of industrial production in the Community
stood at 101.0 in July and 85.5 in August 1982
( 1 9 7 5 = 1 0 0 ) , corresponding to falls of 3.1 and 2 . 6 %
respec-tively compared with the same months of the previous year,
thereby confirming the deterioration which had started in June
with a clear decline in the index of almost 2 % . The average fall
in the index for the three months June to August 1 982 (these
months are difficult to assess individually because of the
varia-ble impact of annual works holidays on production) as
com-pared with the same period in 1981 is 2.5%, which shows
quite clearly that the hopes of an economic upturn, to which the
firm production trends during the months of April and May
1 982 had given rise, have not been borne out in reality.
After seasonal adjustment, the index of production was 112.5
in July and 112.0 in August 1982 ( 1 9 7 5 = 1 0 0 ) . compared
with an average of 1 1 4.8 for the first five months of the year.
As regards the three main groups of industrial products, a
generalized decline in the short-term growth indicators was
observed: the latter stood in August 1982 at - 2 . 3 % for
intermediate products, —2.5% for capital goods and - 1 . 2 %
for consumer goods.
4. Iron and Steel — production 2 3 . 9 % down on a year ago
In October 1 982 the production of crude steel of the
Commu-nity (ex Greece) at 8.4 mio t, has shown a drop of 3.1 % (after
deseasonalisation) compared with the previous month. This
figure is 2 3 . 9 % below that for October 1981 and 1 9 . 6 %
lower than the October 1 980 figure. It represents the lowest
October production since the creation of the Community of the
Nine. The first ten months of 1 982 show a reduction of 8 . 8 %
when compared with the same months of the preceding year.
At the very low level of 4.5 mio t. new orders (ordinary steels)
in August 1982 (—12.3%) after deseasonalisation compared
with July 1982. - 2 5 . 1 % compared with August 1981) have
already pointed to the fall in production during subsequent
months. Equally notable is the significant rise in imports from
third countries in the course of the first half of 1982, as
compared with those of the first half of 1 981 ; viz. + 5 9 % .
5. Energy -developments in the energy economy in the first
half of 1982
Although some figures have had to be estimated because
certain statistics were not available as usual, the results for the
first half of 1 982 contain indications which confirm the trends
observed in the first quarter of 1982. At Community level, the
salient features of the developing energy situation in the first
half of 1982 as compared with the same period in 1981 are
as follows:
— A marked slowing in the rate of decline of gross energy
consumption, which stood at 1.8% as opposed to a
year-on-year drop of 6.3% observed for the first half of 1 981 ;
— Differences in the development of gross domestic
confirm the trend to substitution, though still on a limited
scale, of other energy sources for oil; a consequent slight
but sustained change in the proportion of consumption
accounted for by solid fuels and nuclear energy, which
increased from 2 4 . 0 % to 2 4 . 7 % and from 6.0% to 6.9%
respectively, and, conversely, in the proportion represented
by oil, which fell from 4 9 . 4 % to 4 7 . 8 % ;
— An increase of about 7 million toe (i.e. + 2 . 8 % ) in primary
energy production, largely attributable to North Sea oil,
nuclear energy and, to a lesser extent, lignite;
— A drop of 7.2% in net energy imports (imports minus
exports) and in particular in imports of coal (8.4%) and
crude oil (11.4%), though it should be noted that the drop
for crude oil and refined petroleum products taken together
was only 8 . 1 % as imports for petroleum products increased
very substantially;
— As a result of the above, a further reduction of two and a
half points in overall dependence on external sources of
energy to only 4 5 % , dependence in respect of oil being
reduced to 3 6 % by the fall in imports together with an
increase in crude oil production and a run-down in stocks of
petroleum products.
6. Agriculture — index of producer prices of agricultural
products
During the second quarter of 1982, the overall index of
producer prices of agricultural products (excluding fruit and
vegetables) for EUR 10 showed an increase of 13.9%. This
figure, of the same order of magnitude as that for the three
previous quarters, confirms the current levelling off of the rate
of increase of agricultural output prices at around 14%. The
index for crops (excluding fruit and vegetables) rose by 1 7.5%,
which represents a marked increase on the previous quarter.
An analysis by Member State shows that in the majority (seven
countries out of ten) the annual rate of increase in producer
prices of agricultural products was not as great as three months
previously. This slowdown was particularly apparent in the
Netherlands, the United Kingdom, Ireland and Denmark.
Howe-ver, three countries registered an upward trend: France,
Luxem-bourg and, particularly, Italy. All in all, the increases over the
year range from + 4 . 1 % in the case of the Federal Republic of
Germany to + 2 1 . 9 % in the case of Greece.
7. Extra-EC Trade
In the three months to end August 1 982. Community exports
to third countries were only three per cent higher in value than
in the corresponding period of 1981 (excluding a contribution
from the Netherlands for which recent 1 982 data is not yet
available). This figure masks a widely differing performance
accross products. Based on data from eight member states,
food exports fell by 24 per cent, and chemical products and
miscellaneous manufactured articles fell by around 3 per cent.
On the other hand, exports of machinery and transport
equip-ment rose by 9 per cent. Looking at individual Community
members, Ireland (11 per cent), Germany (8 per cent), Greece
and the United Kingdom (5 per cent) have had a better trend in
export performance than the Community average, whilst France,
Italy and Denmark recorded falls of 5.2, and 1 per cent
respectively.
Community imports from third countries rose by two per cent in
this period. Imports of crude materials, fuel products and oils,
fats and waxes were lower than in June-August 1 9 8 1 . Imports
of other categories of imports rose by more than the average.
Imports into Belgium-Luxembourg and Ireland in the three
months to August 1 982 were lower than in the corresponding
period of 1 9 8 1 . There were two member countries with a trade
surplus on extra-EC trade, Germany and Ireland.
8. Intra-EC Trade
Intra-EC imports in the period June-August 1 982 were 8 per
cent higher than in the corresponding period of 1981 (based
on figures for 9 countries). This marks a slowing down in the
rate of growth; the corresponding figure for the previous three
months to May was 19 per cent. As with extra-EC trade,
Belgium-Luxembourg and Ireland were amongst the countries
with the lowest imports growth. France had the lowest growth
of exports in this period.
9. Finances: Falls in interest rates and currency
perturba-tions
The US Federal Reserve further underlined its intention of
relaxing monetary policy by lowering the Discount Rate from
9.5 to 9.1 % on November 1 9th.
In November the Pound Sterling came under considerable
pressure. The Pound exchange rate fell from 1.82353 ECU at
the beginning of the month to 1.73942 ECU on 24th
Novem-ber which corresponds to a loss in value of 4.8%. The Pound
Sterling is now at its lowest rate against the ECU since
Septem-ber 1 9 8 1 .
Technical note
Avertissement
Eurostatistiques — données pour l'analyse de la conjoncture
est l'une
des trois publications clés d'Eurostat, destinées à donner au lecteur un
aperçu des informations quantitatives les plus importantes disponibles
concernant la Communauté et les États membres. Les autres
publications de cette série sont les
Statistiques de base
fournissant des
données pour une année spécifique déterminée et la
Revue de
l'Eurostat
qui passe en revue dix ans de la Communauté sous forme de
tableaux chiffrés.
Une publication mensuelle contenant des données économiques
conjoncturelles d'actualité doit être continuellement adaptée et mise à
jour. Au début de 1982, une modification importante est intervenue
avec l'inclusion de données concernant la Grèce et un changement de
présentation. Des totaux pour la Communauté de dix membres seront
progressivement introduits en 1982. Lorsque l'on disposera de
données en nombre suffisant, l'année 1975 — année de référence
pour cette publication
—
sera remplacée par 1980. Il est prévu
ultérieurement d'ajouter les données concernant les deux pays
candidats à l'adhésion
—
à savoir l'Espagne et le Portugal — ainsi que
pour les États-Unis et le Japon.
Eurostatistiques
publie quatre types d'informations. Les pages 13 et 14
contiennent un article « En bref » dans lequel les dernières tendances
pouvant être dégagées à partir des données disponibles sont
examinées. Les pages 15 à 20 fournissent au lecteur une présentation
visuelle des séries économiques les plus importantes pour la
Communauté et les États membres. Des « tableaux communautaires »
sont présentés sur 56 pages à partir de la page 23. Cette section
contient des données harmonisées par Eurostat sur la base de critères
communs. Les données les plus récentes sont provisoires et, dans
certains cas, estimées par Eurostat. Enfin, la section « tableaux par
pays » contient une sélection des indicateurs économiques les plus
souvent utilisés dans chaque pays. Ce sont des séries nationales
fondées sur des définitions nationales. A des fins de comparaison, un
tableau concernant les États-Unis est également inclus.
Pour toutes les séries, des données historiques sont disponibles sur
demande auprès de la banque de données d'Eurostat, CRONOS. Les
bulletins statistiques sur le chômage, les prix, la production industrielle,
la balance des paiements, le commerce extérieur et l'énergie sont
également publiés sur une base mensuelle ou trimestrielle. En soi,
Eurostatistiques
contient un minimum de notes méthodologiques. Une
information détaillée concernant les définitions et la méthodologie
peut-être obtenue auprès d'Eurostat.
Table des matières
Signes et abréviations
« En bref » Graphiques
TABLEAUX C O M M U N A U T A I R E S
1. C o m p t e s n a t i o n a u x S E C
Évolution en v o l u m e Évolution des prix
2 . Emploi
Population Emploi
3 . C h ô m a g e
4 . Indices d e la production industrielle
Industrie, construction Production par catégorie Production par branche
Production des branches s e n s i b l e s . . .
5 . Opinions dans l'industrie (1) 6 . Production
Produits industriels Produits agricoles
7 . C o m m e r c e e x t é r i e u r
Principaux indicateurs
C o m m e r c e extracommunautaire C o m m e r c e intracommunautaire C o m m e r c e par pays
8 . Prix
Prix à la c o n s o m m a t i o n Prix à la p r o d u c t i o n Salaires dans l'industrie
9 . S t a t i s t i q u e s financières
Taux de change
Principales statistiques financières . . .
1 0 . Balance des p a i e m e n t s
Principaux soldes
TABLEAUX PAR PAYS B e l g i q u e / B e l g i ë D a n m a r k BR Deutschland ΕΛΛΑΔΑ
France Ireland Italia L u x e m b o u r g Nederland United K i n g d o m United States
"age
1 3
15
21
23
23
2 4
25
25
26
28
31
31
3 2
33
35
37
41
41
45
4 6
4 6
4 9
5b
61
65
65
6 8
69
70
70
72
74
74
79
85
86
87
88
89
90
91
92
93
9 4
95
_
0
14 6 + 8
%
%,T4/T0
■/•.T12/T0
'/·. SOLDE
*
1975 = 100 EUR 9 = 100
EUR 10 = 100
MIO
MRD
Τ ΤΕΡ
GWH
Μ3
DM
FF
LIT HFL
BFR
LFR
UKL
IRL
DKR USD
ECU
DTS
CE
Eurostat
EUR 9
EUR 10
UEBL/BLEU
ACP
SEC
NACE
CTCI
Néant
D o n n é e inférieure à la moitié de l'unité utilisée D o n n é e n o n d i s p o n i b l e
De 1 à 4 6 et 8 Pourcentage
A c c r o i s s e m e n t en pourcentage d'un trimestre sur le trimestre c o r r e s p o n d a n t de l'année précédente
A c c r o i s s e m e n t en pourcentage d'un mois sur le mois c o r r e s p o n d a n t de l'année précédente Solde entre les réponses positives
(accroissement, amélioration de la situation) et les réponses négatives ( d i m i n u t i o n ,
détérioration de la situation) à l'enquête de c o n j o n c t u r e auprès des chefs d'entreprise de la C o m m u n a u t é
Désaisonnalisé (tableaux par pays) A n n é e de base
D o n n é e s des pays exprimées en pourcentage total de la C o m m u n a u t é à neuf ( = 1 0 0 ) Données des pays exprimées en pourcentage du total de la C o m m u n a u t é à dix
M i l l i o n Milliard Tonne métrique Tonne équivalent pétrole Gigawattheure = 1 06 k W h
Mètre cube Deutsche M a r k Franc français Lire italienne Florin néerlandais Franc belge
Franc l u x e m b o u r g e o i s Livre sterling
Livre irlandaise Couronne danoise Dollar US
Unité monétaire européenne Droits de tirages spéciaux C o m m u n a u t é s européennes Office statistique des C o m m u n a u t é s e u r o p é e n n e s
Ensemble des pays m e m b r e s des
C o m m u n a u t é s européennes jusqu'à 1 9 8 0 Ensemble des pays m e m b r e s des
C o m m u n a u t é s européennes à partir de 1 9 8 1 U n i o n é c o n o m i q u e b e l g o l u x e m b o u r g e o i s e Pays d ' A f r i q u e , des Caraïbes et d u Pacifique — Convention de Lomé
Système e u r o p é e n de c o m p t e s é c o n o m i q u e s intégrés
N o m e n c l a t u r e générale des activités é c o n o m i q u e s dans les C o m m u n a u t é s e u r o p é e n n e s
[image:14.595.47.511.163.744.2]Eurostatistiques : en bref
1. Chômage : 11,5 millions de chômeurs enregistrés
Il y avait 11,5 millions de personnes inscrites au chômage dans
la Communauté Européenne des Neuf à la fin du mois
d'octo-bre 1982. Le taux de chômage enregistré par rapport à la
population active civile est ainsi passé à 10,3%. par rapport à
1 0 , 2 % à la fin du mois de septembre 1 982. Comme le nouvel
accroissement des valeurs corrigées des variations saisonnières
l'indique, la situation sur les marchés du travail s'est encore
détériorée dans tous les États membres de la Communauté en
octobre 1982. Ceci est aussi le cas au Royaume-Uni où,
malgré une diminution de 1,4% des chiffres bruts, les données
corrigées des variations saisonnières ont augmenté.
Les accroissements les plus importants, en données brutes, de
chômage enregistré sont observés au Luxembourg ( + 1 6 , 4 % )
et au Danemark ( + 1 0 , 5 % ) . Des augmentations supérieures à
la moyenne communautaire ( + 1 , 9 % ) ont été enregistrées en
R.F. d'Allemagne ( + 5 , 5 % ) , France ( + 3,7%), Irlande ( + 3,0%)
et aux Pays-Bas ( + 2,2%). En Italie l'accroissement était proche
de la moyenne communautaire, tandis qu'en Belgique il n'y
avait pratiquement pas de changement par rapport au mois
précédent.
A la fin d'octobre 1 982 le taux de chômage enregistré le plus
élevé de la Communauté était, comme les mois précédents,
celui de la Belgique (14,8%) suivi de celui de l'Irlande
(13,5%), du Royaume-Uni (12,8%), des Pays-Bas (11,1%) et
de l'Italie (10,9%). La France (9.6%) et le Danemark (9,4%)
sont à un niveau légèrement inférieur à la moyenne
communau-taire. Comme auparavant les taux les plus faibles sont observés
au Luxembourg (1,5%) et en R.F. d'Allemagne (7,3%). La
détérioration continue de la situation du marché du travail
apparaît clairement quand on la compare à celle d'octobre
1 9 8 1 . Depuis lors, le chômage a augmenté de 1 7 , 4 % dans la
Communauté des Neuf. Des accroissements du chômage
parti-culièrement importants ont été enregistrés en R.F. d'Allemagne
( + 40,6%), aux Pays-Bas ( + 38,6%), au Luxembourg
( + 33,9%) et en Irlande ( + 27,7%).
2. Index des prix à la consommation en octobre 1 9 8 2
Entre septembre et octobre 1982, l'indice des prix à la
consommation de la Communauté (EUR 10) a augmenté de
0,9%. Les hausses inférieures à cette moyenne sont observées
en R.F. d'Allemagne et aux Pays-Bas (0,3%), en France et au
Royaume-Uni (0,5%) ainsi qu'en Belgique (0,8%). Les hausses
au Danemark (1,0%) et au Luxembourg (1,1%) sont
légère-ment supérieures à la moyenne tandis que pour l'Italie (2,0%)
et pour la Grèce (2,4%) les hausses sont nettement supérieures
à la moyenne.
Le rythme de hausse en un an pour la Communauté (EUR 10)
est de 1 0 , 1 % , ce qui est le rythme le plus bas observé depuis
le milieu de l'année 1 979. Les hausses les plus faibles ont été
enregistrées aux Pays-Bas ( + 4,7%). en Allemagne ( + 4,9%)
et au Royaume-Uni ( + 6,8%). Autour de la moyenne se
trou-vent la France ( + 9.4%), la Belgique ( + 9,8%), le Danemark
( + 1 0 , 5 % ) et le Luxembourg ( + 1 0 , 4 % ) . Les hausses les plus
importantes ont été enregistrées en
( + 1 7 . 4 % ) eten Grèce ( + 20.0%).
lande ( + 1 7 . 0 % ) , en Italie
3. Indice de la production industrielle
baisse depuis juin 1982
Claire tendance à la
L'indice provisoire de la production industrielle dans la
Commu-nauté s'est établi à 101,0 en juillet et 85.5 en août 1982
(1 9 7 5 = 100), correspondant à des baisses respectives de 3,1
et 2 , 6 % par rapport aux mois respectifs de l'année précédente,
et confirmant ainsi la dégradation qui s'était manifestée en juin
avec un net recul de l'indice de près de 2 % . La baisse
moyenne de l'indice pour les trois mois de juin à août 1 982
(mois difficiles à apprécier individuellement en raison de
l'im-pact variable des fermetures annuelles sur la production) par
rapport à la même période de 1981 se chiffre à 2,5%, faisant
clairement apparaître que les espoirs de reprise engendrés par
la bonne tenue de la production aux mois d'avril et de mai
1 982 ne se sont pas vérifiés.
Après correction des variations saisonnières, l'indice de
produc-tion était de 112,0 en juillet et 114,8 en août 1982
( 1 9 7 5 = 1 0 0 ) , comparé à 114,8 en moyenne pour les cinq
premiers mois de l'année.
Au niveau des trois grands regroupements de produits
indus-triels, on observe un repli généralisé des indicateurs de
crois-sance à court terme : ceux-ci se trouvaient en août 1 982 à
— 2 , 3 % pour les biens intermédiaires, à —2.5% pour les biens
d'investissement et à — 1,2% pour les biens de consommation.
4. Sidérurgie : Production diminuée de 2 3 , 9 % en un an
En octobre 1982 la production communautaire d'acier brut
(sans la Grèce) avec 8.4 mio t. a enregistré une baisse
désaisonnalisée de 3 , 1 % par rapport au mois précédent. Ce
chiffre est inférieur de 2 3 . 9 % au mois d'octobre 1 9 8 1 , et de
19,6% au mois d'octobre 1980. C'est le mois d'octobre le
plus faible depuis l'existence de la Communauté des Neuf. Les
dix premiers mois de l'année 1982 sont en baisse de 8 , 8 %
comparés aux mêmes mois de l'année précédente.
Avec 4,5 mio t. les commandes nouvelles (aciers courants) très
faibles du mois d'août 1982 (—12,3% désaisonnalisé
com-paré à juillet 1982, - 2 5 , 1 % comcom-paré à août 1981) ont déjà
annoncé la baisse de production des mois suivants. Il est
également à remarquer l'augmentation importante des
importa-tions en provenance des pays tiers au cours du 1
e rsemestre
1 9 8 2 , comparées à celles du 1
e rsemestre 1981 : + 5 9 % .
5. Énergie
:
Évolution de l'économie énergétique au cours
du premier semestre de 1 9 8 2
situation énergétique au cours du premier semestre 1 982 par
rapport à la période homologue de 1 981 sont les suivants :
— Net ralentissement de la baisse de la consommation
énergé-tique globale qui a été de 1,8% contre 6,3% constaté pour
le premier semestre 1 981 par rapport à la même période de
1980
— Évolution divergente des consommations intérieures brutes
des différentes sources d'énergie s'étalant de — 5 , 0 % pour
le pétrole à + 1 1 , 6 % pour l'énergie nucléaire, qui confirme
la tendance à une substitution, bien qu'encore limitée, au
détriment du pétrole; en conséquence, modification légère
mais continue des parts des combustibles solides et de
l'énergie nucléaire qui augmentent (de 2 4 , 0 % à 2 4 , 7 % et
de 6,0% à 6,9% respectivement) et a contrario, de celle du
pétrole qui diminue (de 4 9 , 4 % à 47,8%).
— Augmentation de la production d'énergie primaire d'environ
7 millions de tonnes d'équivalent pétrole (soit + 2 , 8 % )
imputable essentiellement au pétrole brut de la Mer du
Nord, à l'énergie nucléaire et, en moindre mesure, au
lignite.
— Diminution des importations nettes d'énergie (importations
moins exportations) de 7,2% en particulier de houille 8 , 4 %
et de pétrole brut 11,4%. Toutefois, compte tenu d'une très
importante progression des importations de produits
pétro-liers, la baisse pour l'ensemble du pétrole brut et des
produits pétroliers raffinés n'a été que de 8,1 %.
— En tant que terme résultant, chute de la dépendance
énergé-tique totale de deux points et demi supplémentaires, limitant
ainsi le niveau à 4 5 % . La dépendance pétrolière, quant à
elle, du fait de la diminution des importations conjuguée à
un accroissement de la production de pétrole brut et à un
déstockage de produits pétroliers, a été réduite à 3 6 % .
6. Agriculture
agricoles
Indice des prix à la production des produits
Au cours du second trimestre de 1 982, l'indice global des prix
à la production des produits agricoles (sans fruits et légumes) a
augmenté, pour EUR 1 0, de 1 3,9%. Ce chiffre, du même ordre
de grandeur que celui des trois trimestres précédents, confirme
la stabilisation actuelle du rythme de hausse des prix des
outputs de l'agriculture à un niveau voisin de 1 4 % .
Pour les produits végétaux (sans fruits et légumes), l'indice a
augmenté de 1 7,5%, ce qui représente une très forte
accéléra-tion par rapport au trimestre précédent.
Une analyse par État-membre montre que dans la majorité
d'entre eux (sept sur dix) le rythme de hausse annuelle des prix
à la production des produits agricoles est moins fort ce
trimes-tre qu'il y a trois mois. Cette décélération est particulièrement
nette aux Pays-Bas, au Royaume-Uni, en Irlande et au
Dane-mark. Trois pays font toutefois exception : la France, le
Luxem-bourg et surtout l'Italie. Au total, les hausses annuelles
s'éche-lonnent maintenant entre + 4 , 1 % pour la République Fédérale
d'Allemagne et + 2 1 , 9 % pour la Grèce.
7. Commerce extra-communautaire
Dans les trois mois jusqu'à fin août 1982, les exportations
communautaires vers des pays tiers étaient en hausse de 3 %
par rapport à la même période de 1 981 (les données pour les
Pays-Bas ne sont pas incluses). Ce chiffre cache des différences
très importantes entre produits. Selon les données de huit pays
les exportations des produits alimentaires ont diminué de 2 4 % ,
et celles des produits chimiques et articles manufacturés divers
de 3%. Toutefois, les exportations de machines et matériels de
transport ont augmenté de 9%. Une analyse par pays membre
démontre que les exportations ont augmenté de 11 % en
Irlande, de 8 % en Allemagne et de 5 % en Grèce et au
Royaume-Uni tandis que la France, l'Italie et le Danemark ont
connu des baisses de 5%, 2 % et 1 % respectivement.
Les importations des pays tiers ont augmenté de 2 % dans la
même période par rapport au même trimestre de 1 9 8 1 . Pour
les matières brutes non comestibles, produits énergétiques et
huiles, graisses et cires une baisse a été enregistrée. Les
importations des autres secteurs ont été au-dessus de la
moyenne.
Les importations vers Belgique-Luxembourg et Irlande pour
cette période ont diminué par rapport à juin-août 1 9 8 1 . Deux
pays membres connaissent un excédent dans leur commerce
extra-communautaire : Allemagne et Irlande.
8. Commerce intra-communautaire
Les importations intra-communautaires pour la période juin-août
1 9 8 2 étaient 8 % au-dessus du niveau de la même période en
1981 (les chiffres pour les Pays-Bas sont exclus). Ceci signifie
un ralentissement du taux de croissance; le chiffre
correspon-dant pour les trois mois jusqu'à mai étant de 1 9%. Comme
pour le commerce extra-communautaire Belgique-Luxembourg
et Irlande sont parmi les pays ayant les plus bas taux de
croissance de leurs importations. La France a connu le plus bas
taux de croissance de ses exportations à la même période.
9. Finances : Taux d'intérêt plus bas et perturbations
moné-taires
La Federal Reserve des États-Unis a de nouveau souligné son
intention d'assouplir sa politique monétaire en diminuant son
taux d'escompte de 9,5 à 9 , 1 % le 19 novembre dernier.
En novembre la Livre Sterling a fait l'objet de pressions
impor-tantes. Le taux de change pour la Livre a baissé de
1.82353 ECU début novembre à 1,73942 ECU le
24 novembre : une perte de valeur de 4,8%. La Livre Sterling
se trouve maintenant à son plus bas taux contre l'ECU depuis
septembre 1 9 8 1 .
Note technique
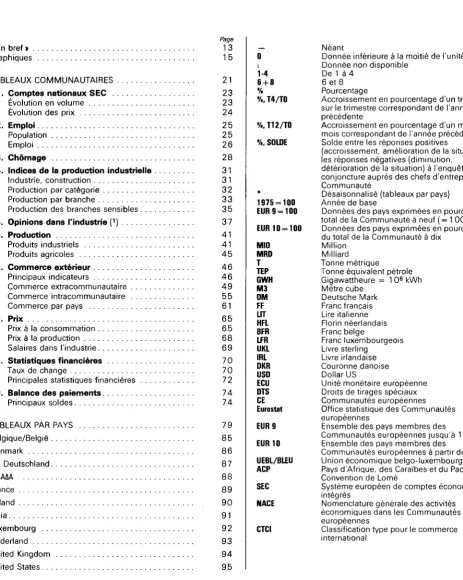
REGISTRIERTE ARBEITSLOSIGKEIT REGISTERED UNEnPLOYIIENT EUR 10 ΠΙΟ
CHOrlAGE ENREGISTRE
INSGESAMT
I NSGESAriT / SA ISONBEREIΝI GT rlAENNER/SA ISONBEREIΝIGT F'RAUEN /SAI SONBERE IΝI GT
TOTAL
TOTAL/SEASONALLY ADJUSTED ΠΕΝ/SEASONALLY ADJUSTED WOnEN/SEASONALLY ADJUSTED
TOTAL
TOTAL/DESA ISONNALISE HOnriES / DESA I SONNAL I SE FEnflES / DESA I SONNAL I SE
1919
1980
1 9 8 1
1982
INDUSTRIELLE PRODUKTION TENDENZ EUR 10
INDUSTRIAL PRODUCTION TREND EUR 10
1915=100
PRODUCTION INDUSTRIELLE TENDANCE EUR 10
INDUSTRIE NACE 1-¿ INDUSTRY NACE 1-ά
üRUNDST, U„ PRODUKTIONSGUETER INTERMEDIATE GOODS INVESTITIONSGUETER INVESTMENT GOODS 'JERBRAUCHSGUETER CONSUMPTION GOODS
INDUSTRIE NACE 1-¿ BIENS INTERMEDIAIRES BIENS D'INVESTISSEMENT BIENS DE CONSOMMATION
130
125
120
110
105
100
130
125
._ 10C
MEINUNGSUMFRAGE IN DER INDUSTRIE (NACE 2-¿)
ι SALDO
OPINIONS IN INDUSTRY (NACE Ζ-ài
* BALANCE EUR 10
OPINIONS DANS L'INDUSTRIE (NACE
2-:» SOLDE
50
40
30
20
10
O
■ 10
-20
-30
-¿O
-50
-GO
-10
PRODUKTIONSAUSSICHTEN AUFTRAGSBESTAND LAGERBESTAENDE AN
FERTIGERZEUGNISSEN
PRODUCTION EXPECTATIONS ORDER BOOKS
STOCKS OF FINISHED PRODUCTS
PERSPECTIVES DE PRODUCTION GARNETS DE COMMANDES STOCKS DE PRODUITS FINIS
50
¿O
30
20
10
o
-10
-20
-30
-¿O
-50
-60
-10
1918
1919
1980
1 9 8 1
1982
AUSSENHANDEL SAISONBEREINIGT
EINFUHR EXTRA-EG AUSFUHR EXTRA-EG
EXTERNAL TRADE SEASONALLY ADJUSTED
EUR 10 MRD ECU IMPORTS EXTRA-EC EXPORTS EXTRA-EC
COMMERCE EXTERIEUR DESAISONNALISE
IMPORTS EXTRA-CE EXPORTS EXTRA-CE
28
26
Zi
22 _
20
18
16
1¿ _
12 _
28
Za
22
20
18
16
li
15 _
li _
13
12
VERBRAUCHERPREISE VERAENDERUNG
CONSUMER PRICES VARIATION
PRIX A LA CONSOMMATION VARIATION s T 1 2 / T 0
EUR I O
t
ι ι ì ' I I I I I I I ' ' I ' ' ' ' ' ' ' ' ' i ' ' ' ' ' I I I I I ! I15
14
13
12
_ 1 1
_ 10
I ! ! I
Ì
1918
1919
1980
1 9 8 1
1982
1 . 5 0 0
1.400
1 . 3 0 0
1 . 2 0 0
1 . 1 0 0
1 . 0 0 0
. 9 0 0
. 8 0 0
—
] I
WECHSELKURSE
l . l l l l l <
1 ECU ρ
J _
, . 1 ,
t. USD
, ) , , ! , ,
EXCHANGE RATES 1 ECU . . . 1 ECU = . . .
, , 1 , , 1 , , 1 ,
SDR
j 1 1 1 1 1
1 ECU =
Ι
M I M 1TAUX DE CHANCE . . . DTS . . . USD
, 1 . . 1 . . 1
_ 1.5001 . 4 0 0
_ 1 . 3 0 0
1 . 2 0 0
_ 1 . 1 0 0
1 . 0 0 0
_ . 9 0 0
. 8 0 0
1918
191?
Q140 _
135
130 _
125 _
120 _
115
105 _
100
INDUSTRIELLE PRODUKTION NACE 1-4 TENDENZ
INDUSTRIAL PRODUCTION NACE 1-4 TREND
1915=100
♦ ι 1111111111
PRODUCTION INDUSTRIELLE NACE 1-4 TENDANCE
UK
EUR 1 0
95 I i ι Ι ι ι Ι ι ι Ι ι ι Ι ι I i I I I 1 I I
^V++
* * . ,
ι ι ι ι ι ι ι ι ι ι ι ι ι ι ι ι Ι ι ι 1 ι ι Ι ι ι
*»«.·
Ι ι ι Ι ι ι I 95
1 4 0
135
130
125
120
115
110
105
1918
1919
1980
1 9 8 1
1982
140
130 _
125 _
120 _
115 _
110
105
95
INDUSTRIELLE PRODUKTION NACE 14 INDUSTRIAL PRODUCTION NACE 1 4 PRODUCTION INDUSTRIELLE NACE 14
TENDENZ TREND TENDANCE
1 9 1 5 1 0 0
NL Β L 'RL DK GR
Lt ID i n
J, ++ "
* **
*
* ♦ ♦ ♦ ·
! 1 i 1 1 1 1 1 1 1 1
«* 1
.« ** «,
* *"
» ·>*
ƒt
f
if ♦ * » . »
. * * *
* " +
— » * * * * ·
,»*
»f \ +++ +++ Λ.**
I 1 1 I 1 1 1 1 1 1 1
+ ++ +' „
" N
/
>
*
\
*
»
">
: î * · · .
*
V,
\
\ \ / +H
\
V*"* **\
\
1 1 1 1 1 1 1 I I 1 1
Jî* *> . , î A* ' * *i
x + 1*
**
ι»*
".*"
· * " " * * .
'·,
Λ" i ;:l i l i l í , 1 ι Ι ι I
/
* "»
\
*>
» « * "*
» * +
]
. · ■ " \
ι ι 1 ι ι L i ι 1
—
~
'
1 1 140
_ 135
_ 130
1 2 5
_ 120
_ 115
_ 105
_ 100
95
1918
1919
1980
1981
1982
EINFACH- LOGARITHniSCHE SKALA SERI-LOCABITHniC SCALE ECHELLE SEni-LOGABΙΤΗΠIQUE
300 21S
250
225
200
180
160
140
VERBRAUCHERPREISE GESAMT INDEX
^ ^ ^ W ^ · * * * « * * *1* * * *
CONSUMER PRICES GENERAL INDEX
1915=100 ,„.,.. L „ „ ♦
PRIX A LA CONSOMMATION INDICE GENERAL
IRL DK GR
EUR 10
«at«****
i W t,i».ö*· ******. «jj ( j f t t * · * * *; ö
tti'îîî
* ^ 4'
,ΆΡ***** MJ*****
. _ 350
30C
215
250
225
£00
180
180