International Journal of Innovative Technology and Exploring Engineering (IJITEE) ISSN: 2278-3075,Volume-8 Issue-3C, January 2019
Abstract: Background/Objectives: Various studies have been conducted on the same research topic. However, the results are the same in some cases but others in others. Therefore, it is necessary to conduct a systematic and quantitative analysis of various research results on the same topic using Meta - analysis. Methods/Statistical analysis: In this study, 96papers on the topics of 'consultant competency' and 'consulting performance' were extracted from the domestic dissertation published for 10 years from 2009 to 2018. Text mining was conducted to confirm that these articles cover the same topic. And the study of hypotheses related to the impact of consultant competency and attitude on consulting performance. A Meta - analysis of selected papers was conducted to draw general conclusions on the different conclusions. Text mining and Meta - analysis use statistical package R. Findings: As a result of text mining, the key keywords were 'consulting', 'performance', 'consultant', 'management', 'effect' and so on. These words have been identified as key words in the literature on consultant competency and consulting performance. Meta - analysis used correlation coefficients of variables. Hypothesis testing for the heterogeneity of the population of each study hypothesis and the effect size and the mean effect size were calculated. The consultant competency and attitude ability were found to have a great effect on consulting performance. In the analysis of the publication bias as to whether the individual study represents the entire group of research, the consultant competency had not publication bias, but the consultant attitude was confirmed to be a publication bias. Improvements/Applications: Inthis paper, Meta - analysis is conducted for theses, but it can be extended to articles published in academic journals in the future. It is also expected that the research topic will also be meaningful research to extend the general conclusion by expanding it to various conclusions about the same subject such as R & D performance and service quality. Keywords: Meta-analysis, Text mining, R-language, Consultant competency, Consultant attitude, Consulting performance
I. INTRODUCTION
There are a number of studies on consulting related to the
Revised Manuscript Received on January 03, 2019.
Sang-Moon Kim, Department of Knowledge Service and Consulting, Hansung University, 116, samseonyo 16gil, Seongbuk-gu, Seoul Metropolitan Government, 02876, Korea,
Yen-Yoo You, Corresponding author,Department of Division of Smart Management Engineering Consulting Track, Hansung University, 116, samseonyo 16gil, Seongbuk-gu, Seoul Metropolitan Government, 02876, Korea,
Chang-Won Lee, Department of Public Administration, Hansung University, 116, samseonyo 16gil, Seongbuk-gu, Seoul Metropolitan Government, 02876, Korea,
Jung-Wan Hong, Department of Industrial and Management Engineering, Hansung University, 116, samseonyo 16gil, Seongbuk-gu, Seoul Metropolitan Government, 02876, Korea,
effects of consultant and client characteristics on consulting understanding or consulting performance. The characteristics of consultants include consultant competency, consulting knowledge, and attitudes toward customers in conducting consulting. There are a number of studies on consulting related to the effects of consultant and client characteristics on consulting understanding or consulting performance. Consulting performance is largely measured by financial performance or nonfinancial performance. The same hypothesis, however, may lead to different conclusions depending on the study. Therefore, it is necessary to derive consistent results for the same hypothesis so that relevant research users can make reasonable decisions. Meta - analysis is used to generalize various conclusions on the same topic and a generalization of the results of a new situation by organizing and comparing the results of studies with different environments and different models for the same or similar research topic [1, 2]. Therefore, it is meaningful to summarize the existing research and presenting the direction of future research by analyzing the papers that examined the relationship between consultant capacity and consulting performance. Big data is used in a variety of fields including storage, collection, discovery, and analysis of large amounts of data, such as phenomena identification, future prediction, pattern analysis, and marketing [3]. Text mining, one of the data analysis techniques of Big Data, is a useful method to derive the implications of data by visualizing the relationship and influence relationships between concepts using statistical methods [4]. The purpose of this paper is to analyze the impact of consultants on consulting performance by meta-analysis and analyzing key keywords in English abstracts through text mining.
II. THEORETICAL BACKGROUNDS AND
METHODS
This section describes the theoretical background of text mining and meta-analysis. And data collection method, data analysis related to this paper.
2.1. Text Mining
2.1.1. Theoretical Backgrounds
Text mining is a research area that finds interesting and meaningful patterns and rules in unstructured text, usually through a series of text analysis and processing that extracts meaningful information for a
specific purpose [5,6].
The Effect of Consultant Competency on
Consulting Performance Using Text Mining and
Meta-Analysis
1
There are high frequency emergence words in one document group and most text mining techniques are based on the frequency of occurrence of these words. Text mining applies Zipf and Heap’s law. According to Zipf and Heap’s Law, if words are sorted in a natural corpus representation in order of their frequency of use, the frequency of use of all words is inversely proportional to the order of the word. Zipf and Heap’s law is expressed by the following equation.
(1)
Here, N: represents the number of elements, k: the rank of elements, s: the exponent value indicating the characteristics of the distribution [7]. The frequency can be calculated of use of elements with rank k among N elements
2.1.1. Methods
In this paper, text mining analysis was conducted on the concept of ‘consultant competency’ and ‘consulting performance’ among the papers registered in Research Information Sharing Service (RISS) from 2009 to 2018 doctoral dissertations [8]. The first 136 dissertations were searched, but the final 96 papers were selected as the articles to be analyzed, except for the papers which were not relevant to the consulting performance or not suitable for the analysis. The text crawls the English abstract in the paper. The analysis tool used R-language and used "LoNLP" and "wordcloud" packages. I also used the 'gsub' function to remove unnecessary words, symbols, and special characters. The refined data were analyzed and urbanized using 'KoNLP' and 'wordcloud' functions.
2.2. Meta-analysis
2.1.1. Theoretical Backgrounds
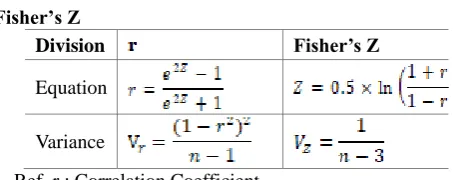
The meta-analysis tests the hypothesis using the effect size and the mean effect size of the whole study [9]. The effect size types are the standardized mean difference, the ratio of two groups, and the correlation coefficient. The mean effect size(summary effect) is the weighting of the effect size of each individual study to calculate the effect size of the entire study, i.e. the mean effect size. The effect size of each study has a confidence interval, which represents the statistical significance of the estimated effect size. If the confidence interval does not contain a value of '0', it is statistically significant. The shorter the confidence interval, the more accurate the estimated effect size [10]. In this paper, the correlation coefficient is used as the effect size and converts the correlation coefficient used in the study to Fisher's Z for the approximation of the normal distribution. The relationship between the correlation coefficient and Fisher's Z is shown in the following Table 1.
Table 1: Relation of Correlation coefficient and Fisher’s Z
Division Fisher’s Z
Equation
Variance
the random effect model, and the two methods differ in the precision of the mean effect size. Details of this model are shown in Table 2.
Table 2: Difference of Fixed effect model and Random effect model
Fixed Effect Model Random Effect Model • Population effect sizes of
all studies are the same (Population effect size homogeneity)
• All study population effect sizes are different.
(Population effect size heterogeneity)
• Estimate the effect of the same population, that is, one true effect (common effect)
• Estimate the average of effect size distributions of different populations • The difference in effect
sizes of each study is due to sampling error
• The effect sizes of each study are composed of sampling error and inter-study variance
The effect size derived from each individual study is different and this difference is called the heterogeneity of the effect size. Heterogeneity test uses Q statistic that follows
distribution, and , statistics. Q is the observed weighted sum of squares of each effect size (= actual variance + sample error variance). The degree of freedom of Q, df (= k-1, k is the number of studies included) is the expected variance, assuming that the effect sizes of the population are
all the same in each study. Q = df / (1- ) and (Q-df) is the
actual variance difference between studies. The statistic is classified as 'small size heterogeneity' at 25%, 'medium size heterogeneity' at 50%, and 'large size heterogeneity' at 75%.
Meta-analysis has a 'dissemination bias' or 'publication bias' in which individual studies do not represent the population of completed studies. Publication bias is positive and statistically significant results indicate bias that tends to be published more easily than studies that yield results that are not [11]. Publication bias check is mainly used with funnel plot. If there is no bias in the funnel plot, it looks symmetrical, but if it shows asymmetry, it shows that there is a bias in the data. Egger's regression test is used for the test for bilateral symmetry.
2.1.1. Methods
[image:2.595.304.554.111.255.2]The Meta - analysis extracted 96 papers from text mining using the results of consultant capacity and consulting performance. In this paper, 15 papers using the consultant competency and attitude capacity as independent variables were selected and analyzed. The number of research hypotheses finally selected is shown in Table 3.
Table 3. Hypothesis status used in Meta-analysis Independent
Variable
Number of Hypothesis
Accepted Hypothesis
Rejected Hypothesis
Capability 22 13(59.1%) 9(40.9%)
Attitude 22 12(54.5%) 10(45.5%)
Sum 44 25(56.8%) 19(43.2%)
[image:2.595.50.283.677.767.2]International Journal of Innovative Technology and Exploring Engineering (IJITEE) ISSN: 2278-3075,Volume-8 Issue-3C, January 2019 and ‘metacor’ and ‘forest plot’ functions in the R-language.
III. RESULTS AND DISCUSSION 3.1. Text Mining
[image:3.595.314.538.47.242.2]As a result of text mining using the English abstract of the paper, it was confirmed that the words 'consulting', 'performance', 'consultant', 'management', 'study', 'competency' Details are shown in Figure 1.
Figure 1. Top keywords visualization
Text mining can confirm that the papers to be analyzed contain texts related to consulting, consultant capabilities and consulting performance.
3.2. Meta-analysis
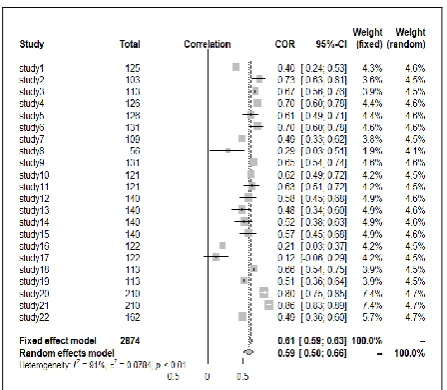
Meta - analysis was conducted by using correlation coefficient for hypothesis test results on the effect of consultant ability and attitude ability on consulting performance. Table 4 shows the forest test results on the impact of consultant competency on consulting performance. Table 4. Meta-analysis of consultant competency capability
Contents Judgment
HT Q=230.59, df=21, p-value(<0.001) Heterogeneity
HS =0.078, =90.9%[87.6%; 93.3%] Large heterogeneity size
ME S
COR (0.59)
[image:3.595.52.289.117.281.2] [image:3.595.311.541.306.501.2] [image:3.595.317.536.589.729.2]95%CI [0.5,0.7]
Z (10.7)
P (<0.01)
Random effects model
Ref. HT: Heterogeneity Test, HS: Heterogeneity Statistics, MES: Mean Effect Size, COR: Correlation Coefficient, CI: Confidence Interval, Z: Standard Normal Distribution Value
The null hypothesis that (Q-df) > 0 and the significance p is <0.001 and that each effect size is homogeneous is rejected as a result of the heterogeneity test. Therefore, the random effect model is applied to the mean effect size. The correlation coefficient of the random effect model is 0.59, which can be classified as a ‘large effect size’. According to Cohen, the correlation coefficient is classified as a small effect size of 0.1, a medium effect size of 0.3, and a large effect size of 0.5 [12]. The 95% confidence interval does not include '0', meaning that the significance of the effect size is significant and can be confirmed through the significance probability (p <0.001).
Figure 2. Forest plot of correlation coefficient r on consultant competency
Figure 2 shows the forest plot of correlation coefficient r for study on the effect of consultant competency on consulting performance.
Figure 3. Forest plot of Fisher's Z on consultant competency
Figure 3 shows the forest plot of Fisher's Z for study on the effect of consultant competency on consulting performance. Only individual studies17 show that the 95% confidence interval includes '0'. The effect size of the remaining studies is significant. That is, the same result can be obtained.
igure 4 is a funnel plot showing the relationship between sample size and effect size. In the funnel plot, it appears as if a large number of data appears on the right side of the center of the mean effect size on the left side, and it is doubtful to judge asymmetrically. According to the Egger's regression test for this asymmetry, the individual test can reject the symmetry in the null hypothesis funnel plot with a test statistic t = 36.613 (df = 20) with a p-value of 0.001.
[image:4.595.313.536.53.237.2]Next, let’s see the results of meta-analysis on the impact of consultant attitude on consulting performance. Table 5 shows the forest test results.
Table 5. Meta-analysis of consultant attitude capability
Contents Judgment
HT Q=120.45, df=21, p-value(<0.001) Heterogeneit y
HS =0.034, =82.6%[74.6%;
88.0%]
Large size heterogeneit y
MES COR
(0.53)
[image:4.595.44.297.210.319.2] [image:4.595.316.513.334.471.2] [image:4.595.60.282.482.650.2]95%CI [0.5,0.6]
Z (13.7)
P (<0.001)
Random effects model
Ref. HT: Heterogeneity Test, HS: Heterogeneity Statistics, MES: Mean Effect Size, COR: Correlation Coefficient, CI: Confidence Interval, Z: Standard Normal Distribution Value
The null hypothesis that (Q-df) > 0 and the significance p is <0.001 and that each effect size is homogeneous is rejected as a result of the heterogeneity test. Therefore, the random effect model is applied to the mean effect size. The correlation coefficient of the random effect model is 0.53, which can be classified as a ‘large effect size’. The 95% confidence interval does not include '0', meaning that the significance of the effect size is significant and can be confirmed through the significance probability (p <0.001).
Figure 5. Forest plot of correlation coefficient r on consultant attitude
Figure 5 shows the forest plot of correlation coefficient r for each study on the effect of consultant attitude on consulting performance.
Figure 6. Forest plot of Fisher's Z on consultant attitude
Figure 6 shows the forest plot Fisher's Z for each study on the effect of consultant attitude on consulting performance. The individual study 17 has 95% confidence interval includes '0' but the effect size of the remaining studies is significant. That is, the same result can be obtained.
Figure 7. Funnel plot for consultant attitude
Figure 7 is a funnel plot of the attitude of the consultant. Individual studies appear to have a small number of data on the left and a majority on the right, centered on the mean effect size. This means that there is an asymmetric publication bias. According to the Egger's regression test for asymmetry, individual studies in the funnel plot are not symmetry with a test statistic t = -1.8005, df = 20, and p-value 0.087 (> 0.05).In other words, the null hypothesis that there is no relationship between effect size and standard error accepted.
IV. CONCLUSION
International Journal of Innovative Technology and Exploring Engineering (IJITEE) ISSN: 2278-3075,Volume-8 Issue-3C, January 2019
Meta - analysis was conducted on 22 hypotheses concerning the impact of consultant competency and attitude on consulting performance in 15 papers. Keywords such as 'consulting', 'performance', 'consultant', 'management', 'study' and 'competency' were extracted from the text mining results. Through this, the papers to be analyzed are using the consulting, consultant and consulting as keywords and these keywords are visualized. The Meta - analysis used the correlation coefficient to calculate the effect size. As a result of the heterogeneity test for individual hypotheses, it was confirmed to be heterogeneous, and a random effect model was applied. The mean effect size was significant, and it can be concluded that 'consultant competency is significant to consulting performance'. In the ‘Publication bias test’, it was confirmed that there was no publication bias in the consultant competency but the publication bias in the consultant attitude. In the future, text mining needs to clarify the relation of key words through various analyses such as visual analysis and related word analysis. In addition, it is expected that if the scope of the research is extended by including the theses in the academic journals other than theses, another meaningful result will be obtained.
ACKNOWLEDGMENT
This research was financially supported by Hansung University.
REFERENCES
1. Ahn S, Ames AJ, Myers ND, et al. A Review of Meta-Analyses in Education: Methodological Strengths and Weaknesses. Review of Educational Research.2012 Dec.;82(4); 436-76.
2. Farley JU, Lehmann DR. Meta-analysis in marketing: Generalization of response models. Lexington, MA: Lexington Books; 1986.p. 10-30. 3. Xindong W, Xingguan Z, Gong-Qing W, Wei D, et al. Data mining with
big data. Institute of Electrical and Electronics Engineers.2014;26(1);97-107.
4. Xiang Z, Schwartz Z, Gerdes JH, Uysal M. What can big data and text analytics tell us about hotel guest experience and satisfaction?International Journal of Hospitality Management. 2015;44:120-30.
5. Hearst MA. Untangling Text Data Mining. Association for Computational Linguistics. Annual Meeting Conference Proceedings. 1999;37;3-10.
6. Sheeran P, Abraham C, Orbell S. Psychosocial Correlates of Heterosexual Condom Use: A Meta-Analysis.1999 Jan;125(1); 90-132. 7. ManningCD, Shutze H, Foundations of statistical natural language
processing. Cambridge MA; The MIT press; 1999, p. 680.
8. Research Information Sharing Service RISS(2018),
http://www.riss.kr/search/Search.do?detail
Search=false&searchGubun=true&oldQuery=&query=%EC%BB%A8
%EC%84%A4%ED %84%B4%ED%8A%B8
+%EC%97%AD%EB%9F%89&x=0&y=0 (website)
9. Choi GH, Gook SJ. Meta-Analyses using MIX. Seoul KOR; Freedom Academy; 2008. p. 15-55.
10. Borenstein M, Hedges LV, Higgins JP, Rothstein HR. Introduction to Meta-Analysis. Chichester, UK; Wiley; 2009.
11. Higgins J, Green S. Cochrane Handbook for Systematic Reviews of Interventions Version 5.1.0.,The Cochrane Collaboration. Retrieved from http://handbook.cochrane.org. Eds. 2011.