International Journal of Innovative Technology and Exploring Engineering (IJITEE) ISSN: 2278-3075, Volume-8 Issue-9, July 2019
Abstract: Technology has shrunk the global markets and information is accessible very quickly and effortlessly. Business organizations world over concentrate on their production systems to improve the quality of the end product, well distribute the product and optimize cost of resources. Transportation cost, inventory carrying cost and shortage costs constitute the major costs in cost of distribution. A competent supply chain always strives to manufacture the right quantity of end products and hold a minimum inventory across the entire supply chain. In thecurrent paper, a five echelon supply chain model is developed and it is optimized using particle swarm intelligence algorithm.
Index Terms: Particle swarm intelligence algorithm, Supply chain management.
I. INTRODUCTION
Evolution of internet technologies has shrunk the world and info is open and accessible very easily. Business
organizations (BO) globally are experiencing stiff
competition within an industry. Companies are drifting from customer satisfaction to customer delight by enhancing product quality and incorporating unique customizable product features. Cost of raw material, labor, power and other manufacturing inputs are rather open, so BOs concentrate on process improvement to optimize resource utilization and its associated cost. Cost of distribution (COD) usually ranges from 2.9 % to 8.9% of sales value, which majorly includes transportation of raw material, components, work-in-progress and finished goods, carrying cost of excess inventory in the supply chain (SC) and shortage cost [1]. In recent years, countries world over are emphasizing on industries and society to adopt technology that yield green manufacturing systems. Sustainability of green technology is so much wrapped around financials of an individual BO, which again points towards efficient utilization of resources. Inventory is a current asset figuring in the balance sheet; inventory helps improve business volume and bottom line of BO, but all this when maintained at optimal levels. High inventory levels among members of SC erodes the profit as interest on locked up capital, opportunity of capital not being able to use elsewhere, maintenance of inventory, and other related costs [2]. Whereas a low inventory, results in shortage of product to sales, dent in the goodwill or brand image, perception of
Revised Manuscript Received on July 06, 2019.
V. R. Sathish Kumar, Dept. of Mechanical Engineering, Amrita School of Engineering, Coimbatore, Amrita Vishwa Vidyapeetham, India.
S. P. Anbuudayasankar, Dept. of Mechanical Engineering, Amrita
School of Engineering, Coimbatore, Amrita Vishwa Vidyapeetham, India.
customer towards the retailer and brand and the like. Optimal inventory calls for a very well-established communication among members of SC. Transportation cost account for 71% of COD apart from impacting the environment. Industry and researchers are continuously working towards developing models to minimize the emission from fossil fuel used by transportation sector [3]. This paper aims developing a model that strikes a balance among transportation cost (TC), inventory carrying cost (CC) and shortage cost (ShC) by employing vehicles of varying capacity to manage optimal inventory in the SC.
II. LITERATURE SURVEY
Swift changes in environment, technology and market has warranted BO to maximize the performance of all the member of SC rather than an individual member. To mitigate this situation, SC members ought to establish strong long term relationship to leverage information and resources. Which results in minimizing and sharing risks [4], reduce product development cost, reduce logistics cost, improve productivity, reduce inventory across SC, access scarce resources, improve quality and lot more. Internet based information and communication technology has helped to share real time info among members of SC to optimally use the resources and value creation [5]. SC policy is very crucial for success of any BO. Well defined SC objective(s) ought to lead the SC approach, which forms the fundamental driver of tactical decision making and align all individual goals to the organizations’ [6]. Strategic decision must be imbibed into the SC right in the initial stage, with both internal and external customer satisfaction as the core objective [7]. Cost of distribution (COD) and time to supply are most frequently used performance evaluation metrics of a SC model [8]. COD is the collection of transportation cost, inventory carrying cost and shortage cost. Primary objective of any SC is minimization of all associated costs; which is the result of low or optimal inventory level retained through all echelons [9]. Optimal or minimum inventory ease costs and surfaces out any hidden problems at very early period of time. SC develops a clear understanding and helps serve better the dynamic changing requirements and demands of customer [10]. SC members ougth to be more swift and reliable to satisfy end user demands which is usually at the lowest echelon. This will warrant an
open and transparent intra and
inter departmental
Optimization of A Five-Echelon Supply Chain
Network using Particle Swarm Intelligence
Algorithms
communication. [1]. Just-in-time production system adopted by many companies is a remarkable illustration of reliable SC which helped reduce the CC. TC at initial stages would seem high, to maintain a low inventory levels across all echelons but is justifiable with the benefits and would continuously optimize in long term [11]. In current scenario, industries are using the resources optimally for cost computation and enhancing its profit margins. [12]. Researchers working on resource optimization deploy various evolutionary algorithms that mimic nature. Particle swarm intelligence optimization (PSO) is an evolutionary algorithm developed by Eberhart and Kennedy in 1995 that mimics the behavior of swarm of birds or school of fish. Sathish Kumar et al. (2018) developed a three echelon SCM using goal programming and used PSO to optimize the resources [14]. PSO explores and exploits the solution space thoroughly very efficiently that it is usually employed to solve problems of complex nature [13]. PSO works on its own cognitive behavior and shared social behavior of swarm.
III. PROBLEM DEFINITION AND SC MODEL Advent of internet technology has made the costing of products more transparent. Rich information available to customer has made them rational in their decisions and is not willing to pay more. Costing is one major area that companies often try breaking their own benchmark. Current study consists of a five echelon SC model consisting of component or assembly or sub-assembly supplier, end product manufacturing plant, warehouse, distributor and retailer. Transportation of components, assemblies, sub-assemblies and end product between the members of SC is facilitated by a third party logistic service provider (3PLSP). 3PLSP maintains three types of vehicles with varying capacities in terms of consignment load. Cost reduction can be achieved by matching the vehicle capacity with the consignment load and cancelling trips with consignment loads less than 75% capacity of vehicle. Excess inventory attracts holding or carrying cost and cost of capital, but holding fewer inventories runs the risk of stock-out situation and its related cost. This model handles varied demand scenarios and in each scenario, it optimizes these costs.
IV. OPTIMIZATION OF MULTI-OBJECTIVE FIVE ECHELON SC ARCHITECTURE USING PSO
ALGORITHMS
A. Intro to PSO algorithm
Particle swarm optimization (PSO) is an evolutionary algorithm mimicking school of fish randomly searching for food. PSO is initialized with a random number of particles to
search the entire solution space. First part in the equation 1,is
the product of velocity of
n
th particle and inertia weight ofthe same particle. A large inertia weight ensures particles to widely explore the solution space and a smaller one confines the particle to a local solution space. Second part of the same
equation, represents the cognitive part, which orients the
n
thparticle towards the best previous position it had held in earlier iterations. Third component represents the social part,
where the particle
n
orients towards the best previouspositions held by any of the particle of the swarm in the earlier iterations. Constants C1 and C2 are the learning factors and can take a maximum value of 2. In the initial iterations, learning factors of both cognitive and social component are maintained at lower levels because it would not have explored
the solution space enough to identify
P
best andG
best.B. Linearly decreasing inertia weight particle swarm optimization algorithm equations (LDIW-PSO)
1
)]
(
[
)]
(
[
2 2
1 1 1
n best
n best n
n n
X
G
r
C
X
P
r
C
v
v
2
*
max min max
max
iter
iter
3
1
1
n
nn
X
v
X
C. Global – local best inertia weight particle swarm optimization algorithm equations (GLBIW-PSO)
)
4
(
)]
(
[
)]
(
[
2 2
1 1 1
n best
n best n
n n
X
G
r
C
X
P
r
C
v
v
)
5
(
1
.
1
best best
P
G
6
1
1
n
nn
X
v
X
D. Mathematical Model
p s c
X
,, Quantity of component ' c' supplied by supplier 's' to plant ' p'
s v
Rn
, Rent for vehicle'
v
'
used to transport parts fromsupplier
'
s
'
e
TOQ
Total order quantity of end product'
e
'
o e
CO
, Confirmed order of end product'
e
'
by OEM'
'
o
e
FD
Forecasted demand of end product'
e
'
p e
Dem
, Demand of end product'
e
'
from plant ' p'p e
Cap
, Capacity of plant ' p' to manufacture end product'
'
e
c
Wt
Weight of a unit of component ' c's v
V
, Vehicle'
v
'
used to transport components fromsupplier
'
s
'
s v
B
, Boolean variable if vehicle of type'
v
'
is used toInternational Journal of Innovative Technology and Exploring Engineering (IJITEE) ISSN: 2278-3075, Volume-8 Issue-9, July 2019
s v
LP
, Load penalty for vehicle of type'
v
'
is used totransport components from supplier
'
s
'
w p e
Y
, , Quantity of end product'
e
'
supplied from plant 'p' to warehouse
'
w
'
re
Inv
, Inventory of end product'
e
'
held with retailer'
'
r
p e
Cc
, Carrying cost per unit of end product'
e
'
in plant'
'
p
per time periodw e
Sh
, Shortage cost per unit of end product'
e
'
inwarehouse
'
w
'
s c
Q
, Quantity of excess inventory of component'
c
'
held with supplier
'
s
'
p e
Cap
, Capacity of plant'
p
'
to manufacture endproduct
'
e
'
,
,
(
,
)
7
),
,
(
),
,
(
, , , , , , , , , , , ,di
v
w
v
p
v
s
v
B
LP
Rn
B
LP
Rn
B
LP
Rn
B
LP
Rn
Z
Min
di v di v di v p v w v w v p v p v p v s v s v s v R
8
, , , , , , , , , , , ,
r e r e r e w e w e w e p e p e p e s c s c s c CCc
Q
Cc
Q
Cc
Q
Cc
Q
Z
Min
r e r e r e w e w e w e w e w e w e p e p e p e s c s c s c ShSh
Q
Sh
Q
Sh
Q
Sh
Q
Sh
Q
Z
Min
, , , , , , , , , , , , , , ,9
10
,FD
e
CO
TOQ
o e o ee
11
,
, ,
,
TOQ
e
p
Cap
Cap
Dem
e p p e p e pe
12
,Cap
p
Cap
pe
p
e
13
,
TOQ
e
Dem
ep
p
e
14
,
,
TOQ
c
e
N
TOQ
c
ce e
15
,,
,
TOQ
c
Cap
Cap
Dem
c s s c s c sc
16
,
TOQ
c
Dem
cs
s
c
17
,Cap
s
Cap
sc
s
c
18
,
, ,
,
Dem
c
s
X
csp p s
c
19
,
)
(
,, ,,
X
Wt
V
v
s
L
c vsp c
p s c s
v
20
,
)
%
80
min(
1
, ,,
if
L
of
V
v
s
B
vs
vs
vs
21
,
)
%
80
min(
0
, ,,
if
L
of
V
v
s
B
vs
vs
vs
22
,
)
(
, , ,,
v
s
V
LPC
B
L
LP
s v s v s v sv
23
,
, , , , , ,s
c
X
Inv
Cap
U
Q
cs sc sc cs csp
24
,
)
(
, , ,,
Y
Wt
V
v
p
L
e vpw e
w p e p
v
25
,
)
%
80
min(
1
, ,,
p
v
V
of
L
if
B
vp vs vp
26
,
)
%
80
min(
0
, ,,
p
v
V
of
L
if
B
vp vp vp
27
,
)
(
, , ,,
v
p
V
LPC
B
L
LP
p v p v p v pv
28
,
, , , , , ,p
e
Y
Inv
Cap
U
Q
ep pe pe ep epw
29
,
)
(
, , ,,
Y
Wt
V
v
w
L
e vww e
d w e w
30
,
)
%
80
min(
1
, ,,
w
v
V
of
L
if
B
vw vw vp
31
,
)
%
80
min(
0
, ,,
w
v
V
of
L
if
B
vw vw vp
32
,
)
(
, , ,,
v
w
V
LPC
B
L
LP
w v w v w v wv
33
,
, , , , , ,w
e
Cap
Inv
Y
Y
ew ewp d d w e w p e
34
,
, , , , , , , ,w
e
Y
Inv
Y
Y
Q
ew epwp d d w e w p e w e
35
,
)
(
, , ,,
Y
Wt
V
v
di
L
e vdid e
r di e di
v
36
,
)
%
80
min(
1
, ,,
di
v
V
of
L
if
B
vdi vdi vdi
37
,
)
%
80
min(
0
, ,,
di
v
V
of
L
if
B
vdi vdi vdi
38
,
)
(
, , ,,
v
di
V
LPC
B
L
LP
di v di v di v div
39
,
, , , , , ,w
e
Cap
Inv
Y
Y
ew ewp d d w e w p e
40
,
, , , , , , , ,w
e
Y
Inv
Y
Y
Q
ew epwp d d w e w p e w e
41
,
, ,
, ,
,
Y
Sal
Cap
e
r
Inv
er erp r di e r
e
42
,
, , , , ,,
Inv
Y
Sal
Cap
e
r
Q
er
er
edir
er
er
Equations (7) strive to minimize the transportation cost by imposing a penalty whenever a trip is underutilized. Equation (8) and (9) minimizes the inventory carrying cost and shortage cost respectively. Equations (10) to (18) ensure the demand of end product is distributed among the plants based on their capacities. Load penalty for underutilized trips are computed in equation (19) till (22). Excess inventory among suppliers are computed in equation (23). Load penalty for underutilized trips from plants to warehouse is computed in equations (24) to (27). Inventory at plants is computed at the warehouse through equation (28). Type of vehicle selection based on capacity of vehicle and weight of consignment to be transported from warehouse, is done through equations (29) to (32). End product inventory at warehouse is ascertained through equations (33) and (34). Equations (35) till (38) compute the load penalty for underutilized trips from distributor to retailer. Equation (39) and (41) ensures quantity of end products are within the capacities of the warehouse and distributor. Equations (40) and (42) compute the inventory levels at warehouses and distributors.
V. RESULTS AND DISCUSSIONS
International Journal of Innovative Technology and Exploring Engineering (IJITEE) ISSN: 2278-3075, Volume-8 Issue-9, July 2019
T
a
ble 1
P
er
fo
rma
nce
o
f
P
SO
a
lg
o
rit
hm
us
ing
L
DIW inert
ia
weig
ht
Wo
rst
COD
1830483 1800878 1872333 1843561 1666138 1821876 1748634 1720175 1876534 2003194 1936269 1800120 2020909 1849114 2024303 1962868 1692975 1992068 1819458 1707633
Be
st
COD
1543119 1539271 1725410 1637152 1586971 1686685 1555374 1479264 1625544 1584726 1626355 1468381 1589946 1431311 1581209 1578233 1598472 1611795 1604356 1502535
S
h
C
SD 328 247 324 273 236 309 276 284 331 354 308 301 257 239 241 330 319 263 262 411
S
h
C
M
ea
n
1674
0
15932 15716 17559 16992 17872 16481 15866 17875 16830 15546 15539 17289 16736 15885 17583 16132 16241 17142 18201
S
h
C
Wo
rst
17621 16771 16543 18102 17518 18617 17168 16701 18620 17904 16538 16531 18199 17433 16376 18316 16631 16743 17856 18764
S
h
C
Be
st
14636 14223 14186 16748 14215 14329 14681 16316 14216 15449 13861 16092 15224 15438 16001 14446 15865 15464 13331 16165
CC SD 7561 6508 6733 6834 7371 8711 6740 6813 7037 6122 5650 6450 8009 6120 8594 8004 7594 6733 6627 5922
CC Mea
n
246942 218473 216979 278046 254441 273430 238015 237716 224941 245210 212332 281694 264147 205451 291566 257747 254674 233240 210662 197406
CC
Wo
rst
254579 232418 223690 289631 262310 287821 250542 245068 236780 255427 223507 290406 281007 216264 306912 271313 262551 240454 219440 203511
CC Best
167201 187550 178587 240536 251698 282856 217545 224981 233504 250458 199791 243204 182797 208554 197013 258137 246473 224282 201168 192395
TC SD
41762 40499 48637 43925 39371 40311 42651 40690 41015 47917 42834 412
12
43903 47655 54432 46683 38879 49097 45092 47234
TC Mea
n
1511535 1489621 1534174 1443678 1316995 1439666 1392069 1385486 1556289 1677967 1645337 1433456 1652835 1518492 1649985 1572845 1357241 1648127 1518876 1440797
TC
Wo
rst
1558283 1551689 1632100 1535828 1386310 1515438 1480924 1458406 1621134 1729863 1696224 1493183 1721703 1615417 1701015 1673239 1413793 1734871 1582162 1485358
TC Best
1361282 1337498 1532637 1379868 1321058 1389500 1323148 1237967 1377824 1318819 1412703 1209085 1391925 120731
9
1368195 1305650 1336134 1372049 1389857 1293975
DS
1 2 3 4 5 6 7 8 9
[image:5.595.65.505.45.637.2]T
a
ble 2
P
er
fo
rma
nce
o
f
P
SO
a
lg
o
rit
hm
us
ing
G
L
B
IW
inert
ia
weig
ht
Wo
rst
COD
1602074 1609492 1464675 1606743 1613506 1631142 1397226 1583
772
166885
6
1511879 1466464 1396482 1710344 1743354 1680347 1605800 1767555 1531509 1649462 1526151
Be
st
COD
1154448 1294443 1313723 1318458 1446547 1407495 1354276 1304687 1334891 1197392 1387402 1304002 1255377 1314315 1413493 1241547 1209347 1438146 1175687 138
5690
S
h
C
SD 244 317 390 360 348 218 200 341 279 253 189 370 208 326 348 334 296 341 312 288
S
h
C
M
ea
n
16436 16006 17616 15736 17413 13719 13928 17253 17378 13630 13678 17564 13127 17973 17834 17504 16670 18060 15677 15002
S
h
C
Wo
rst
16602 168
48
18161 16740 18329 14291 14212 18161 17915 13908 13816 18296 13674 18340 18198 18045 17186 18429 16678 15466
S
h
C
Be
st
10670 16771 10130 13719 13380 13963 13825 13184 16620 11273 13724 12469 13644 10383 10144 13712 14647 13437 10425 13545
CC SD 4105 4094 2758 2876 3347 4273 4461 2757 4943 2766 4377 4607 4298 4914 4678 2910 3551 4695 2805 4822
CC Mea
n
133119 147309 108745 203168 153099 145971 146114 135010 211468 131122 207990 161906 149298 199567 160860 127613 213208 144826 105690 150183
CC
Wo
rst
1
38666
1550
62
115686 216136 156223 152053 155440 143628 222598 139492 214423 166913 150806 203640 164143 134329 215362 152448 112436 158087
CC Best
134613 111458 110907 210251 137522 121822 138861 130838 143289 93969 150026 157352 103359 185975 114032 101
619
169890 120256 98227 147007
TC SD 43549 39102 33537 39980 43888 42772 38178 39531 36423 35049 39499 34764 46067 48380 41944 43603 40831 38701 38769 35844
TC Mea
n
1417870 1408830 1317520 1360128 1395785 1450150 1153920 1393543 1399776 1344894 1163932 1187048 1453112 1475733 1453066 1438892 1473607 1347026 1474738 1271442
TC
Wo
rst
1446806 1437582 1330828 1373867 1438954 1464798 1227574 1421983 1428343 1358479 1238225 1211273 1545864 1521374 1498006 1453426 1535007 1360632 1520348 1352598
TC Best
10
09165
1166
214
1192686 1094488 1295645 1271710 1201590 1160665 1174982 1092150 1223652 1134181 1138374 1117957 1289317 1126216 1024810 1304453 1067035 1225138
International Journal of Innovative Technology and Exploring Engineering (IJITEE) ISSN: 2278-3075, Volume-8 Issue-9, July 2019
T
a
ble 3
P
er
fo
rma
nce
ev
a
lua
tiv
e
o
f
fiv
e
e
chelo
n SC
y
ielded by
t
wo
v
a
ria
nts o
f
P
SO
P
er
fo
rman
ce
e
v
al
u
at
iv
e
b
ased
o
n
R
el
at
iv
e
%
in
cr
ea
se
G
LB
IW
0 0 0 0 0 0 0 0 0 0 0 0 0 0 0 0
4
.6
3 0 0 0
LD
IW 13
.2
6
9
.6
6
2
2
.3
7
1
0
.1
5
1
.4
1
7
.5
2
2
5
.3
1
6
.0
3
1
0
.4
7
3
0
.2
3
3
5
.1
9
2
6
.6
5
1
9
.7
3
2
.8
0
1
9
.9
6
1
6
.6
8 0
25
.6
8
9
.4
3
1
5
.3
0
O
n
mea
n
o
f
C
O
D
G
LB
IW
1567425 1572145 1443881 1579032 1566296 1609840 1313961 1545807 1628622 1489647 1385600 1366517 1615537 1693273 1631760 1584008 1703486 1509912 1596105 1436627
LD
IW
1775216 1724027 1766869 1739283 1588428 1730968 1646565 16
39068
1799105 1940007 1873215 1730689 1934271 1740678 1957436 1848175 1628048 1897609 1746680 1656404
P
er
fo
rman
ce
e
v
al
u
at
iv
e
b
ased
o
n
R
el
at
iv
e
%
in
cr
ea
se
G
LB
IW
0 0 0 0 0 0 0 0 0 0 0 0 0 0 0 0 0 0 0 0
LD
IW
3
3
.6
7
1
8
.9
1
3
1
.3
4
2
4
.1
7
9
.7
1
19
.8
4
1
4
.8
5
1
3
.3
8
2
1
.7
7
3
2
.3
5
1
7
.2
2
1
2
.6
1
2
6
.6
5
8
.9
0
1
1
.8
7
2
7
.1
2
3
2
.1
8
1
2
.0
7
3
6
.4
6
8
.4
3
O
n
b
est
o
f
C
O
D
G
LB
IW
1154448 1294443 1313723 1318458 1446547 1407495 1354276 1304687 1334891 1197392 1387402 1304002 1255377 1314315 1413493 1241547 1209347 1438146 11
75687
1385
690
LD
IW
1543119 1539271 1725410 1637152 1586971 1686685 1555374 1479264 1625544 1584726 1626355 1468381 1589946 1431311 1581209 1578233 1598472 1611795 1604356 1502535
DS
[image:7.595.58.528.51.411.2]1 2 3 4 5 6 7 8 9 10 11 12 13 14 15 16 17 18 19 20
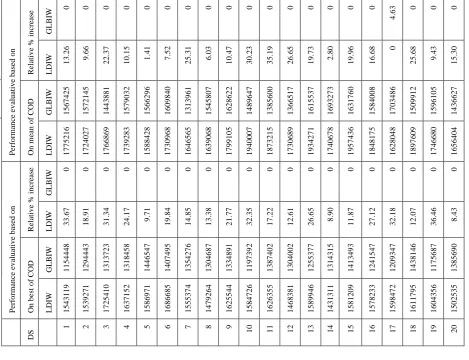
Fig. 1 Visualization of Pareto front of SC Model
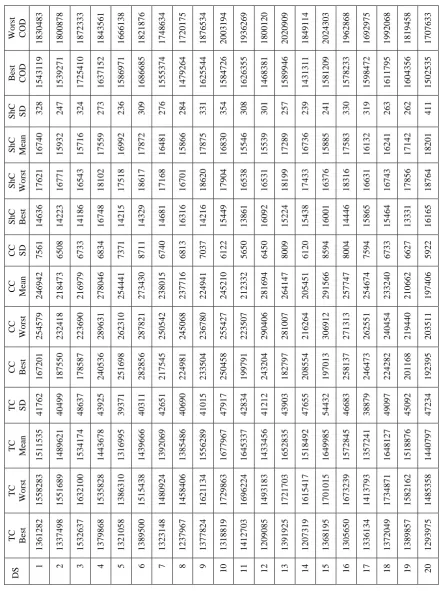
[image:7.595.315.557.434.559.2]respective best, worst, mean and standard deviation of TC, CC and ShC are recorded in table 1 and 2. Performance evaluation of the solutions obtained using LDIW and GLBIW are recorded in table 3. It is observed that GLBIW variant of PSO algorithm produced more optimal result for individual best solution and also for the mean of ten iterations. Inertia weight computed using GLBIW PSO variant orients each particle of the swarm towards the global best positions it has had till the previous iterations.
Fig. 2 Visualization of convergence of fitness function
If the SC model is scalarized, all the conflicting individual objectives are represented as a single objective yielding only a single point in the pareto optimal front. The pareto optimal front of a replication of a demand scenario is depicted in Fig.1, which offers a set of non-dominated solutions of the SC model. The extreme low points in the solution space are called the utopia points. These utopia points represent the optimal minimum value of TC, CC and ShC. A pareto-optimal front helps to visualize the optimal trade-off between objectives to a problem and helps concentrate a particular region in the solution space. Fig. 2 depicts the visualization of COD in each iteration and it could be observed the cost moves drastically at faster pace in the
initial iterations and slowly
[image:7.595.48.289.434.562.2]VI. CONCLUSIONS
A five echelon SC model was developed to handle three objectives that minimize TC, CC and ShC. LDIW and GLBIW variants of PSO algorithm is used to compute the inertia weight that optimize the SC problem. Twenty demand scenarios were developed and optimized using LDIW and the same set of demand scenarios were handled by GLBIW variant of PSO algorithm. Each demand scenario is replicated ten times and the best of TC, CC and ShC were recorded along with the mean and standard deviation. A non-dominating pareto optimal front for an iteration of a demand scenario is presented to visualize the trade-off among possible solutions. GBLIW PSO variant produced the optimal results as the inertia weight influenced to include the solutions that are closer to globally best.
REFERENCES
1. H. Jahani, B. Abbasi, F. Alavifard, and S. Talluri, “Supply chain network redesign with demand and price uncertainty,” Int. J. Prod. Econ., vol. 205, no. September 2017, pp. 287–312, 2018.
2. S. M. Mousavi, P. M. Pardalos, S. T. A. Niaki, A. Fügenschuh, and M. Fathi, “Solving a continuous periodic review inventory-location allocation problem in vendor-buyer supply chain under uncertainty,”
Comput. Ind. Eng., vol. 128, no. November 2018, pp. 541–552, 2019. 3. G. Fancello, A. Schintu, and P. Serra, “An experimental analysis of
Mediterranean supply chains through the use of cost KPIs,” Transp. Res. Procedia, vol. 30, pp. 137–146, 2018.
4. R. Sreedevi and H. Saranga, “Uncertainty and supply chain risk: The moderating role of supply chain flexibility in risk mitigation,” Int. J. Prod. Econ., vol. 193, no. July 2015, pp. 332–342, 2017.
5. H. Tran, S. Cahoon, and S.-L. Chen, “A Quality Management Framework for Seaports in their Supply Chains in the 21st Century,”
Asian J. Shipp. Logist., vol. 27, no. 3, pp. 363–386, Dec. 2011. 6. A. Jadhav, S. Orr, and M. Malik, “The role of supply chain orientation in
achieving supply chain sustainability,” Int. J. Prod. Econ., no. July, pp. 0–1, 2018.
7. R. Al-Aomar and M. Hussain, “An assessment of adopting lean techniques in the construct of hotel supply chain,” Tour. Manag., vol. 69, no. December 2015, pp. 553–565, 2018.
8. L. E. Duijzer, W. van Jaarsveld, and R. Dekker, “Literature review: The vaccine supply chain,” Eur. J. Oper. Res., vol. 268, no. 1, pp. 174–192, 2018.
9. Z. Qu, H. Raff, and N. Schmitt, “Incentives through inventory control in supply chains,” Int. J. Ind. Organ., vol. 59, pp. 486–513, 2018. 10. J. Van Engeland, J. Beliën, L. De Boeck, and S. De Jaeger, “Literature
review: Strategic network optimization models in waste reverse supply chains,” Omega (United Kingdom), no. xxxx, 2018.
11. K. Gumasta, F. T. S. Chan, and M. K. Tiwari, “An incorporated inventory transport system with two types of customers for multiple perishable goods,” Int. J. Prod. Econ., vol. 139, no. 2, pp. 678–686, Oct. 2012.
12. M. G. Avci and H. Selim, “A multi-objective simulation-based optimization approach for inventory replenishment problem with premium freights in convergent supply chains,” Omega (United Kingdom), vol. 80, pp. 153–165, 2018.
13. Kadadevaramath, J. C. H. Chen, B. Latha Shankar, and K. Rameshkumar, Application of particle swarm intelligence algorithms in supply chain network architecture optimization, Expert Syst. Appl., Vol. 39, No. 11, 2012.