International Journal of Innovative Technology and Exploring Engineering (IJITEE) ISSN: 2278-3075, Volume-8, Issue-11S, September 2019
Abstract: Cyber-crimes are prevailing at the extreme in the today’s technical world as the massive usage of the internet is on the peak among the world users, raising the security and privacy concerns. Thus, the paper concentrates on the intrusion detection mechanism in the networks, which is performed using the optimization-based deep belief neural networks (DBN). Input data is classified using the DBN classifier and the complexity associated with the classification is relieved through the feature selection strategy for which the Bhattacharya distance is employed. The DBN training is performed using Levenberg–Marquardt (LM) algorithm and Bird Swarm Algorithm (BSA), which is decided based on the minimal mean square error. The intrusion detection affords the security and privacy to the data. The analysis of the methods is presented using the KDD cup dataset and the comparative analysis is performed based on the accuracy, sensitivity, and specificity. The accuracy, sensitivity, and specificity of the BSA-DBN approach of intrusion detection are found to be 96.45%, 94.07%, and 96%, respectively.
Keywords: Intrusion Detection,Neural networks, Deep Belief network, Bhattacharya Distance.
I. INTRODUCTION
Internet is a crucial part of major people world-wide as they utilize World Wide Web (WWW) to greater extent. Internet is employed all over the world for multiple applications, like utilizing the social media, transactions in currency, exchange of the personal information and in addition, to store the private data that includes the personal media, password, banking information including the credentials of the credit card.
There is vast advancement in WWW starting from the list of sites corresponding to the markup language and ending with access to any place, which involves the remote actions in a network from every nook and corner of the world that is very easy too. On the other hand, the growth of WWW has increased the network crimes over the past few years according to a survey and this has led to the personal privacy theft. Hence, it is essential to establish an efficient method for network based intrusion detection to tackle against various attacks [5].
Revised Manuscript Received on September 22, 2019.
Shijoe Jose, Department of Computer Science and Engineering, SRM Institute of Science and Technology, Kattankulathur, Chennai, India.Email:[email protected]
D. Malathi, Department of Computer Science and Engineering, SRM Institute of Science and Technology, Kattankulathur, Chennai, India.Email: [email protected]
Dorathi Jayaseeli, Department of Computer Science and Engineering, SRM Institute of Science and Technology, Kattankulathur, Chennai, India.Email: [email protected]
Intrusion detection aims at detecting the external intrusions and engages in supervising the unauthorized behaviors of internal entities through the identification of the malicious activities while communicating in the network and while using the computer. Intrusion detection detects the intrusions through learning the characteristics of intruders and their behavior, thereby ensuring the real-time reply to intrusion scenarios and the invasion strategy. Anomaly Detection and Misuse Detection [13] [2] are two basic technologies in intrusion detection. There are two common methods in IDS, such as host-based and network-based IDS [14] [6]. An IDS [1] is a classification strategy that finds the normality and abnormality of the data. An ID is the development of data model and the common methods comprises of data mining, neural networks and so on. However, these methods require analysis of large data sets that are time-consuming. On the other hand, while executing IDS, the required data is very varied, small and is with large dimension that could not satisfy the requirements of normal statistic algorithms [15]. Support Vector Machine (SVM) is employed as a general learning algorithm and is excellent in solving the issues corresponding to the small sample, high dimension, and so on[7]. Anomaly based detection method is better to detect the new threats [16].In anomaly method, user profile can be created and variation from the profile can be treated as the possible threat[17].IDS is effectively used not only in normal network setup but also in cloud setup[18]. With the challenges of the traditional methods, the research concentrates on the intrusion detection strategy for which the deep belief neural network (DBN) is employed. The data is initially pre-processed and the processed data is subjected to the feature selection strategy using the Bhattacharya distance. The significance of using Bhattacharya distance is to select the highly required features for classification that relieves the complexity associated with the classification. The classification based on the DBN is initiated and progressed using the weights determined using the BSA-based DBN. The major challenge of the research is:
Proposed BSA-DBN for intrusion detection: The intrusion detection is performed using the DBN classifier, which is the trained using the BSA optimization and LM algorithm that is based on the minimal value of the error.
The organization of the paper is: Section 2 deals with the literature review of the research and section 3 demonstrates the proposed method of intrusion detection. The results and discussion of the proposed method of intrusion detection is highlighted in section 4. Finally, section 5 concludes the paper.
Improved Intrusion Detection System with
Optimization Enabled Deep Neural Networks
II. MOTIVATION
In this section, the review of the existing methods along with the scope of the research is demonstrated. The review of the methods is given as: Yunchuan Guo et al. [1] developed a method for intrusion detection that rendered an optimal solution regarding the involvement of the nodes in the intrusion detection. The efficiency of the methods was revealed, but failed to consider the nodes with varied attributes and reputation scores. Xiujuan Wang et al. [2] used the hybrid learning approach using the features, like Density, Cluster centers, and Nearest Neighbors (DCNN). For classification, KNN was used that enhanced the classification accuracy, but the accuracy could be affected with any variation in the cluster size. Hamidreza Sadreazami et al. [3] developed a blind detection framework using the measures from the sensor and statistical properties of the data. The detection performance was good and enabled the detection of any kind of anomalies. However, the detection of anomalies was time- oriented. Hichem Sedjelmaci et al. [4] performed the intrusion detection using the Bayesian model, which rendered higher detection performance and rendered minimal overhead. The drawback of the method was regarding the energy consumption in the network.
The review of the existing methods enables us to conclude the challenges of the research:
• The first challenge is regarding the effective classifier for the detection of the intrusion in the network. In [6], the intrusion detection was based on the ellipsoid- based approach that employed the pseudo-based approach that enabled the effective anomaly detection. However, the question was regarding the selection of the optimal ellipsoid, which required some advanced classifiers and learning methods.
• The detection rate of the intrusion is yet another challenge [1], which is degraded because of the privacy leakages. In [2], the density calculation was not found to be accurate and the classification accuracy was poor.
III. INTRUSIONDETECTIONBASEDONTHE
OPTIMIZATION-BASEDDEEPNEURALNETWORK
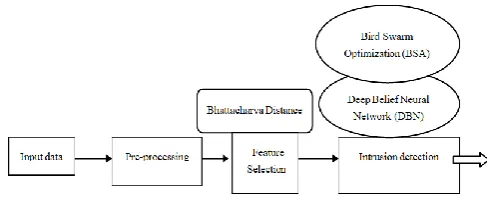
[image:2.595.312.556.50.152.2]Intrusion detection is the basic necessity for assuring the security of the data in the network free from the network attacks. Intrusion detection is similar to the data classification, which confirms if the data is anomaly or not. With the aim to afford the security of the data, various methods are developed. In this paper, the intrusion detection is performed using the DBN classifier, which is trained using the optimization algorithm.
Fig. 1.Block diagram of the intrusion detection framework
There are three progressing steps: the first step is pre-processing and the second step is the feature selection using the Bhattacharya distance. The selected features are given to the DBN for the intrusion detection and the classifier is trained using the LM algorithm or BSA based on the minimal value of the error. Below Figure shows the block diagram of the intrusion detection strategy.
A. Pre-processing
The input data is initially subjected to the pre-processing step, which smoothen the data in such a way to make it effective for the further processing associated with the intrusion detection in the network. Let us consider the database D with n number of data and m number of attributes.
B. Feature selection based on the Bhattacharya coefficient
In general, Bhattacharya distance is defined as the overlapping degree of two statistical samples. In this paper, Bhattacharya distance is employed for selecting the significant features and is computed using the mean and variance of the attributes corresponding to the data. The Bhattacharya distance is computed using the formula,
22 22 2 2
4 1 2 4
1 ln 4 1 ,
j i
j i i
j j i j
i a a q
where, q
ai , a j
is the Bhattacharya distance, 2
refers to the variance of the individual attributes present in the database di, and
2
denotes the variance of the individual attributes present in the database dj. Similarly, i indicates
the mean of the individual attributes present in the database di, and j denotes the mean of the individual attributes
present in the database dj. di specifies the ith data in the database with m number of attributes. However, after the feature selection step using the Bhattacharya distance, the
dimension of the database is represented as
n p
, wherepm.
The feature selection strategy reduces the dimension and contributes to the complex-free detection of the intrusion and enhances the detection accuracy. Thus, the selected features are represented as,
i
International Journal of Innovative Technology and Exploring Engineering (IJITEE) ISSN: 2278-3075, Volume-8, Issue-11S, September 2019
f f fp
f 1, 2,...,
where, f is the feature vector containing p number of selected features.
C. Intrusion detection using the BSA-based Deep Belief Network
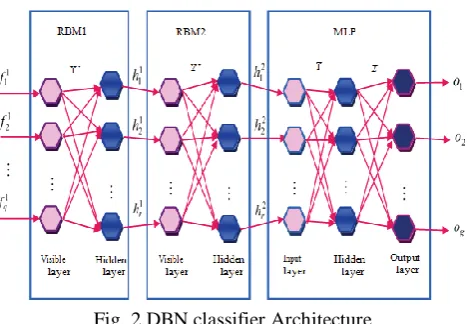
[image:3.595.52.286.298.460.2]In this section, the intrusion detection using the proposed BSA-based DBN is presented. The deep insight over the structure of DBN [10] and the training algorithm is explained clearly. Basically, the DBN classifier comprises of the numerous RBM layers and a MLP layer and in this paper, two RBM layers are considered. Figure 2 shows the structure of DBN classifier trained using BSA [8]. Each of the layers in DBN is the interconnection of the neurons such that the input data is processed in RBM1 and carried to the RBM2 layer. The input to the MLP layer is the output from RBM2, from MLP the final output is derived.
Fig. 2.DBN classifier Architecture
The visible layer of RBM1 is fed with the input feature vector. The hidden and visible layer of the RBM1 layer can be represented as,
h h h h
l r hq k v v v v v
r l
q k
1 , , , ,
1 , , , ,
1 1 1 2 1 1 1
1 1 1 2 1 1 1
where, v1 refers to the kth visible neuron and h1 indicates the
lth hidden neuron. There are a total of q visible neurons in RBM-1 and r hidden neurons in RBM-1. Additionally, the layer is supported with a set of weights and biases, and the bias of visible and hidden layer in the RBM-1 is represented as, P1 and Q1. The weights in RBM-1 is initialized as,
W k q l rW1 kl1 1 ,1
where, W1 is the k th visible layer and lth hidden layer weight.
Thus, the dimension of weight in RBM-1 is
q r
.The output from the hidden layer of RBM-1 forms the input to the visible layer of RBM-2, which is represented as,
k kl k l
l Q f W
h1 1 1 1
where, activation function is represented as .
The output from RBM-1 is,
h l r h1 l11 The input to the RBM-2 is depends on the output from hidden layer of RBM-1 and hence, the number of neurons in hidden layer of RBM-1 and visible layer in RBM-2 are same. The visible layer and hidden layer of RBM-2 are represented as,
h h h h
l r hr l v v v v v
r l
r l
1 , , , ,
1 , , , ,
2 2 2 2 2 1 2
2 2 2 2 2 1 2
The biases in the hidden and visible layers of RBM-2 is represented as, Q2 and P2 respectively. The weights of RBM-2 is given as,
kll k l
l ll
W v P h
r l W W
2 2 2 2
2
2 1
where,P2 is the bias corresponding to the lth hidden neuron. The output of the hidden layer in RBM-2 generates the input to the MLP layer and is given as,
h l rh2 l2 1
The input layer of MLP is,
y y y y
l ry 1, 2,, l,, r 1
where, r is the number of neurons in the input layer and the hidden layer of MLP.
The third layer in MLP is the output layer, which is represented as,
o o o o
e go 1, 2,, e,, g 1
where, g is the count of output layer neurons in MLP.
Z1 and Z2 are the two vectors used in MLP for hidden layer input and hidden layer output.
Z l r u RZ1 lu12 1 ;1
where, R are the total hidden neurons in MLP.
The output is computed as,
2
1 1
l l u r
l
l lu
u Z y B y h
O
where, Bu is the hidden neuron bias and yl = h2 as the output from RBM-2. The weights between the hidden and the output layer is represented as, ZH and is represented as,
Z u R e gZ H
ue
H 1 ;1
Thus, the output from MLP is calculated using the weight ZH as,
R u u H ue O Z OP 1D. Training of DBN
In this section, the training of DBN classifier is illustrated. The unsupervised learning is performed in RBM using gradient descent method, whereas MLP undergoes supervised learning using a standard back propagation-based BSA optimization. The LM-based BSA is the application of LM and BSA in training the DBN classifier, which is based on the minimal value of the error.
The training in MLP is based on back propagation-BSA optimization by feeding the training data, which is the output from the hidden layer of the RBM-2 layer, through the network. The data is analyzed and the weights are iterated continuously to derive the optimal weights. The selection of the weights is based on the LM and BSA optimization for which the weights are determined individually for the LM and BSA and the corresponding error is calculated. The weight for the minimum of errors is chosen the selected weight for updating the DBN classifier, which is engaged in detecting the intrusion in the network.
BSA [8] is an bio-inspired algorithm with swarm intelligence, it includes the social interactions and behaviors of the birds. The characteristics are modeled as vigilance, foraging, and flight behaviours of the birds, which highlight the foraging nature of the bird for food, escaping the predators through the social interactions, aiming at the higher degree of survival. The idealised rules of BSA are given as: the bird constantly switches between the vigilance and foraging behaviors that remains as the stochastic decision. In the foraging, the birds keep updating the previous best position of the birds and location of food. Moreover, the message is spread widely in the entire social group and on the other hand, the birds in the vigilance mode keep updating the position towards the center of the swarm.
However, the movement may be affected due to the inference among the birds, which is likely to be nearer to the center. Additionally, the birds fly to other places during the process of production and scroungement. The bird possessing the higher reserve is chosen as the producer, whereas the other is the scrounger. Particularly, the birds between the lower and higher reserves choose randomly between producer and scrounger. Finally, the producer searches for the food, while the scrounger follow the producer for their food. On the other hand, LM algorithm is a standard algorithm that uses the error minimal value. The steps of the training algorithm is given as,
i) Initialize the weights Z1 and ZH randomly.
ii) Read the input sample {h2} acquired from the hidden
layer of RBM-2.
iii) Compute the outputs Ou and OP .
iv) Find the average error between the outputs generated from the classifier and the desired output, which is formulated as,
n i i e i eavg o Do e g
n E 1 2 1 ; 1
where, n is the total solutions, oi is the computed output
and Doi is the desired output.
v) Compute the weight updates in the visible and the hidden layers by taking the partial derivative of Z1 as
1 1 lu avg lu Z E Z
where, ŋ is the learning rate.
vi) Determine the hidden and visible layer weights of MLP using LM algorithm as,
Hue H ue LM H ue lu lu LM lu Z t Z t Z Z t Z t Z 1 1 , 1 1 , 1
where, Z1 and ZH are the weights in the visible and the hidden layer at current iteration t.
vii) Compute the new weights using the BSA optimization
viii) Compute the error function Eavg(LM) for the weights updated using LM algorithm.
ix) Compute the error function Eavg(BSA) for the weights updated using BSA. The update equation of the BSA optimization is given as,
0,1
0,11 rd V W Gb rd U W Pb W
Wt t t t
where, Wt+1 is the updated weight using BSA and is employed for computing the weights of visible layer Z1(t) and hidden layer ZH(t) of MLP layer in DBN. Pb and Gb are the best position of the solution. rd(0,1)is the random number, U and V are the positive numbers.
ix) Select new Z1,LM (t+1) and ZH,LM (t+1) based on error minimization as
Z t otherwise E E if t Z t Z otherwise t Z E E if t Z t Z LM H ue LM avg BSA avg BSA H ue LM H ue LM lu LM avg BSA avg BSA lu LM lu ; 1 ; 1 1 ; 1 ; 1 1 , ) ( ) ( , , , 1 ) ( ) ( , 1 , 1 The weights are computed individually using the LM algorithm and BSA optimization and the output of the DBN classifier is computed and the
International Journal of Innovative Technology and Exploring Engineering (IJITEE) ISSN: 2278-3075, Volume-8, Issue-11S, September 2019
desired output of the classifier. The error is computed individually for both the algorithms and the weight contributing to the minimal value of the error is chosen for the visible and hidden layers of MLP.
x) Repeat steps mentioned above, until the optimal weight is chosen.
IV. RESULTSANDDISCUSSION
In this section, the results and discussion of the intrusion detection methods is presented along with the comparative analysis at the end to reveal the effectiveness of the proposed method. The experimentation of the intrusion detection methods is implemented in MATLAB using the dataset acquired from the KDD cup 1999 dataset [9] using which the analysis is performed for the methods against various network attacks.
The metrics used for the analysis includes the accuracy, sensitivity, and specificity. The accuracy is calculated as,
fp fn tp tn
tp tn Accuracy
where, fp, fn, tp and tn are the false positive, false negative, true positive and true negative measures. Sensitivity or the true positive rate (TPR) is the measure of the detected true positives and is computed as in equation given below.
fn tp
tp
TPR
True negative rate (TNR) is a measure of accuracy computed based on the true negatives. The formula for specificity is:
fn tp
tp
TNR
The proposed method is analyzed through the analytic comparison with the existing methods, K-Nearest Neighbors (KNN) [12], Decision Tree (DT) [11], and Deep Belief Neural Networks (DBN) [10].
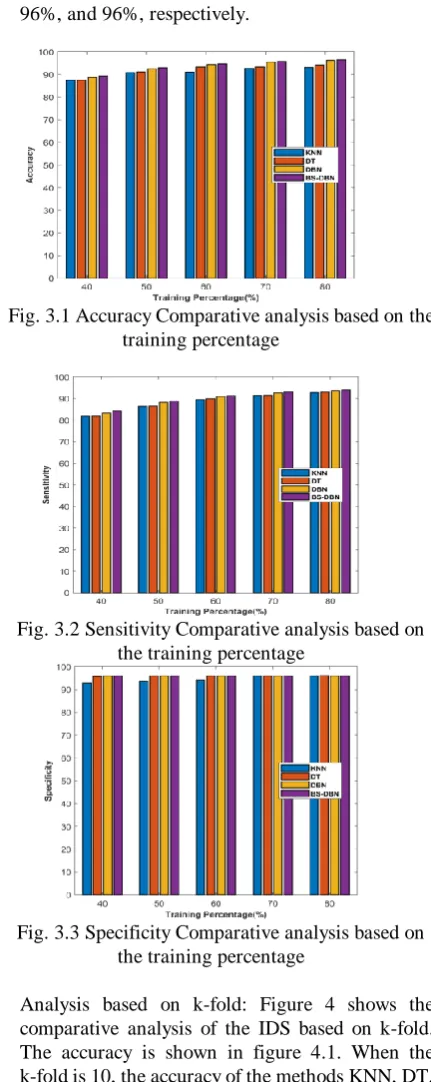
Training percentage: Figure 3 shows the comparative analysis of the IDS based on training percentage. The accuracy of the intrusion detection methods is depicted in the figure3.1. When the training percentage is 80%, the accuracy of KNN, DT, DBN, and BS-DBN is 93.083 %, 94.233%, 96.250%, and 96.458%, respectively.
The sensitivity of the intrusion detection methods is depicted in figure 3.2. When the training percentage is 80%, the sensitivity of the methods KNN, DT, DBN, and BS-DBN is 92.776%, 92.917%, 93.751%, and 94.077%, respectively.
The specificity of the intrusion detection methods is depicted in figure 3.3. When the training
[image:5.595.331.547.74.616.2]percentage is 80%, the specificity of the methods KNN, DT, DBN, and BS-DBN is 96%, 96.114%, 96%, and 96%, respectively.
Fig. 3.1 Accuracy Comparative analysis based on the training percentage
Fig. 3.2 Sensitivity Comparative analysis based on the training percentage
Fig. 3.3 Specificity Comparative analysis based on the training percentage
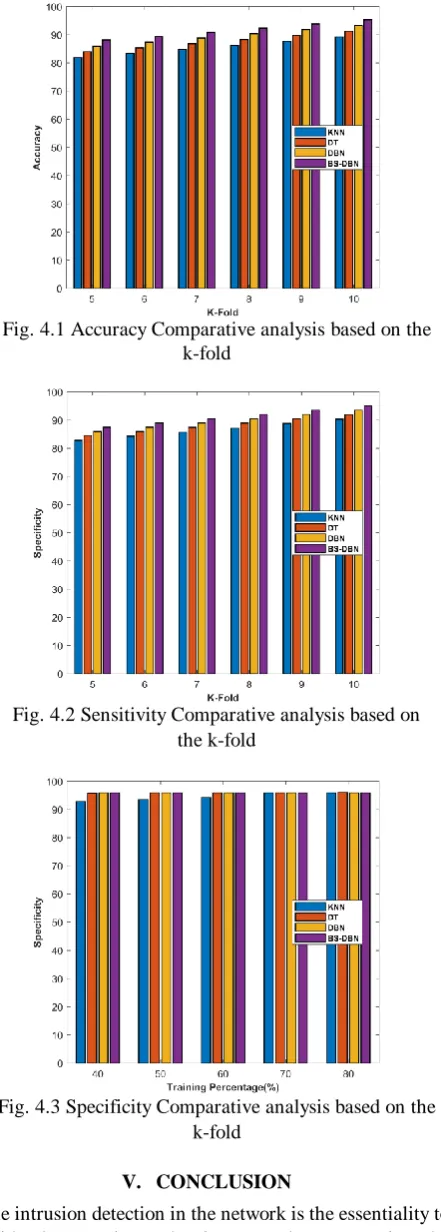
Analysis based on k-fold: Figure 4 shows the comparative analysis of the IDS based on k-fold. The accuracy is shown in figure 4.1. When the k-fold is 10, the accuracy of the methods KNN, DT, DBN, and BS-DBN is 89.253 %, 91.279%, 93.299%, and 95.264%, respectively.
The sensitivity is shown in figure 4.2. When the k-fold is 10, the sensitivity of the methods KNN, DT, DBN, and BS-DBN is 86.8861%, 88.8842%, 90.8950%, and 92.8497%, respectively.
Fig. 4.1 Accuracy Comparative analysis based on the k-fold
Fig. 4.2 Sensitivity Comparative analysis based on the k-fold
Fig. 4.3 Specificity Comparative analysis based on the k-fold
V. CONCLUSION
The intrusion detection in the network is the essentiality to provide the security and privacy to the users using the internet as internet has become the prime necessity of the day-to-day life. The IDS in this paper is based on the proposed BSA-based DBN classifier that marks the presence of the attacker or intruder. The importance of the classifier is that the classifier is tuned using the LM algorithm and BSA optimization, which updates the weight of the DBN classifier such that the choice for the algorithm for the weight update depends on the minimal value of the sum of the mean square error. The effectiveness of the intrusion detection method is
proved through the analysis using the KDD cup dataset and the analysis is performed based on the metrics, such as accuracy, sensitivity, and specificity. The sensitivity, accuracy and specificity of the BSA-DBN approach of intrusion detection are found to be 94.07%, 96.45% and 96%, respectively. This revealed that the proposed method of IDS is accurate and the method outperformed the existing classifiers used for the intrusion detection. The future extension of the method is based on any of the hybrid optimizations for detecting the network intruders.
REFERENCES
1. YunchuanGuo, HanZhang, LingcuiZhang, LiangFang, and FenghuaLi, "A game theoretic approach to cooperative intrusion detection",Journal of Computational Science, vol.30, pp.118-126, January 2019.
2. Xiujuan Wang, Chenxi Zhang, Kangfeng Zheng, " Intrusion detection algorithm based on density, cluster centers, and nearest neighbors", Communications, vol.13, no.7, pp.24 - 31, July 2016.
3. Hamidreza Sadreazami, Arash Mohammadi, Amir Asif, KonstantinosN. Plataniotis, " Distributed-Graph-Based Statistical Approach for Intrusion Detection in Cyber-Physical Systems", IEEE Transactions on Signal and Information Processing over Networks, vol.4 , no.1, pp. 137 - 147, March 2018.
4. Hichem Sedjelmaci, Sidi Mohammed Senouci, Nirwan Ansari, "Intrusion Detection and Ejection Framework Against Lethal Attacks in UAV-Aided Networks: A Bayesian Game-Theoretic Methodology", IEEE Transactions on Intelligent Transportation System, vol.18, no.5, pp.1143 - 1153, May 2017.
5. J V Anand Sukumar ; I Pranav ; MM Neetish ; Jayasree Narayanan,"Network Intrusion Detection Using Improved Genetic k-means Algorithm", In Proceedings of the International Conference on Advances in Computing, Communications and Informatics (ICACCI), 19-22 Sept. 2018.
6. Shan Suthaharan, “An iterative ellipsoid-based anomaly detection technique for intrusion detection systems", In Proceedings of the Proceedings of IEEE Southeastcon., pp.1-6, 2012.
7. Gong Shang-fu and Zhao Chun-lan, "Intrusion Detection System Based on Classification", In Proceedings of the IEEE International Conference on Intelligent Control, Automatic Detection and High-End Equipment, 27-29 July 2012.
8. Xian-Bing Meng, X.Z. Gao, Lihua Lu, Yu Liu & Hengzhen Zhang, "A new bio-inspired optimization algorithm: Bird Swarm Algorithm", Journal of Experimental & Theoretical Artificial Intelligence, vol.28, no.4, 17 July 2015.
9. KDD Cup 1999 Data,
Available:http://kdd.ics.uci.edu/databases/kddcup99/kddcup99.html 10. J Vojt -, Deep neural networks and their implementation, Charles
University, Prague, 2016.
11. Manish Kumar ; M. Hanumanthappa ; T. V. Suresh Kumar, " Intrusion Detection System using decision tree algorithm", In Proceedings of the 2012 IEEE 14th International Conference on Communication Technology, 9-11 Nov. 2012.
12. YihuaLiao and V.RaoVemuri, Use of K-Nearest Neighbor classifier for intrusion detection, Computers & Security, vol.21, no.5, pp.439-448, 1 October 2002.
13. YAO Jun-lan, Intrusion detection technology and its development trend. Information Technology, vol.4, pp.172-175, 2006.
14. A. S. Ashoor and S. Gore, “Importance of Intrusion Detection system (IDS)”. International Journal of Scientific and Engineering Research, vol. 2, no. 1, pp.1-4, Jan-2011.
15. Zhiqiang Zeng, Ji Gao,Guda Zhu, “Network Intrusion Detection Model Based on Simplified SVM”, Journal of Computer Engineering, vol.35, no.17, pp.132-134, 2009.
16. S. Bharath Reddy, D. Malathi,”A Technical Review on Intrusion Detection and Prevention Systems (IDPS) Methodologies”, International Journal of Applied Engineering Research, Vol. 10, No.17 pp. 38228-38240, 2015.
17. S. Bharath Reddy, D. Malathi, A. Viswanadham,” Detection of Mimicry Attacks in Automated Way”, vol.10, no.10, 2017.