Functional and Comparative Genomics Of
Enterococcus faecium Isolated From Animals
Thesis submitted in accordance with the requirements of the University
of Liverpool for the degree of Doctor in Philosophy by Ashwag Shami
General Abstract
Enterococci are Gram-positive bacteria that inhabit the gastrointestinal tract of humans and animals as commensal flora. In recent years two species, Enterococcus faecalis and Enterococcus faecium, have become an increasing medical concern by virtue of their ability to gain and spread antibiotic resistance.
In this study, genomes of vancomycin-resistant isolates of E. faecium from pig, chicken and calf were sequenced using 454 and PacBio platforms. The assembled genomes were annotated and compared with human E. faecium isolates to identify their repertoire of genes potentially associated with colonising each host. Phylogenomics of E. faecium was used to investigate the relationship between animal and human strains. The genomes of the chicken, pig and calf isolates differed in size (2.5 Mb to 3.3 Mb) with the size difference due to horizontally-acquired elements (mostly phage, transposons and insertion sequences); the chicken isolate genome contained five prophages.
A mega-plasmid present in each of the sequenced E. faecium was revealed to be integrated into the genome of the chicken isolate. Comparison of the three genomes identified putative niche adaptation genes with a variety of proposed functions, particularly carbohydrate utilisation. Possible factors that explain E. faecium sub-populations, including clinical, commensal and animal isolate clades were examined. Use of the PhenoLink relationship tool to examine the E. faecium sub-populations identified that putative niche specific genes include carbohydrate utilisation genes and mobile genetic elements.
Acknowledgements
Working on this Ph.D. has been a wonderful and often great experience. It is hard to say whether it has been grappling with the topic itself which has been the real educational experience, or grappling with how to give talks, working in a group and staying focused ... In any case, I am thankful to many people for making my Ph.D.an unforgettable experience.
First and foremost, praises and thanks to the God, for giving me blessings throughout my Ph.D. to complete the research successfully.
I wish to acknowledge the Royal Saudi Government and Ministry of Higher Education for providing me with Masters and Ph.D. scholarships to study in the UK.
I would like to express my deep and honest appreciation to my research supervisors Dr. Malcolm Horsburgh and Dr. Alistair Darby who have been a wealth of knowledge and support throughout my study. Their understanding, interest and kindness were infinite. As supervisors of a student originally from a non-English speaking country, they consumed extensive time and effort in improving my English communication skills, which will indeed have great influence on my future research career.
Sincerely my thanks to Dr. Malcolm, it was a great pleasure and honour to
work and study under his supervision. I am extremely grateful for what he has offered me. I would also like to thank him for his friendship, empathy, and great sense of humour. I am extending my heartfelt thanks to his wife and family for their acceptance and patience during thesis preparation.
I would particularly like to thank Paul Loughnane and Pisut Pongchaikul whose excellent expertise, patience and kindness helped me to get through all the difficult stages of my project in the lab and in bioinformatics.
I owe particular thanks to my husband Moiad Smeer Almadani. He always supports me and is a source of pride for me over many years. His faith, sustenance, understanding and companionship were the sources of my strength to pursue this dream.
They always stood beside me and they supported me to get rid of everything that annoys me.
Finally, I extend my gratitude to my friends who gave me all the emotional support throughout my years of study who helped me to open up my heart in ways I wouldn’t have thought were possible.
Declaration
The work in this dissertation was carried out in accordance with the Regulations of the University of Liverpool. This work is my own original research, except where acknowledged in the text. No part of this thesis has been submitted for any other degree. The dissertation has not been submitted to any other University.
Signed
Ashwag Shami
Date
Table of Contents
General Abstract. ... ii
Acknowledgements ... iii
Declaration ... v
Table of Contents ... vi
List of Tables ... xi
List of Figures ... xiv
List of Abbreviation ... xxi
Chapter One:Introduction. ... 1
1.1 History of the Genus Enterococcus ... 2
1.2 General Characteristics ... 4
1.3 Habitat and Distribution ... 4
1.4 Enterococcus as a commensal ... 5
1.5 Enterococcal epidemiology ... 6
1.6 Enterococcal infections ... 9
1.6.1 Pathogenesis of enterococcal disease and virulence factors ... 10
1.6.2 Adhesins ... 10
1.6.2.1 Enterococcal surface proteins (Esp) ... 11
1.6.2.2 Aggregation Substances Agg ... 11
1.6.3 Biofilm ... 12
1.6.4 Secreted virulence factors ... 13
1.6.4.1 Cytolysin ... 13
1.6.5 Hydrolytic enzymes ... 13
1.6.5.1 Gelatinase and serine protease ... 13
1.6.5.2 Hyaluronidase ... 14
1.6.6 Lipoteichoic acid ... 14
1.7 Antimicrobial Resistance ... 15
1.7.1 Intrinsic resistance ... 15
1.7.1.1 β-lactams ... 16
1.7.1.2 Aminoglycoside ... 16
1.7.1.3 Streptogramins ... 17
1.7.1.4 Glycopeptides ... 18
1.7.2 Acquired resistance ... 18
1.7.2.1 β-lactams ... 18
1.7.2.2 Aminoglycosides ... 19
1.7.2.3 Macrolides, Lincosamides and Streptogramin B (MLSB) ... 20
1.7.2.4 Streptogramin A ... 21
1.7.2.5 Glycopeptide ... 21
1.7.2.5.1 Vancomycin resistance ... 23
1.7.2.5.1.1 Target modification ... 25
1.7.2.5.1.2 Removal of the susceptible target ... 25
1.7.2.6 Chloramphenicol ... 26
1.7.2.7 Tetracycline ... 27
1.8 Genome sequencing ... 27
1.10 E. faecium genome ... 32
1.10.1 E. faecium Sub-populations ... 33
1.11 Mobile genetic elements ... 33
1.11.1 Insertion sequences elements and transposons ... 34
1.11.2 Plasmids ... 35
1.11.3 Bacteriophages ... 36
1.11.4 Genomic islands ... 38
Aims of the study ... 40
General aims ... 40
Specific aims ... 41
Chapter Two: Materials and methods. ... 42
2.1 Media, Strains and Antibiotics ... 43
2.1.1 Growth Media ... 43
2.1.2 Strains and culture conditions ... 44
2.1.3 Antibiotics ... 44
2.2 Reagents ... 49
2.2.1 General Reagents and Buffers ... 49
2.3 Enzymes ... 51
2.4 Kits ... 51
2.5 Methods ... 51
2.5.1 DNA purification ... 51
2.5.2 Plasmid purification ... 52
2.6 Genetic Manipulations by Polymerase Chain Reaction (PCR) ... 54
2.6.1 Primer design and synthesis ... 54
2.6.2 PCR conditions and reactions ... 59
2.7 Agarose gel electrophoresis ... 61
2.8 PCR purification ... 61
2.9 Sequencing of PCR products ... 62
2.10 Bioinformatics analysis of PCR products ... 63
2.11 Induction of bacteriophages ... 63
2.11.1 Norfloxacin induction ... 63
2.11.2 UV induction ... 63
2.11.3 Mitomycin C induction ... 64
2.12 Phage propagation ... 64
2.13 Phage lysate ... 65
2.14 Phage counting Plaque forming unit (PFU) ... 65
2.15 Phage Transduction ... 65
2.16 Preparation of bacteriophage DNA; PEG precipitation/ purification ... 66
2.17 Bacteriocin induction ... 67
2.18 Bioinformatics tools ... 68
2.18.1 Sequence Analysis Tools ... 68
2.18.2 Databases and Genome Resources ... 74
2.19 Structural and functional annotation ... 76
2.20 Genome map ... 77
2.21Ortholog analysis ... 77
2.22 Phylogenetic construction ... 78
2.24 Phage identification ... 79
2.24.1 Sequence clustering and phylogenetics ... 79
2.24.2 Putative prophage attachment sites ... 80
Chapter Three: Genome sequencing of three animal isolates of Enterococcus faecium ... 81
3.1 Introduction ... 82
Specific Aims ... 84
3.2 Results ... 84
3.2.1 Genome sequencing and assembly ... 84
3.2.2 Annotation of the E. faecium genome animal strains ... 85
3.2.3 General genome features of the three animal strains of E. faecium ... 86
3.2.3.4 Ribosomal genes ... 89
3.2.3.5 GC- content ... 91
3.2.3.6 Genome synteny ... 92
3.2.3.6.1 Genome inversion in E. faecium genomes ... 96
3.2.3.7 Repetitive sequence elements in the sequenced E. faecium genomes ... 99
3.2.4 Genome gap closure ... 111
3.2.4.1 Gap closure ... 111
3.2.4.2 A fully sequenced E. faecium genome ... 118
3.3 Discussion ... 121
3.3.1 Genome analysis ... 121
3.3.2 Genome synteny ... 122
3.3.2.1 Genome inversions in animal strains of E. faecium ... 124
3.3.3 Gap closure ... 125
Chapter Four: Comparative genomics of Enterococcus faecium, isolated from animals ... 128
4.1 Introduction ... 129
Specific aims ... 132
4.2 Results ... 132
4.2.1 Comparative genomics of Enterococcus faecium ... 132
4.2.1.1 Core and pan-genome of E. faecium ... 133
4.2.1.2 Phylogenetic tree ... 140
4.2.1.1 Heat map analyses ... 143
4.2.2 Comparative genomics of animal Enterococcus faecium ... 147
4.2.2.2 Relationships within animal E. faecium ... 153
4.2.2.3 PhenoLink analyses of animal E. faecium ... 156
4.2.2.4 The novelty of animal E. faecium genomes used in this study ... 157
4.3 Discussion ... 166
4.3.1 Core and pan-genome of E. faecium ... 163
4.3.2 Phylogenetic and diversity of E. faecium genome ... 166
4.3.3 E. faecium sub-populations ... 170
4.3.4 The novelty of animal E. faecium genomes used in this study ... 171
Chapter Five: Mobile genetic elements in the genomes of E. faecium isolated from animals. ... 174
5.1 Introduction ... 175
Specific aim ... 176
5.2 Results ... 176
5.2.1 Mobile genetics elements ... 176
5.2.1.1 Insertion sequence elements (IS) ... 176
5.2.1.2 Plasmids ... 180
5.2.1.3 Bacteriophage ... 184
5.2.2 Investigating animal E. faecium genomes with regards to virulence, resistance and survival………..185
5.2.2.1 Virulence factors ... 185
5.2.2.2 Antibiotic resistance ... 187
5.2.2.3 Genomics Island ... 192
5.3 Discussion ... 194
5.3.1 Insertion sequence elements ... 194
5.3.1.2 Plasmid ... 197
5.3.2 Distribution of genes encoding MSCRAMM-like proteins, putative virulence genes and antibiotic resistance determinants ... 198
5.3.3 Genomic Islands ... 201
Chapter Six: Comparative genomics of E. faecium bacteriophages ... 204
6.1 Introduction ... 205
Specific aims ... 206
6.2 Results ... 207
6.2.1 Bacteriophage induction and distribution ... 207
6.2.3 Transduction using identified phages ... 210
6.2.4 Animal E. faecium bacteriophages ... 212
6.2.4.1 General genome features of animal E. faecium phages ... 212
6.2.4.2 Organisation of animal prophage genomes ... 213
6.2.5 Comparative genomic analysis E. faecium bacteriophage ... 217
6.2.5.1 General features of E. faecium phage genome ... 217
6.2.5.3 Genome clustering: pairwise prophage genome analyses ... 221
6.2.5.4 Lysogeny module of E. faecium prophages ... 226
6.2.5.5 Replication module ... 230
6.2.5.6 Packaging module ... 231
6.2.5.7 Morphology module ... 233
6.2.5.8 Lysis module ... 235
6.2.6 Cluster diversity and newly-acquired genes ... 237
6.2.7 Identification of putative phage attachment sites ... 239
6.2.8 Identification of E. faecium phage cargo genes ... 242
6.2.9 E. faecium cryptic phage ... 245
6.3 Discussion ... 248
6.3.1 Bacteriophage of animal E. faecium strains ... 248
6.3.2 Comparative genomic analysis E. faecium prophage ... 250
6.3.2.1 General features of E. faecium prophage genomes ... 250
6.3.2.2 Functional module of E. faecium prophages ... 254
6.3.2.3 E. faecium prophage genome diversity ... 259
6.3.4 E. faecium prophage cargo ... 260
6.3.5 Cryptic phage ... 263
Chapter Seven: Conclusions and Future Work. ... 265
7.1 Conclusions ... 266
7.2 Future work ... 268
List of Tables
Table 2.1: List of bacterial strains used in this study for experimental and
bioinformatics analyses ... 44
Table 2.2: List of antibiotics used in this study ... 48
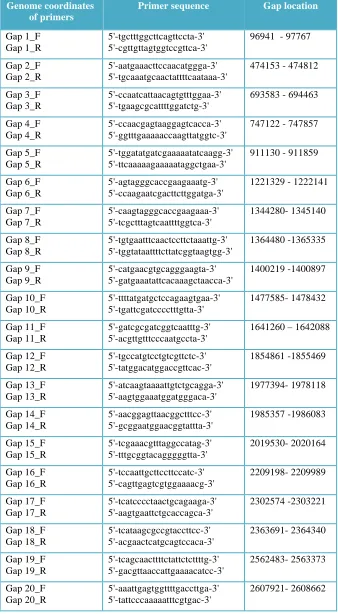
Table 2.3: Genome coordinates and sequence of primers used for closing animal E. faecium gaps strain E429 isolated from chicken. ... 55
Table 2.4: Antibiotic resistance gene primers used in this study. ... 58
Table 2.5: Phage integrase primers used in this study ... 58
Table 2.6: Housekeeping gene primers used in this study5 ... 59
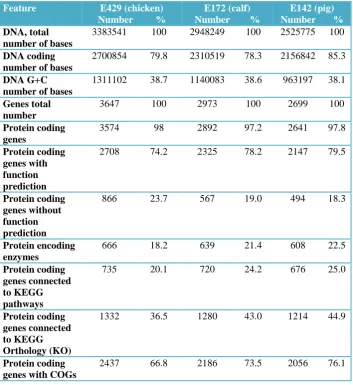
Table 3.1: Structural features associated with the sequenced genomes of E. faecium strains E429, E172 and E142. ... 86
Table 3.2: Genome composition features of strains E429, E172 and E142. ... 87
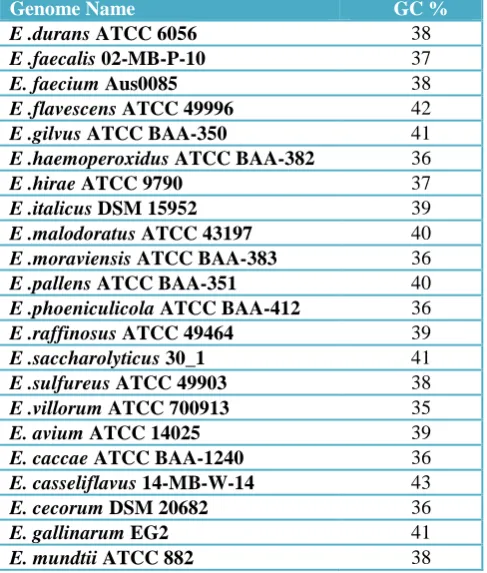
Table 3.3 A: Comparative genome features of Entercoccus species retrieved from the Integrated Microbial Genomes database. The table displays the variation in copy number of rRNAs genes among a selection of Entercoccus species genomes. ... 88
Table 3.3 B: Comparative genome features of E. faecium strains retrieved from the Integrated Microbial Genomes database. *refers to closed genomes.The table displays the variation in copy number of rRNAs genes among a selection of E. faecium isolates from humans (clinical and commensal strains) compared with animal strains ... 88
Table 3.4: Genome features of Enterococcus species retrieved from Integrated Microbial Genomes database https://img.jgi.doe.gov/cgi-bin/er/main.cgi?logout=1 ... 90
Table 3.5: PCR amplification result for E. faecium E429 gaps. +++ Indicates very strong band, ++ shows strong band, + weak band and - is negative result. ... 112
Table 3.6: Gap sequence information of E. faecium E429. Gap location and the BLAST results for the PCR reactions. *indicates the gap that is not completely closed. ... 116
Table 3.8: Genome composition features of strains E172 using 454
sequencing and PacBio platforms. ... 121
Table 4.1: Core clusters of Orthologous Groups (COGs) of E. faecium.
Table shows the numbers of COGs in the core genome of E. faecium and the percentage of each functional category relative to total COGs in the core
genome. ... 137
Table 4.2: Clusters of Orthologous Groups (COGs) of E. faecium. Table
shows the numbers of COGs in the pan-genome of E. faecium and the percentage of each functional category relative to total COGs in the core genome. ... 139
Table 4.3: Clusters of Orthologous Groups (COGs) of animal E. faecium.
The table shows the categories numbers of COGs in the core genome of animal E. faecium and the percentage of each functional category compared with total COGs in the core genome. (-) Indicates the absence of a category. ... 150
Table 4.4: Clusters of Orthologous Groups (COGs) of animal E. faecium.
Table indicates the numbers of COGs in the pan-genome of animal E. faecium and the percentage of each functional category compared with total
COGs in the pan-genome. (-) Indicates the absence of a category. ... 152
Table 5.1: Insertion sequence elements in animal E. faecium. IS families in
the three animal strains E429 (chicken), E172 (calf) and E142 (pig) according to the IS Finder database. ... 179
Table 5.2: Virulence factors in animal E. faecium ... 186
Table 5.3: Occurrence of antibiotic resistance genes in E. faecium isolates.
Indicated genes encode resistance to antibiotics as follows: ermA and ermB (erythromycin), lunB (lincomycin), aacA-aphD (gentamycin), aad6 (spectinomycin) and aadE (streptomycin); cat (chloramphenicol), tetM and tetL(tetracycline), van A (vancomycin type A), van B (vancomycin type B),
fos (fosfomycin), parC and g1rA (fluoroquinolone and ciprofloxacin),
Pbp5-R (ampicillin), st (streptothricin); azlC (azaleucine) ,ble (bleomycin),
fmtC (oxacillin) and vgb (streptogramin). Red strains indicate clinical
Table 5.4: GI associated with animal E. faecium isolated from calf. GI
regions, position, size of GI and the key genes presented in each region. . 193
Table 6.1: Phage lysis of E. faecium indicator strains. Phage lysis of a panel of
isolates using filter-sterilised lysates produced after addition of mitomycin C to
strains E429, E172 and E142. (-) indicates absence of plaques (+) indicates
presence of plaques and not tested (X). ... 208
Table 6.2: Phage-related sequences of sequenced animal E. faecium. ... 212
Table 6.3: Genometrics of prophage-related sequences of E. faecium. The 56
phage genomes were retrieved from 39 isolates of E. faecium.. ... 219
Table 6.4: Putative attachment sites attP of E. faecium prophages. ... 241
Table 6.5: Cargo genes in converting prophages of E. faecium. ... 243
Table 6.6: Genometrics of cryptic phage related sequences of E. faecium. Seven
cryptic phage genomes were identified in 5 strains of E. faecium. ... 247
List of Figures
Figure1.1: Peptidoglycan biosynthesis and mechanism of vancomycin.
Association of the antibiotic to the C-terminal d-Ala–d-Ala of late peptidoglycan precursors stops catalysed reactions by transpeptidases,
transglycosylases, and carboxypeptidases reproduced from Courvalin 2006 ... 22
Figure 1.2: Organization of VanA-type glycopeptide resistance operon. The
arrows show regulatory and resistance and the accessory coding sequences
reproduced from Courvalin 2006 ... 25
Figure 1.3: VanA-type glycopeptide resistance. Synthesis of peptidoglycan
precursors in a VanA-type resistant strain reproduced from Courvalin 2006 ... 26
Figure 3.1: Syntenic ribosomal rRNA gene organisation in the genomes of
chicken (E429), calf (E172) and pig (E142) strains ... .89
Figure 3.2: Locally Collinear Blocks (LCBs) identified in a comparison of
E. faecium animal genomes. Each contiguously coloured region is a locally
collinear block of homologous backbone sequence. LCBs below the centreline are in the reverse complement orientation relative to the reference genome (E429). The black arrows show the orientation in the LCBs compared to the reference genome. ... 92
Figure 3.3: Genome synteny between E. faecium Aus0004 and other
Enterococcus species. A. Mummer plot identifies a high degree of
relatedness based on the overall protein sequence homology and gene order between the complete genome of E. faecium Aus0004 and the genomes of E. hirae ATCC 8043, E. durans ATCC 6056 and E. mundtii ATCC 882. B.
Mummer plot identifies a lesser degree of relatedness based on their overall protein sequence homology and gene order between the complete genome of E. faecium Aus0004 and the genomes of E. italicus DSM 15952, E. avium ATCC 14025 and E. asini ATCC 700915. C. Mummer plot
identifies a low degree of relatedness based on their overall protein sequence homology and gene order between the complete genome of E. faecium Aus0004 and the genomes of E. faecalis V583, E. caccae ATCC
represent inverted regions between the two strains. X-axis shows Aus0004 genome. Y-axis shows the Enterococcus species genomes. ... 93
Figure 3.4: Locally Collinear Blocks (LCBs) identified among the E.
faecium chicken genome and the complete genomes Aus0004 and DO. Each
contiguously coloured region is a locally collinear block of homologous backbone sequence. LCBs below a genome’s centreline are in the reverse complement orientation relative to the reference genome (E429). The black arrows show the orientation of the LCBs compared to the reference genome. Red arrows show the location of the integrase in the genome of Aus0004.
Orange arrows show the presence of prophages in the genome of Aus0004. Blue arrows show the transposons located in the genome of DO strain. ... 96
Figure 3.5: Genome synteny of E. faecium. Mummer plot shows the
existence of a large inversion within E. faecium strains. A. Mummer plot shows the existence of the inversion within the two complete genomes Aus0004 and DO strain. X-axis shows DO genome. Y-axis shows the Aus0004 genome. B. Mummer plot shows the existence of inversion within the complete genome Aus0004 and chicken strain (E429). X-axis shows the Aus0004 genome. Y-axis shows E429 genome. C. Mummer plot shows inversion exists within the complete genome DO and the chicken strain (E429). X-axis shows DO genome. Y-axis shows the E429 genome. The plots present the homology between the two strains. ... 97
Figure 3.6: Short tandemly repeated sequence (STRs) in animal E. faecium
strains. STRs covering almost the whole genome of chicken, calf and pig. STRs annotations are located side by side in green and red verticals show rRNA operons. ... 99
Figure 3.7: Short sequence repeats (SSRs) in animal E. faecium strains.
SSRs covering the animal E. faecium genomes. SSRs annotations are located side by side in green and red blocks show rRNA operons. ... 100
Figure 3.8: PCR amplifications of the E.faecium E429 genome gaps. The
Figure 3.9: Gap closure of chicken E. faecium genome. Gap number 13
located between contig00059 (blue) and contig00060 (yellow), which was
successfully closed. The top genome represents the genome with gaps and the bottom genome represents the genome after gap closure. ... 115
Figure 3.10: Gap closure of chicken E. faecium genome. Gap number 4
located between contig00021 and contig00022, which was not closed completely. The red arrow shows the location of the remaining gap. The top genome represents the genome with gaps and the bottom genome represents the genome after gap closure. ... 115
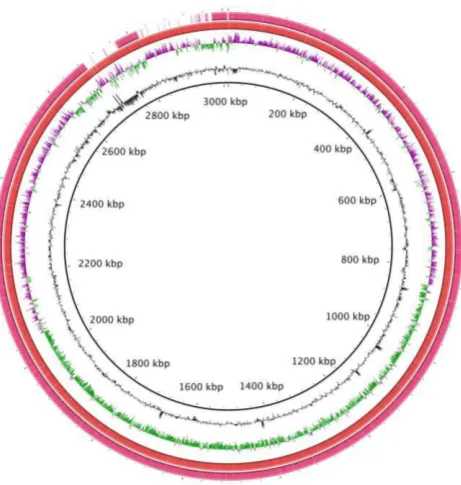
Figure 3.11: Genome map of the complete E. faecium strain E172. The
black ring represents the complete genome of E172 (calf) using long reading platform (PacBio). The ring represents the draft genome of E172 using short read platform (454) ... 119
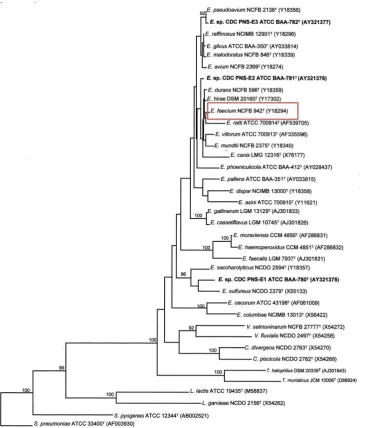
Figure 3.12: Phylogenetic tree of enterococci constructed by (Carvalho
Mda, Steigerwalt et al . 2004) and based on comparative analysis of 16S rDNA sequences. ... 126
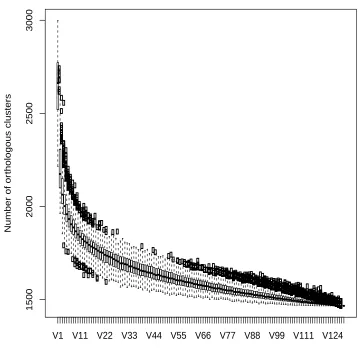
Figure 4.1: Genome structure of E. faecium. The core genome of the 129
strains of E. faecium. Circles represent the number of core genes when each genome is added. Black bars indicate median values ... 134
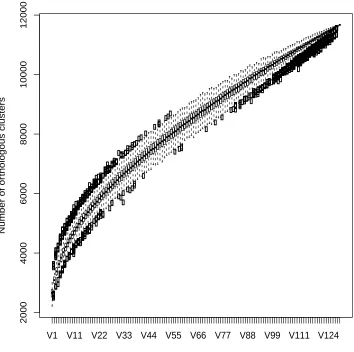
Figure 4.2: Genome structure of E. faecium. Pan-genome determined from
129 strains of E. faecium. The pan-genome is indicated for increasing numbers of sequenced E. faecium genomes. Circles represent the number of new genes when a genome is added. Black bars indicate median values. . 135
Figure 4.3: Neighbour-joining tree of E. faecium. The tree is based on the
concatenated alignments of 1,467 single-copy shared core genes in 129 E. faecium genomes. Bootstrapping was performed with 1,000 replicates. The
origins of the strains are indicated. Green indicates animal origin, blue is commensal origin and red is CC17 origin. Clade C indicates most of commensal strains; clade B indicates a mix of animal strains and other
hospital strains. Clade A indicates most of the hospital strain, with A1 representing strains that belong to CC17; clade A2 contains most of the sporadic human infection strains. ... 143
Figure 4.4: Heat map of the genetic correlations between the 129 E.
represents hospital-associated strains, mostly of CC17 origin; group B comprises animal-associated strains and group C consists of mixed sources including commensal strains. The correspondence between colour scale and genetic correlation levels are presented on the right-hand side of the heat map. (Red shows absent clusters, yellow shows present clusters). ... 145
Figure 4.5: Core genome structure of animal E. faecium. The core genome
is indicated for increasing numbers of sequenced animal E. faecium genomes. Circles represent the number of core genes that exist when a particular genome is added. Black bars indicate median values. ... 148
Figure 4.6: Pan-genome structure of animal E. faecium. The pan-genome is
indicated for increasing numbers of sequenced animal E. faecium genomes. Circles represent the number of new genes that exist when a particular genome is added. Black bars indicate median values ... 149
Figure 4.7: Overall gene content tree for animal E. faecium. The tree was
generated from a comparison of the orthologous groups of publicly available animal E. faecium strains based on the overall gene content (presence/absence tree). Bird strains are highlighted in red, dog strains in green and pig strains in blue. ... 155
Figure 4.8: Neighbour-joining tree of E. faecium. The tree is based on the
concatenated alignments of 1,824 shared single copy orthologous groups in 20 animal E. faecium genomes. Bootstrapping was performed with 1,000 replicates. The origins of the strains are indicated. Green indicates dog origin, blue is pig origin and red is bird origin ... 155
Figure 4.9: Animal E. faecium genome maps. A. Circular map of predicted
genome sequence from the comparator genome E172 (calf), B. Circular map of predicted genome sequence from strain E142 (pig). C. Circular map of predicted genome sequence from E429 (chicken). Genome comparisons are presented the predicted genome sequence from 61 human clinical strains, commensal and animal strains of E. faecium ... 159
Figure 5.1: A presence and absence tree of transposase orthologues in E.
faecium. The red clade indicates CC17 genotype isolates, blue indicates
Texas strains, and green indicates animal isolates ... 178
Figure 5.2: Gel-electrophoresis of plasmid DNA. Lanes from left to right:
Figure 5.3: Comparative analysis of E. faecium plasmid sequences.
Mummerplot analysis reveals homology between animal strain genomes (E429, E172 and E142) and 34 complete plasmid sequences retrieved from the NCBI database. (A) Plot identifies a mega plasmid within the assembled chicken genome (E429). (B) Plot revealing sequences homologous with
plasmid in the calf strain (E172) and (C) the pig strain (E142), which appears to also have a mega plasmid.. ... 182
Figure 5.4: A presence and absence tree of plasmid orthologues in E. faecium.
The red clade indicates CC17 genotype isolates, blue indicates commensal strains, green indicates animal isolates and black indicates other clinical isolates ... 184
Figure 5.5: Vancomycin resistance genes in animal E. faecium. The arrows
show a similar Tn1546 linked operon that is composed of 6 van genes (vanR, S, H, A, X, and Y). ... 191
Figure 6.1: Production of bacteriocin by E. faecium E172 (calf).
Supernatant from E172 (calf) was tested for lysis of the indicator strain E142 (pig). Bacteriocin production peaks after 4 hours growth at 37C. . ... 209
Figure 6.2: PCR amplification of antibiotic resistance genes after
transduction using animal E. faecium phage. (A) Ampicillin (1.5 kb)
resistance locus amplified from strain LIV299 transductants isolated from the chicken (E429) and calf (E172) strains. (B) Tetracycline (4kb) resistance locus amplified from strain LIV303 transductants isolated from the chicken (E429) and calf (E172) strain lysis of strain E142 bearing ampicillin and
tetracycline resistance. (-) indicates strains prior to transduction with the absence of antibiotic resistance, (+). ... 211
Figure 6.3: Genome alignment of animal E. faecium. The E429 (chicken)
DNA sequence was used as a reference DNA sequence to which E172 (calf) and E142 (pig) were aligned and compared. White space within the locally collinear blocks in the chicken strain corresponds with phage regions and the coloured areas represent the similarity in the DNA sequences. Phage 1 in calf and pig share tail proteins with phage 3 in chicken genome…...213
Figure 6.4: Functional annotation comparison of E. faecium phage elements
present in strain E142 (pig). Modular organisation is highlighted with different colours and numbers to reveal grouped functions associated with the phage lifecycle, Brown (1) for phage-like protein; dark green (2) for attachment site; sky blue (3) for integrase; light green (4) for hypothetical protein; purple (5) for lysis proteins; magenta (6) for portal protein; mustard
(7) for head proteins; medium purple (8) for tail proteins; turquoise (9) for non-phage-like proteins; deep violet (10) for terminase; orange (11) for protease ; marine blue (12) for transposase; and light pink (13) for plate proteins. ... 216
Figure 6.5: Cladogram tree of E. faecium prophages. The tree represents the cluster relationships for 56 E. faecium prophages present in the genomes of clinical, commensal, animal and food isolates.. ... 220
Figure 6.6: Mauve alignment of E. faecium phage genomes. Protein alignments of each of 56 E. faecium phage genome clusters displayed as segments of similarity between genomes. The strength of the relationship is represented by colour blocks.. ... 226
Figure 6.7: Cladogram tree of E. faecium prophage integrases. The
cladogram is based on the alignment of integrases amino acid sequences and represents the relationship between E. faecium prophage integrases... ... 230
Figure 6.8: Cladogram tree of the large terminase subunits of E. faecium
prophages. The tree is based on an alignment of the amino acid sequence of 54 terminases.. ... 232
Figure 6.9: Cladogram tree of the tail protein of E. faecium prophages. The
alignment of the amino acid sequence of 51 tail proteins reveals differences between E. faecium prophages producing distinct groupings. ... 234
Figure 6.10: Multiple alignments of E. faecium prophage holins. The
protein alignment indicates high sequence conservation within 4 main holin clusters. ... 236
Figure 6.11: Cladogram tree of E. faecium prophage holins. Based on the
alignment of 52 amino acid sequence of the holin protein, E. faecium prophages have 4 different families of holin. The Holin 4 protein sequences are nearly identical ... 237
Figure 6.12: Mauve alignment of 9 E. faecium prophage type genomes. Pairwise
alignmentof one prophage genome of each of E. faecium pophage clusters A, B, C,
genomes and highlighted diversity. The strength of the relationship is represented
by coloured region. ... 238
Figure 6.13: Cargo genes in converting prophages of E. faecium. Model 1
indicates no lysogenic conversion. The arrow numbers indicate (1) hypothetical protein; (2) cold shocked protein cspc (3) tRNA-met; (4) transposase; (5) integrase core domain protein; (6) transcriptional regulator ygaV; (7) molecular chaperone Hsp31 and glyoxalase 3; (8) NAD dependent epimerase/dehydratase family protein; (9) 3-demethyl ubiquinone-9-3 methyltransferase; (10) TraX protein; (11) N-acetylmuramolyL-alanine amidase ... 244
Figure 6.14: Genome of E. faecium isolated from chicken (E429). The presence
List of Abbreviations
(v/v) Volume/volume
(w/v) Weight/Volume Concentration
Att Prophage attachment site
Bp Base pairs
CAT Chloramphenicol acetyl transferase
CC17 Clonal complex-17
COG Clusters of Orthologous Group
Esp Enterococcal surface proteins
GC Guanosine-cytosine content
GEIs Genomic islands
GRE Glycopeptide-resistant enterococci
HGT Horizontal gene transfer
IS Insertion sequences
Kb kilobase pairs, (thousand of base pairs)
LB Luria Bertani Broth
LCBs Locally collinear blocks
Mb Megabase pairs, (millions of base pairs)
MGEs Mobile genetic elements
MLSB Macrolides, Lincosamides and Streptogramin B
MLST Locus Sequence Typing
MSCRAMM Microbial surface components identifying adhesive
matrix molecules
NCBI National Center for Biotechnology Information
OD Optical density
ORF Open reading frame
PacBio The Pacific Biosciences
PAI Pathogenicity-associated island
PBPs Penicillin binding proteins
PCR The polymerase chain reaction
PFGE Pulsed Field Gel Electrophoresis
PFU Phage counting Plaque forming unit
PTS Phosphotransferase system
PYR L-pyrrolidonyl-B-naphthylamide
RT Room temperature
SSRs Short sequence repeats
ST Sequence types
STRs Short tandemly repeated sequence
THB Todd Hewitt Broth
Tn Transposon
UV Ultraviolet
Van A Vancomycin resistance type A
Van B Vancomycin resistance type B
VRE Vancomycin-resistant Enterococcus faecium
Chapter One :Introduction.
1.1 History of the Genus Enterococcus
Enterococcus was historically termed as a taxonomically diverse genus
identified as being 'faecal streptococci', associated with the gastrointestinal
tract of human (Giraffa 2002). Thiercelin in 1899 first coined the term
'enterocoque' to describe a newly found Gram-positive diplococcus species.
Andrews and Horder in 1906, isolated the same organism from an
endocarditis patient and named it 'Streptococcus faecalis' (Murray 1990).
Based on antigens identified as being group-specific, enterococci were
placed in Streptococcus group D, while pyogenic streptococci belong to
groups A, B, C, E, F or G using antisera. Enterococci were thus classified as
group D streptococci because of their morphology and Lancefield
antigenicity. The antigenicity of the carbohydrate moiety of the cell wall is
distinguished according to a system devised by Lancefield in the 1930s
(Smith, Niven et al. 1938). The established lancefield antigen of
Streptococcus is a virulence determinant. For example, in group A
streptococci it plays a significant role in resistance to platelet-derived
antimicrobials in serum, neutrophil killing and the cathelicidin antimicrobial
peptide LL-37 (van Sorge, Cole et al. 2014).
Many efforts were made to classify these organisms into better taxonomic
groups due to their great diversity. A new classification pattern was
proposed by Sherman in 1937 that classified streptococci into four main
groups namely pyogenic, viridans, lactic streptococci and enterococci. In
group showed only weak association to streptococci (Sherman, Mauer et al.
1937). Subsequently based on nucleic acid techniques, DNA hybridisation,
DNA: rRNA hybridisation and 16S rRNA sequencing revealed that S.
faecalis and S. faecium were only distantly related to other streptococci.
The new genus named Enterococcus was proposed and S. faecalis and S.
faecium were removed from the genus Streptococcus and renamed as
Enterococcus faecalis and Enterococcus faecium, respectively (Schleifer,
Kilpper-Balz et al. 1984, Ludwig, Seewaldt et al. 1985). The classification
of enterococci has always been challenging because it is a heterogeneous
group of Gram-positive cocci which is more closely related to the genera
Carnobacterium, Lactococcus and Vagococcus, yet has many characteristics
of the genus Streptococcus (Leclerc, Devriese et al. 1996).
The genus of Enterococcus is composed of more than forty species (The
National Center for Biotechnology Information, NCBI), classified on the
basis of pigment production, motility and ability to generate acids from a
range of carbohydrates (Fischetti, Novick et al. 2006). Based on the
chemotaxonomic and phylogenetic studies, the establishment of 16S rRNA
sequences led to the description of seven clonal complexes within the genus
namely (i) E. faecalis, E. haemoperoxidus and E. moraviensis; (ii) E.
faecium, E. durans, E. hirae, E. mundtii, E. pocinus, and E. villorum; (iii) E.
avium, E. pseudoavium, E. malodoratus, and E. raffinosus; (iv) E.
casseliflavus, E. gallinarum and E. flavescens; (v) E. cecorum and E.
columbae; (vi) E. dispar and E. asini; (vii) E. saccharolyticus and E.
While there are multiple species in the genus Enterococcus, two are
associated with the majority of human infections, E. faecalis and E. faecium
(Magi, Capretti et al. 2003).
1.2 General Characteristics
Species of the genus Enterococcus are facultative anaerobic cocci which
grow as short to medium length chains or as pairs in liquid culture. They are
catalase negative and have a fermentative metabolism (Hollenbeck and Rice
2012). The optimum growth temperature of enterococci is 37 ºC although
they are capable of growing over a temperature range of 10 to 45 ºC. They
have an ability to survive at 60 ºC for 30 minutes, survive at a high pH,
hydrolyse bile-esculin and L-pyrrolidonyl-B-naphthylamide (PYR) and
grow in the presence of 6.5% sodium chloride (Hollenbeck and Rice 2012).
Since Entercoccus species are resistant to harsh environmental conditions
they are sensitive indicators of faecal contamination (Franz, Stiles et al.
2003).
1.3 Habitat and Distribution
Enterococci are generally considered to be commensal flora in the
gastrointestinal tract of humans and warm-blooded animals (Kuhn, Iversen
et al. 2005, Santagati, Campanile et al. 2012). However, they are not
restricted to these niches and enterococci are resilient species of insects and
reptiles. They can be isolated from many plants and it has been proposed
Different species of enterococci exhibit some host specificity. Most
frequently, E. faecalis and E. faecium are found in humans and farmed
livestock. E. faecium is the predominant species isolated from chicken and
pig. E. durans is found both in humans and poultry. E. avium and E.
gallinarum are restricted to poultry (Nowlan and Deibel 1967), E. columbus
is specific to pigeons (Devriese, Ceyssens et al. 1990) and E. asini is
specific to donkeys (de Vaux, Laguerre et al. 1998). The distribution of
enterococcal species varies across age groups. E. faecalis is principally
present in the intestinal microflora of young poultry, while, E. faecium and
E. caecorum dominate in chickens around 12 weeks (Devriese, Hommez et
al. 1991).
1.4 Enterococcus as a commensal
Commensalism is the relationship between two organisms in which one or
both organisms gets benefits and the other organism is not harmed. In the
colon of nearly all humans and most animals enterococci are minor
residents, present at ~108 colony forming units per g of faeces (Gilmore
2002). Enterococci have effectively evolved various genetic traits which
helps maintain their stable colonisation. Commensal isolates of E. faecium
and E. faecalis are genetically distinct compared to infection isolates. The
differences may be unclear, however, since immunocompromised patients
are more susceptible to infection even with commensal strains (Jett, Huycke
1.5 Enterococcal infections
Over recent decades enterococci have been identified as an important
opportunist pathogen causing nosocomial infections such as bacteremia,
infective endocarditis, urinary tract infections, intra-abdominal, pelvic and
soft tissue infections as well as surgical wound infections. The identification
of different species of enterococci causing these infections provided
information for epidemiological surveillance (Huycke, Sahm et al. 1998,
Lester, Sandvang et al. 2008). Fisher et al (2009) demonstrated that the
majority of Enterococcus infection can be considered endogenous, by translocation of the bacteria within epithelial cells of the intestine, which
later cause infection through lymph nodes and consequently extend to other
cells inside the body.
1.6.1 Pathogenesis of enterococcal disease and virulence factors
To cause disease enterococci must colonise host tissues, defend against host
immune mechanisms and express factors that enable persistence. Multiple
factors are known that regulate the virulence of Enterococcus species, for
example ability to colonise the gastrointestinal tract, ability to adhere to a
variety of extracellular matrix components, including vitronectin,
thrombospondin and lactoferrin, and ability to adhere to oral cavity
epithelia, urinary tract epithelia and human embryo kidney cells (Fisher and
Phillips 2009). Pathogenicity of enterococci has been related to several key
virulence traits associated with adhesion, translocation and immune evasion
1.5.2 Adhesins
The first important step for the bacteria in infection is to adhere to the host
tissues. The most significant adhesion factors are extracellular surface
protein (Esp), aggregation substance (Asa), Enterococcus faecalis antigen A
(EfaA), and endocarditis and biofilm-associated pili (Ebp) (Fisher and
Phillips 2009). Surface proteins called adhesins play a crucial part in
binding to their eukaryotic receptors on the surface of epithelial cells,
endothelial cells, leukocytes and the extracellular matrix. Adhesins also
have many different roles in enhancing phagocytosis, acting as toxins and
initiating or decreasing host inflammatory responses (Jett, Huycke et al.
1994).
1.5.2.1 Enterococcal surface proteins (Esp)
Extracellular surface protein (Esp) was described in Enterococcus species
by Shankar et al (1999). These proteins were first identified in E. faecalis
and are highly conserved in E.faecium sub-populations (Willems, Homan et
al. 2001). Esp encodes a cell-wall-associated protein frequently associated
with clinical isolates. This protein has a significant role in promoting
adhesion, colonisation, immune avoidance, and has a role in antibiotic
resistance (Foulquie Moreno, Sarantinopoulos et al. 2006).
Esp is associated with enterococcal biofilm formation, which might lead to
adhesion to eukaryotic cells, such as those of the urinary tract, and increases
resistance to environmental stresses (Borgmann, Niklas et al. 2004).
E. faecium strains of dairy, animal and clinical origin was performed by
Mannu et al (2003) and they suggested that the esp gene may correlate with
pathogenicity, since esp was absent in dairy isolates, comparing with 21 of
28 clinical strains that had the gene. Conjugation rates and resistance to
ampicillin, ciprofloxacin and imipenem were also higher in E. faecium
strains with esp than strains without it.
1.5.2.2 Aggregation Substances Agg
Agg is a pheromone-inducible surface glycoprotein that facilitates aggregate
formation through conjugation, enhances adhesion to a range of eukaryotic
surfaces and plasmid to transfer (Koch, Hufnagel et al. 2004). The existence
of Agg raises the hydrophobicity of the enterococcal cell surface promoting
localisation of cholesterol to phagosomes and many interrupt or inhibit
fusion with lysosomal vesicles (Eaton and Gasson 2002).
Pulsed-field gel electrophoresis analysis performed by Billstrom et al
(2008) indicated that the gene encoding Agg exists in clinical isolates of E.
faecalis but not E. faecium. Adhesion to collagen of E. faecalis (Ace) or E.
faecium (Acm) is another cell-surface protein belonging to the microbial
surface components identifying adhesive matrix molecules (MSCRAMM)
family (Fisher and Phillips 2009).
Sex pheromones were recognised in E. faecalis by identifying a clumping
reaction that occurs through conjugative transfer of plasmids (Wirth 1994).
seven to eight amino acids encouraging a mating response in cells with
corresponding conjugative plasmids. Sex pheromones trigger
chemoattraction of neutrophils causing granule enzyme secretion and
respiratory burst (Ember and Hugli 1989).
1.5.3 Biofilm
Singh et al (2007) suggested that the capability of enterococci to generate
biofilms is essential in producing endodontic, endocarditis and urinary tract
infections. The formation of pili is required for biofilm formation. The
endocarditis- and biofilm-associated pili gene cluster (ebp) contributes to
the production of biofilm in enterococci. The ebp operon contains ebpA,
ebpB ebpC and encoding pilus subunits srtC encoding sortase C that
catalyses their covalent attachment to peptidoglycan and are found on the
surface of E. faecalis and E. faecium (Nallapareddy, Singh et al. 2006,
Sillanpaa, Prakash et al. 2009). Enterococcal pili are heterotrimeric and the
pilus shaft contains two minor pilins
1.5.4 Secreted virulence factors
1.5.4.1 Cytolysin
Cytolysin (also called haemolysin) is a bacterial toxin that has β-haemolytic
properties and is bactericidal against other Gram-positive bacteria (Koch,
Hufnagel et al. 2004, Billstrom, Lund et al. 2008). Cytolysin was found in
several E. faecalis and E. faecium isolates and its haemolytic and
food isolates. It is regulated by a quorum-sensing mechanism via a
two-component system (Fisher and Phillips 2009). Clewell (1990) indicated that
cytolysins are generally encoded by highly conserved conjugative plasmids
like pAD1, although they can be encoded chromosomally.
1.5.5 Hydrolytic enzymes
1.5.5 .1 Gelatinase and serine protease
The fundamental role of both gelatinase and serine protease in enterococcal
pathogenesis is assumed to be in generating nutrients for the bacteria by
degrading host tissue; these proteases also have functions in biofilm
formation (Mohamed and Huang 2007). Gelatinase (GelE) is an
extracellular zinc metallo-endopeptidase that is able to hydrolyse
haemoglobin, gelatin and casein, and other bioactive peptides. The gene
(gelE) is chromosomally located and is expressed in a cell-density
dependent manner. The gene sprE is located directly downstream it is
co-transcribed with gelE and encodes a serine protease. Gelatinase is secreted
by E. faecalis strains (Koch, Hufnagel et al. 2004, Fisher and Phillips 2009).
1.5.5.2 Hyaluronidase
Hyaluronidase is a cell surface-associated enzyme. In Enterococcus,
hyaluronidase may act as a virulence factor by hydrolysis of hyaluronic acid
and is associated with tissue damage (Jett, Huycke et al. 1994). The
mucopolysaccharide moiety of connective tissue is effectively
as their toxins across host tissue (Kayaoglu and Orstavik 2004). The gene
encoding hyaluronidase (hyl) is located on the chromosome in both E.
faecalis and E. faecium (Vankerckhoven, Van Autgaerden et al. 2004).
1.5.6 Lipoteichoic acid
Membrane-associated lipoteichoic acids are amphipathic polymers
comprised of a hydrophilic polyglycerolphosphate backbone connected
through an ester bond to a hydrophobic glycolipid tail. Lipoteichoic acids
are common among prokaryotic organisms. For enterococci these surface
molecules have been shown to be identical to the group D antigen (Wicken,
Elliott et al. 1963, Jett, Huycke et al. 1994, Ginsburg 2002). Surface
molecules like D-alanine lipoteichoic acid (LTA) present several roles in
Gram-positive bacteria, for example modulation of autolysin and cation
homeostasis. Alanine esters of enterococcal lipoteichoic acid play a
significant role in biofilm formation and resistance to antimicrobial peptides
(Fabretti, Theilacker et al. 2006).
1.6 Enterococcal epidemiology
Studies of ecology and epidemiology of Enterococcus have stated E.
faecium and E. faecalis are commonly isolated from sausages, cheese,
minced beef, fish and pork. Foods that originate from animals are often
connected with infectivity by Enterococcus species, as they are capable of
surviving in the heating process. Mainly it is the contamination with
with foods from animal origin (Klein 2003, Foulquie Moreno,
Sarantinopoulos et al. 2006).
Kuhn et al (2003) indicated that the prevalence of Enterococcus species
differs across Europe. E. faecalis and E. faecium are the most commonly
isolated species from environmental and clinical sources in UK and Spain.
E. faecium has lower a incidence in Sweden with E. hirae having a higher
isolation rate, while E. hirae in Denmark is the most common species and is
isolated mostly from slaughtered animals.
Resistance to glycopeptide antimicrobials, teicoplanin and vancomycin was
first reported in 1986 in Europe, followed by related reports in the USA in
1987 and in Singapore in 1994 (Leclercq, Dutka-Malen et al. 1992,
Chlebicki and Kurup 2008). From 1989 to 1993, the proportion of
vancomycin resistant isolates in the USA increased from 0.3 % to 7.9 %
(Centers for Disease and Prevention 1993). About 28 % of enterococcal
isolates were resistant to vancomycin in 2003 and the incidence of this
resistance has been rising steadily over the years (National Nosocomial
Infections Surveillance 2004).
In the USA, vancomycin-resistant Enterococcus faecium (VRE) established
mostly in patients exposed to healthcare settings and studies showed no link
between VRE and farm animals in 1990. In Europe and Asia the situation
was different because of the use of avoparcin glycopeptide as a growth
VRE colonisation in animals. The VRE transfer to human subsequently
occurred by direct contact with animals or by eating contaminated products
(Leclercq, Dutka-Malen et al. 1992, Chlebicki and Kurup 2008).
The epidemiology of VRE distribution has been diverse in US with VRE
endemic in hospitals for many years or linked to foreign travel and
consumption of imported food, but colonisation absent in healthy people. In
contrast, in Europe outbreaks of VRE seldom arise in hospitals but have
been isolated from healthy individuals and farm livestock and food (Coque,
Tomayko et al. 1996, Wegener, Madsen et al. 1997, Bonten, Willems et al.
2001).
Pulsed Field Gel Electrophoresis (PFGE) studies discovered similar
PFGE-patterns in humans and animal isolates, not only from the same geographic
region but also from very distinct epidemiological environments
(Stobberingh, van den Bogaard et al. 1999, Hammerum, Fussing et al. 2000,
van den Bogaard, Willems et al. 2002). Amplified Fragment Length
Polymorphism (AFLP) study of VRE populations performed by Willems et
al. (2000) reported 11% of the human clinical isolates associated to clusters
also present in poultry and pig and also found specificity in host
colonisation. Further analyses of gene clusters responsible for vancomycin
resistance and Tn1546 in E. faecium, reported that humans and animal
isolates have identical Tn1546 types, suggesting that horizontal gene
transfer occurs between human and animal E. faecium (Stobberingh, van
Using antimicrobials as growth promoters is an efficient approach of
enhancing productivity and animal health in livestock production.
Avoparcin, which is a glycopeptide, produces cross-resistance to
vancomycin, is an example of a growth promoter that has been used in
agricultural systems in Europe but not USA, particularly in the pig and
poultry industries (van den Bogaard and Stobberingh 1999). Avoparcin has
been proposed as a significant effect in the emergence and spread of
resistance to vancomycin in enterococcal populations (Bager, Aarestrup et
al. 1999) For this purpose, the use of avoparcin was excluded in Denmark in
1995 followed by the rest of the EU in 1997. In addition, Virginomycin is
used as an additive to animal food in agriculture industry and the overuse of
virginamycin could have led to the acquired resistance to steptogramins.
The use of virginamycin was excluded in Denmark in 1998 and through the
EU in 1999 (Aarestrup 2000).
VRE have been associated globally with hospital outbreaks and the
vancomycin resistance gene (vanA) has transferred to methicillin- resistant
Staphylococcus aureus. Evolutionary genetics, population structure, and
geographic distribution of VRE isolated from nonhuman and human sources
and community and hospital reservoirs recognised a genetic lineage of E.
faecium (clonal complex-17) that has spread worldwide. The CC17 lineage
is associated with ampicillin resistance, a pathogenicity island, and is linked
with hospital outbreaks. CC17 is a model of accumulative evolutionary
developments that enhanced the relative fitness of bacteria in hospital
1.7 Antimicrobial Resistance
Enterococcus faecalis and E. faecium have succeeded as nosocomical
pathogens because of their ability to gain and spread antibiotic resistance to
commonly used antibiotics (Leclercq 1997). Two types of antimicrobial
resistance are associated with Enterococcus species, namely intrinsic and
acquired resistance. Intrinsic resistance is chromosomally encoded within
the core genome of all members of the species and occurs naturally, whereas
horizontal transfer of genetic material or sporadic mutations account for
acquired resistance (Hollenbeck and Rice 2012, Gilmore MS, Clewell DB et
al. 2014).
1.7.1 Intrinsic resistance
Enterococcus species are naturally resistant to the most commonly used
antimicrobial classes, for example β-lactams and aminoglycosides, which
are typically affective for the treatment of Gram-positive infections.
Low-level intrinsic resistance is found in Enterococcus species in respect of
resistance to cephalosporins, trimethoprim-sulfamethoxazole and
lincosamide (Leclercq, Dutka-Malen et al. 1992). In addition, Enterococcus
species are frequently resistant to tetracycline, rifampicin, quinolones,
macrolides, chloramphenicol and fosfomycin, and these antibiotics are
rarely used to treat enterococcal infections (Hollenbeck and Rice 2012).
The typical treatment for enterococcal infections is a bactericidal and
synergistic mixture of a cell wall synthesis inhibitor such as a β-lactam
aminoglycoside (streptomycin or gentamicin). However, the efficacy of this
combination has been compromised by the emergence of enterococci with
high-level aminoglycoside resistance (Leclercq, Dutka-Malen et al. 1992).
1.7.1.1 β-lactams
The β-lactam ring is part of the main structure of numerous antibiotic
families for example, cephalosporins, penicillins, carbapenems, and
monobactams. Nearly all of these antibiotics work by inhibiting bacterial
cell wall biosynthesis and they are extremely efficient versus Gram-positive
and Gram-negative bacteria (Thomson and Bonomo 2005).
The reason for the intrinsic resistance to β-lactam agents in Enterococcus is
low affinity of penicillin binding proteins (PBPs) for β-lactams. β-lactams
bind to the PBPs, enzymes associated with the cross linking of pentapeptide
molecules in the peptidoglgcan layer of the bacterial cell wall. The
association of a β-lactam with PBPs disrupts the growth of the bacteria by
weakening the cell wall and resulting in programmed cell death (Klare,
Badstubner et al. 1999, Hollenbeck and Rice 2012).
1.7.1.2 Aminoglycoside
Low-level intrinsic resistance to aminoglycosides is exhibited by all
enterococci including to gentamicin, which is the most common
aminoglycoside used with enterococcal infections. The aminoglycosides
target enterococci by binding to the 16S rRNA of the 30S ribosomal subunit
aac(6')-Ie-aph(2')-Ia are resistant to almost all aminoglycosides including
gentamycin, amikacin, tobramycin, kanamycin and netilmycin, but remain
sensitive to streptomycin (Chow 2000). The enzyme encoded by
aac(6')-Ie-aph(2')-Ia modifies the antibiotic by phosphorylating and simultaneously
acetylating it at two different positions. This impairs the binding of the
aminoglycoside to the 30S ribosomal subunit (Leclercq 1997, Chow 2000,
Hollenbeck and Rice 2012).
1.7.1.3 Streptogramins
Streptogramins target ribosomes at the level of inhibition of translation
through binding to the bacterial ribosome and interfere with protein
synthesis. Resistance to streptogramins appears via a number of
mechanisms involving target modification, efflux, and enzyme catalyzed
antibiotic modification (Johnston, Mukhtar et al. 2002).
Streptogramins show bactericidal activity when they act synergistically as
two components, streptogramin A and B. these components alone show a
weak bacteriostatic activity whereas the combination can act bactericidally
(Kehoe, Snidwongse et al. 2003). Simjee et al (2002) stated that resistance
to both A and B components of streptogramin was found in enterococcal
species, including E. faecium, E. gallinarum and E. hirae.
1.7.1.4 Glycopeptides
Glycopeptides are rigid, large molecules that inhibit cell wall peptidoglycan
disrupt enterococci by interfering with cell wall synthesis by attaching to the
terminal acyl-D-alanyl-D-alanine (D-Ala-D-Ala) of the precursors used in
peptidoglycan synthesis (see 1.5.9.2.5). Several motile species of
enterococci such as E. flavescens, E. gallinarum and E. casseliflavus
express low levels of intrinsic resistance to glycopeptides (Gholizadeh and
Courvalin 2000).
1.7.2 Acquired resistance
Enterococci acquire resistance to many antibiotics via the acquisition of
genetic material or via sporadic mutations. Horizontal gene transfer among
enterococci appears most frequently by the movement of transposons and
the transfer of pheromone-sensitive broad host range plasmids (Hollenbeck
and Rice 2012) and to an unknown extent by phage transduction (Yasmin,
Kenny et al. 2010).
1.7.2.1 β-lactams
Enterococci can express high-level resistance to β-lactams or other
penicillin drugs when there is overproduction of low affinity penicillin
binding proteins (PBPs). Resistance also occurs through acquisition of β
-lactamases or mutations in PBP4/5 targets, which results in poor, or no
binding to these targets (Fontana, Ligozzi et al. 1996). Synthesis of β
-lactamase of high levels may result in resistance to β-lactam antibiotics.
This secreted enzyme is overproduced when the operon repressor protein is
absent and this occurs most often in E. faecalis, rather than E faecium
from all over the world are ampicillin (Zhang, Paganelli et al. 2012).
Plasmid-mediated genes encoding β-lactamases (bla) were first defined in
E. faecalis in 1983. Since then the production β-lactamase in enterococci
has been rare and described mainly in E. faecalis. Genes encoding β
-lactamases in Enterococcus and S. aureus are identical and are frequently
encoded by staphylococcal β-lactamase transposon Tn552. Hollenbeck et al
(2012) suggested that high-level penicillin resistance in E. faecium is
generally related to accumulation of point mutations in the
penicillin-binding region of PBP5. While these point mutations are expected to
originate de novo in single bacteria due to selective pressure from
antibiotics, chromosome-to chromosome mobilisation of low affinity pbp5
genes has been recognised in vitro and is expected to explain the
distribution of high-level penicillin resistance in E. faecium (Rice, Carias et
al. 2005).
1.7.2.2 Aminoglycosides
Most commonly, high-level resistance to aminoglycosides occurs due to the
production of aminoglycoside modifying enzymes which are
plasmid-mediated. These enzymes also nullify the synergistic killing effect of
aminoglycoside in combination with cell wall-active agents (Chow 2000,
Kotra, Haddad et al. 2000). Aminoglycoside resistance due to mutation of
the ribosomal target also occurs as does reduced antibiotic transport. These
1.7.2.3 Macrolides, Lincosamides and Streptogramin B (MLSB)
The term macrolide defines drugs with a macrocyclic lactone ring of 12 or
more elements (Kanoh and Rubin 2010). Macrolide antibiotic include
erythromycin, clarithromycin, and azithromycin (Alvarez-Elcoro and Enzler
1999).
Lincosamide antimicrobials including lincomycin and clindamycin act by
inhibiting peptidyltransferase activity of the 50S ribosomal subunit. This
ultimately interferes with protein synthesis. The gene Inu(B) (linB),
responsible for resistance to lincosamide, encodes the enzyme
nucleotidyltransferase which adenylates a hydroxyl group on the
lincosamide (Tenson, Lovmar et al. 2003).
Type B streptogramins and macrolides act on the 50S ribosomal subunit in a
similar fashion and cause interference in the same binding site. Regularly,
resistance to both classes of antibiotics occurs through a common
mechanisms, for instance, resistance against macrolides, lincosamides and
streptogramins B (MLSB) via enzymatic methylation or mutation of adenine
2058 (Pernodet, Boccard et al. 1988, Vannuffel and Cocito 1996). The
ermB gene borne on conjugative plasmids encodes for resistance to MLSB
by methylating the adenosine residue in 23S rRNA of the 50S ribosomal
1.7.2.4 Streptogramin A
Three main mechanisms are involved in the acquired resistance for
streptogramins (i) acetylation of the antibiotic, (ii) efflux of the antibiotic
and (iii) dimethylation of the 23S rRNA target site. As of now 12 genes in
Enterococcus species have been reported for streptogramin resistance
(Hollenbeck and Rice 2012) .
1.7.2.5 Glycopeptide
For the past 25 years, the acquisition of glycopeptide resistance by
enterococci has been an epidemiological and antimicrobial challenge. In
1988, glycopeptide-resistant enterococci (GRE) were first described. E.
faecium is the species that exhibits greatest resistance to glycopeptides
compared with E. faecalis and other Enterococcus species (Farrell, Mendes
et al. 2011).
The cell wall of Enterococcus is composed mostly of peptidoglycan, with
teichoic acid and polysaccharide. Teichoic acid is found only in
Gram-positive bacteria and not in Gram-negative bacteria (Cheng, McCleskey et
al. 1997). The carbohydrate moiety is cross-linked with peptide side chains
in the peptidoglycan layers. The glycans and the peptides are connected
through amide linkages, which link the carboxyl group of the muramyl
residues and the terminal amino group of the peptides. D-Ala:D-Ala ligase
and MurF enzymes catalyse the addition of D-alanyl-D-alanine to
UDP-MurNAc pentapeptide precursor for peptidoglycan biosynthesis (Neuhaus