Ames Laboratory ISC Technical Reports Ames Laboratory
6-1956
Extraction efficiency of a pulse column of varied
geometry
Lawrence E. Burkhart
Iowa State CollegeR. W. Fahien
Iowa State CollegeFollow this and additional works at:http://lib.dr.iastate.edu/ameslab_iscreports Part of theChemistry Commons
This Report is brought to you for free and open access by the Ames Laboratory at Iowa State University Digital Repository. It has been accepted for inclusion in Ames Laboratory ISC Technical Reports by an authorized administrator of Iowa State University Digital Repository. For more information, please [email protected].
Recommended Citation
Burkhart, Lawrence E. and Fahien, R. W., "Extraction efficiency of a pulse column of varied geometry" (1956).Ames Laboratory ISC Technical Reports. 167.
Abstract
An investigation was made of the effects of plate spacing, hole diameter, percent free plate area, pulse amplitude, and pulse frequency on the extraction efficiency of a 1-in. diameter pulse column. The hexone-acetic acid-water system was used. Two levels of each factor were incorporated in an experimental design based on statistical methods. 'The data were analyzed by the analysis of variance technique.
Disciplines Chemistry
"
[
ISC
-
8
60
CHEMISTRY -GENERAL
UNITED STATES ATOMIC ENERGY COMMISSION
EXTRACTION EFFICIENCY OF A PULSE
COLUMN OF VARIED GEOMETRY
By
Lawrence E. Burkhart
R. W.
Fahien
1une 1956
Ames Laboratory
Iowa State College
Ames, Iowa
F. H. Spedding, Director, Ames Laboratory.
LEGAL
NOTICE
This report was prepared as an account of Government sponsored work. Neither the United states, nor the Commission, nor any person acting on behalf of the Commission: A. Makes any warranty or representation, express or implied, with respect to the accuracy, completeness, or usefulness of the information contained in this report, or that the use of any information, apparatus, method, or process disclosed in this report may not infringe privately owned rights; or
B. Assumes any liabilities with respect to the use of, or for damages resulting from the use of any information, apparatus, method, or process disclosed in this report.
As used in the above, "person acting on behalf of the Commission" includes any em-ployee or contractor of the Commission to the extent that such employee or contractor prepares, handles or distributes, or provides access to, any information pursuant to his employment or contract with the Commission.
This report has been reproduced directly from the best available copy.
Printed in USA. Price $1.25. Available from the Office of Technical Services,
Department of Commerce, Washington 25, D. C.
AEC Technical Information Service Extension
ISC-060 iii
EXTRACTION EFFICIENCY OF A PULSE COLUMN OF VA.~IED GEOJ.JETRY*
..
by
Lawrence E. Burkhart and R. W. Fahien
ABSTRACT
An investieation \vas made of the effects of plate spacing, hole diameter,
percent free plate area, pulse amplitude, and pulse frequency on the extraction
efficiency of a l-in. diameter pulse column. The hexone-acetic acid--,Jater system
vias used. Two levels of each factor uere incorporated in an cxperinental desi2n
based on statistical methods. 'The data ·vrere anR.lyzed by the analysis of variance
technique.
The diameter of the holes in the perforated plates of a pulse column
pro-duced the greatest effect on extraction efficiency of the factors studied.
Per-cent free area procluced only a small effect lJhich was dependent on the degree
of pulsation applied to the column. Extraction effj ciency varied inversely
with pulse amplitude and pulse frequency. The recycle or back mixing, which
exists in the pulse column was postulated to have a profound effect upon ex-traction efficiency.
*This report is based on an I1
:
.s.
thesis by1
956
,
to Iowa State College, Ames, Iowa.lJith the Atomic Energy Connnission.
LR.Hrence E. Burkhart submitted June,
TABLE OF CONTENTS
INTRODUCTION.
DESIGN OF EXPERIMENT.
INVESTIGATION •
Procedure • Results •
Geometry Factors. Pulse factors • Error •
DISCUSSION.
. .
•
.
.
A. Effects of Pulse Amplitude and Pulse Frequency •B.
Effects of the Geometry Factors. Plate Spacing •Hole Diameter • Percent Free Area • Interactions
CONCLUSIONS A~JD Rl~CO~.'XFJimATIONS •
LITEM TURE CITED.
ISC-860
INTRODUCTION
1
In the search for better liquid-liquid contactors, continuous counter-current extractors which utilize mechanical means of agitation from an
external source have been shown to give higher extraction efficiencies
than contactors with no external means of producing the turbulence necessary
for high extraction rates. One such extractor of current interest is the pulse column.
A diagram of a pulse column is shown in Figure 1. Heavy liquid enters from the top of the column and light liquid enters from the bottom of the column. Ordinarily, the size of the holes in the sieve plates in the column is small enough that no counter-current flow due to gravity will occur
through the plates. An up and down pulse is applied to the flUid contents of the column
qy
an externally powered bellows or diaphram-type pulse generator. This pulse generator serves to disperse or mix the two liquid phases and also to pump than through the column.The degree of dispersion in the pulse column depends on the amplitude and the frequency of the pulse. Figure 1 shows the beginning of an upstroke of the pulse generator for a column operating at low amplitude and frequency.
As the bellows contracts, light liquid which has collected under each plate
PERFORATED PLATES
LIGHT LIQUID DISPERSED ON UPSTROKE
HEAVY PULSE GENERATOR
LIQUID 0
[image:8.602.109.487.162.629.2]3
of coalescetla! betwe~n pulses decreases until the fluid in the column appears
to be a rather homogeneous emulsion of fine droplets.
The limiting conditions of now in the extractor are called flooding
points. Flooding is defined as the entrainment of light-liquid phase with
the heavy-liquid effluent or vice versa. Two types of flooding have been
observed in pulse columns. One flooding point, called flooding due to
insufficient pulsation, occurs when the pumping action of the pulse generator
is not sufficient to maintain the required rate of flow through the column
and accumulation results in the end sections. The second flooding point,
called flooding due to excessive pulsation, occurs when the drops of liquid
in the column become so small that the net rate of flow through the oolumn
is less than the rate determined by the superficial flow rates of the two
phases. Once again accumulation begins and the column floods.
In general, the factors which would appear to affect the extraction
efficiency of a pulse column would bet
I. Pulse factors
1. amplitude
2. frequency
3.
pulse shape or form:
n.
Geometry factors1. plate spacing
2. plate hole diameter
3.
percent free plate area4.
column diameterIII. other factors 1. flow rates
2 • . pnysical properties of the system
3.
choice of continuous phaseThe present investigation concerned the effects of plate spacing, hole diameter,
of operation which can be obtained by changing the pulsing conditio~s, the ; o ; ' ( " ' ~ ' i~ ' ' -~ .' . \ I
factors pulse amplitude and pulse frequency were also studied. The
.
,• , systemnethyl isobutyl ketone(hexone)-acetic acid~wate.r was used.
''
DESIGN OF EXPERIMENT
.~--\ '
The purpose of the experiment was to. obtain a broad picture of the effect~
I I ;
of plate spacing, hole diameter, percent free area, pulse amplitude, and pu~se . r _,_. . . . '.
frequency on the extraction efficiency of a pulse cqlumn. The criterion of
extraction efficiency was taken as the
.
(HTU)oE,
the over-all height of a transferunit based on the extract phase. The
HTU
decreases with ~ncreasing extractionefficiency. Before proceeding farther it will be convenient . to
.
define ' certain 'symbols which shall represent the factors studied. Let, the small l~tters s,
d, p represent respectively the geometry factors plate spacing, hole diameter,
.
.and percent free area. Let the small letters a and f rep~.esent the facto:t,"S
pulse amplitude and pulse frequency.
Two levels of each factor were chosen. Each factor was tested at each
level of every other factor, so that 32 different experimental combinations
were required. Each run was repeated three times to provide a measure of the
experimental error. A compatable system of constant flow rates and levels of
each factor under investigation had to be found ·so that the column operated
without flooding for all experimental combinations of factors tested. Now,
'
for a fixed total throughput, the pulse column has two flooding points. The
lower flooding point, flooding due to insufficient pulsation, is a function
of only the pulse factors (2). The upper flooding point, floodi;ng due to
'
excessive pulsation, is a function of both the pulse factors and the. geometry
factors for a given fluid system at a constant total throughput
(9).
Hencethe operating range for a pulse column is sandwiched between these two flooding
points and the permissible values for the pulse and geometry factors are
limited accordingly. On the basis of these considerations, the levels of
factors shown in Table 1 were used. The flow rates were held constant at
36 grams per minute for each phase.
Table 1. Levels of factors studied
Factor Lev~l 1 Level 2
plate spacing l in. 2 in.
hole diane ter 1/32 in. 1/16 in.
'
percent free area 13% 25%
pulse amplitude 0.25 in. 1.0 in.
pulse frequency 25 cpm. 50 cpm.
A split-plot experimental design was employed
(4).
On the main plotsa completely randomized factorial design containing all possible combinations
of levels of the geometry factors s, d, and p was used. Superimposed upon
these main plots were a series of sub~plots, each of which was completely
randomized and consisted of all possible combinations of levels of the pulse
factors a and f. The main plots and the sub-plots can be seen ih Figure
4
w'her~ the· data_. from. the in-vestigation have been arranged on these plots.
The data were analyzed using the analysis of variance technique (4) by
which the effects of the factors were divided into main effects, interactions,
INVESTIGATION
Description of Equiprrent
Two pulse columns were constructed. The first was used as an extracting
column to perform the investigation and the second served as a stripping m lumn
to recover solvent and acid. The columns were of similar design.
The conta,cting section of th~ extraction column ~s composed of short
sections of l-in. diarreter heavy walled glass tubing between which polyethylene
gaskets and stainless steel pe:rforate.d. plates wer~ inserted. Cc;a.lming sections
of 3~in. diameter gla.ss tubing were l9Ciite,o at each end of the contacting
section. The entire assembly was held·toge.ther i~ co~ression by four aluminum
tie rods 1mich extended thr~ugh metal' plates at the top and the bottom of the
c61Uilll,l.
Two sets of glass sections provided the two plate spacings used. In each
case the compression on the column was adjusted 1,mtil the height of too contacti~
section was 18 3/8 in. The four sets of perforated plates used were made of
26 gauge type 316 stainless steel and represented the four combinations of 1/16-in.
and 1/32-in. diameter holes with.l3% and 25% free plate area. The plates of 25%
free area were perforated by the Harrington and King Perforating Company. Plates
which had 13% free area were made by drilling.2~in. square pieces of stainless
stock. All holes were on staggered centers. Because of reports that pulse
column operation is sensitive to the wetting characteristics of the plates (2)
(9), all of the plates were electropolished to a brilliant luster at the beginning
1
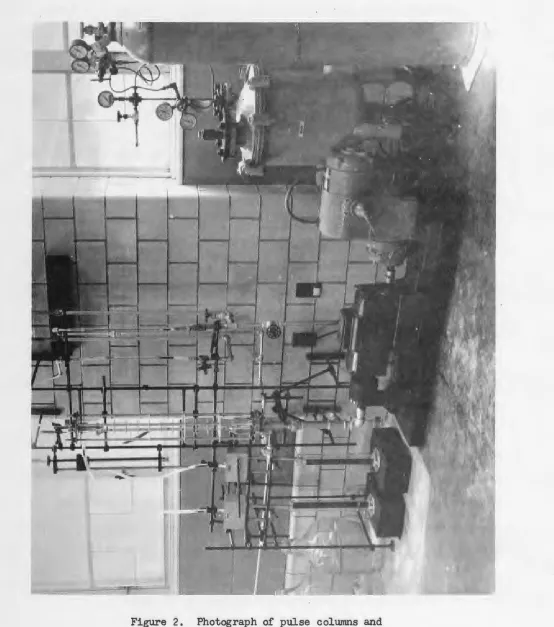
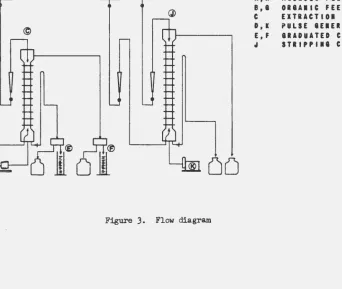
A photograph of the equipment is shown in Figure 2. Figure 3 is a now
diagram of the pulse columns and their associated equipment. The fluid contents
of the extraction column were pulsed by a pulse generator ~de from a Lapp
Pulsafeeder. The pump head was replaced with a brass bellows and the unit
was powered ~~th a U.S. Varidrive v~riable speed drive. A continuously variable
frequena.y of 10 to 125 cycle per minute could be obtained.
Pulse amplitude was measured by a method described by Beyer and Ed~rds (2),
in 1mich a sharp pointed probe connected to a micrometer stem was inserted from
the top of the column down to the air-liquid interface.
Procedure
At the beginning of a run, the column was filled with ~queous phase to a
point about three inches above the top plate. The pulse amplitude and the pulse
frequency were set at the desired values. The pulse generator was started
and flow rates were set at 36 grams per minute for each phase. All runs were
made with the water phase rontinuous and with extraction from the water into
the solvent. The jackleg in the aqueous effluent line was adjusted to maintain
the interface at a point 2
±
o.5
in. above the top plate.After apparent steady-state had been reached, as indicated by a constant
position of the interface, the pulse column was permitted to run for at least
a half hour. 14hen the interface had rerrained constant for a half-hour period,
now rate measurements of 10 minutes each were made until two consecutive
measurements checked vQthin 2%. Samples from each run were analyzed by titration
vrith sodium hydroxide for the aqueous samples and sodium rrethoxide for the
organic samples. Acid concentration in the feed was kept at 15% acid by weight.
Q)
@)
[image:15.599.131.474.144.433.2]QCJ
Figure
J.
Flow diagram"
A,H AGUEOUS FEED TAliS
8,8 ORGAilC FEED TAll C EXTRACTlOI COLUMI
D,l ~ULSE GEIEIATOR E,F GlADUATED CYLIIDERS J STRIPPIII COLUMI
After every four runs, the column was disassembled and rebuilt using
different plates and/or different lengths of glass sections to conform with
the geometry conditions dictated by the design of the experiment.
The organic liquid was distilled at intervals to remove impurities
which had accumulated with time. However, this operation produced no
noticeable effects on the performance of the column.
The (Hl'U) 0E for each run was calculated by graphical integration, using
the approximation of Wiegand (11).
Results
The experimental.data are tabulated in Table
5
(see Appendix). The dataare summarized in Figure
4.
Each number in Figure4 represents the arithmetic
mean value of three runs made at the given conditions.
The general trends of the data cqn be seen by examining Figure
4.
Ingeneral, increasing amplitude, frequency, hole diameter, and plate spacing
resulted in a higher HTU and hence a lower extraction efficiency. The effect
.
.o:f increasing the percent free area of the perforated plates was not so well
defined. In seven out of sixteen cases, increasing the percent free area
.resUlted in a decrease in extraction efficiency. Six of the seven cases in
which efficiency decreased with increased percent free area occurred at
the low pulse amplitude. Hence, for increased petcent free plate area, the
extraction efficiency appeared to increase at high pulse amplitude and to
decrease at low pulse amplitude.
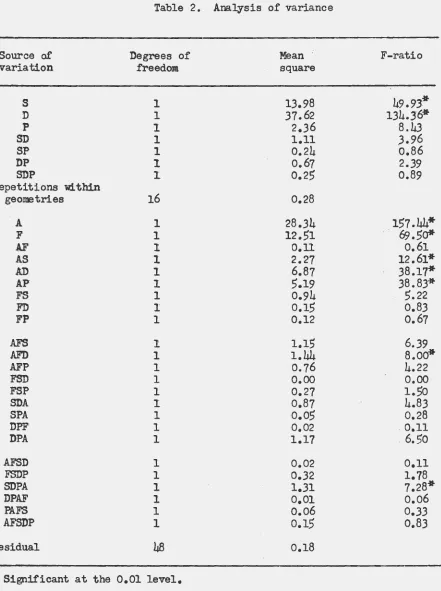
An analysis of variance was made on the data collected. The results are
d,
a,
a2
t,
3.65
6.49
p
I
f2
4.16
7.33
f,
.
3. 91
5.47
p
2
f2
4.71
;
5.61
a
= PULSE AMPLITUDE
f
=PULSE FREQUENCY
s
=PLATE
SPACING
s,
.
.
52
d2
dl
a,
a2
a,
a2
a,
6.55
6.77
4.83
6.81
6.26
6.43
7.48
6.33
.
7.56
7.09
5.96
6.29
4.77
6.12
6.81
6.26
.
7.32
-
6.40
6.33
.
7.68
d =HOLE
DIAMETER
[image:17.597.62.687.108.469.2]p
=PERCENT FREE AREA
Figure
4.
SUllillary of data arranged on .main plots of s, d, p, ld th aand f as rub-plots. Each value is the mean of ~hree repetitions.
I
I
d2
a2
6.98
8.28
7.05
.
..
7.29
Table .2. Analysis of variance
Source of Degrees of Mean
'
F-ratio,variation freedom. square
s
1
13.98
49.93*
D
1
37.62
134.3'6*
p I
2.36
8.43
SD I
1.11
;3.96
SP
1
0.24
0.86
DP 1
0.67
2.39
SDP L
0.25
0.89
Repetitions
within
geometries
16
0.28
A
1
28.34
157.44*
F
1
12.51
69.5o*
AF 1
0.11
0.61
AS 1
2.27
12.61*
AD I
6.87
38.17*
AP 1
5.19
38.83*
FS
1
0.94
5.22
FD 1
0.15
0.83
FP
1
0.12
0.67
AFS !
1.15
6.39
AFD
1
1.44
8.oo*
AFP l
0.76
4.22
FSD
1
o.oo
o.oo
FSP 1
0.27
1.50
SDA !.
0.87
4.83
SPA
1
0.05
·
0.28
DPF
1
0.02
.
0.11
DPA
1
1.17
'
6.50
AFSD
1
0.02
0.11
FSDP
1
0.32
1.78
SDPA
1
1.31
7.28*
DPAF 1
.
0.01
o.o6
PAFS 1
0.06
0.33
AFSDP
1
0.15
0.83
Residual
48
0.18
[image:18.599.59.500.82.673.2]13
'
was less sensitive to the effects of the geonetry factors, s, d, and p, than
to the effects of the pulse factors, a and f. Thus the error term used in
testing for statistical significance of main plot effects was greater than
the error term used for testing sub-plot effects.
Geo~etry Factors
Previous investigators (1) (3) (6) have used the product of pulse amplitude
times pulse frequency, called the (af) product, as an index of the amount of
agitation supplied to the pulse column by the pulse generator. Pulse ampl~tude
was measured in inches per cycle and pulse fre:quency was measured in cycles
per minute. The (af) product then had the dimensions, inches per minute .•
In this work, as in previous pulse column work, the pulse amplitude was
considered to be the linear displacement of the fluid contents of the column
from one extreme position to the other. Thus the (af) prod~ct represented
a measure of the linear displacement per minute of the liqu;Ld in the column
by the pulse generator.
The main plots of the geometry factors of Figure
4
were rearranged intofour groups, using the (af) product as a parameter. These four groups are
shown in Figure
5.
The effects of the geometry factors were tested forsignificance at each value of the parameter by means of a t~test (4). for
the difference between the means of the two levels of
a
geometry factor. Theresults are given in Table
3.
Hole diameter affected extra~tion efficiencyat all four conditions of puls~tion. No effect of percent free area was
demonstrated at the two low (af) products and no effect of plate ~acing was
sa
s2
s,
s2
d,
d2
d,
d2
d,
d2
d,
d2
PI
3.65 6.55
4.83
6.26
PI
6.49
6.77
6.81
6.98
p2
3.91
5.96
4.77
6.81
p2
5.47
6.29
6.12
7.05
- - ___ _ _ j
A.
(af)
PRODUCT
=
6.25 lN./MIN.
B.
(of)
PRODUCT
=
25 IN/MIN.
s,
s2
s,
~
dl
d2
d,
d2
dl
d2
d,
d2
~
4.16
6.43
6.33
7.09
~
7.
33
7.48
7.56
8.28
~
4.71
6.26
6.40
7.68
p2
5.61
132
6-33
7.29
--~ - - ---
[image:20.593.75.698.64.472.2]-C.
(of)
PRODUCT
=
12.5 lN./MIN.
D. (
af)
PRODUCT =50
lN./MIN.
Figure
5.
Main plot geometry factors broken dow.n into groups using..
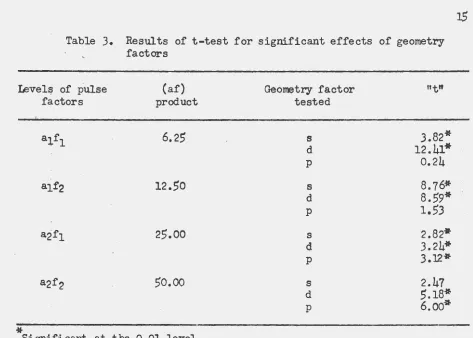
Table
3.
Results of t-test for significant effects of geometryfactors
Level~ of pulse factors (af) product 12.50 25.00 50.00
*
Significant at the 0.01 level.GeollY;3try factor tested s 9 p s d p s c;1. p s d p
"t"
3.82*
12.41*
0.24a.
76*
8.59*
1.5)
2.82*
3.24*
3.12*
2.475.18"*
6.oo*
A,ll tests of significance were ms.de at the 1% level. Hole diameter
produc~ed the greatest effect followed by plate spacing and percent free
area.
Pulse Factors
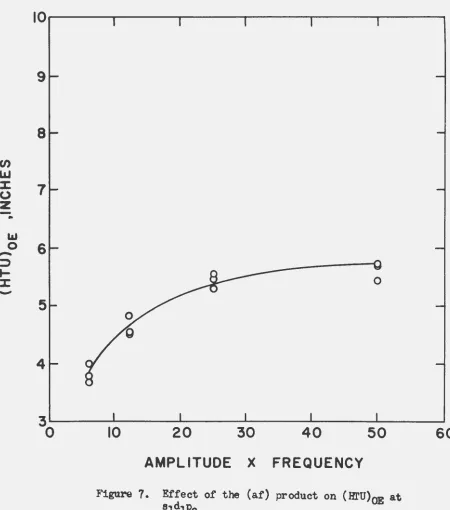
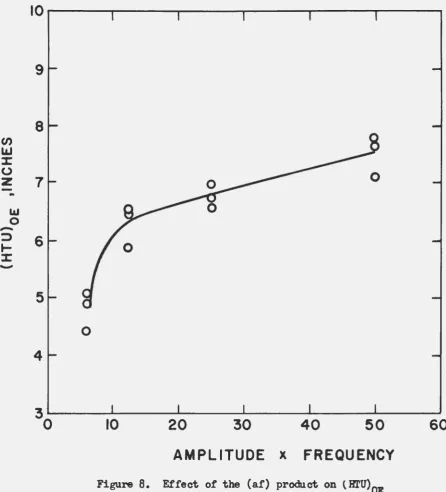
The value
o1
HTU as a function of the (af) product ~~s plotted inFigures 6 through 13 for each combination of levels of the geomet~ factors.
The best extraction efficiency (lowest HTU) was obtained at the lowest
levels of amplitude and frequency (af=6.25 in./mtn.). The HTU appears to
be more sensitive to pulsing at low (af) products. The curves rise rapidly
•
and then begin to level off at the high values of the (af) product, indicating
[image:21.601.60.533.50.388.2]CJ)
LLJ
:I:
u
z
-
..
L&.l 0
-
:::>
...
:I:
-9
8
7
6
5
4
3~----~---~---~----~---~---~
0
10
20
30
40
50
60
AMPLITUDE
x
FREQUENCY
(f)
LIJ
:I:
u
z
-
..
1.&.1 0
-
::::)....
:z:
-17
10~----~----~---.---.---.---.
9
8
7
6
5
4
0
10
20
30
40
50
[image:23.599.86.536.155.665.2]AMPLITUDE X FREQUENCY
Figure
7.
Effect of the (af) product on (Hl'U)OE atsldlp2
en
~
:I: (.)
z
-
..
l&l 0-
::::)~
:I:
-10~----~---~----~---~---~----~
9
8
7
6
5
0
4
10
20
30
40
50
[image:24.600.69.516.148.640.2]AMPLITUDE
x
FREQUENCY
Figure 8. Effect of the (af) product on {Hl'U) 0E at ~d1p1
Cl)
&A.I
l : (.)
z
-
•&IJ
0
-
::;) ~ l :-19
10---~---~---r----~
9
8
7
6
5
4
0 0
10
20
50
[image:25.597.88.541.168.667.2]AMPLITUDE
x
FREQUENCY
Figure
9. Ettect
ot
the (at) product
on (BTU)OEat
12d].P2lOr---~---~----~---~----~----~
9
0
8
0CJ)
LIJ
:l:
7
<.,)
z
-
..
"'
6
0q,
0-
~ 0
t-::1:
0
-
5
4
10
,.
20
30
>.40
50
60
AMPLITUDE
X
FR'E:QUENCY
.
·.
Figure 10. Effect ot the (at) product on (HTU)oE
[image:26.599.67.518.147.652.2]Cl)
l&J
~
0
z
-
,. I&J 0-
::::)t-:I:
-21
10---~--~~---~~---~
9
8
7
6
5
4
0
0 0
0 0
10
20
30
40
50
[image:27.600.90.534.169.645.2]AMPLITUDE
x
FREQUENCY
Figure 11. Effect of the (af) product on (Jfl'U)oE at
B1d2P2
C/) LLI
:::r:
(.)
z
-
..
l&J
0
-
::J
t-:::r:
-10~----~---~---~----~---~---~
9
8
7
6
5
4
0
0 0
8
010
20
30
40
50
[image:28.593.62.517.140.647.2]AMPLITUDE
X
FREQUENCY
Figure 12. Effect of the (af) product on ( Hl'U)oE at s2~p1
.,
CJ)
LLJ
::r::
0
z
-
..
I.&J0
-
::)~
::r::
-23
10~---r---~----~---~----~----~
9
8
7
6
5
4
0
0
0
10
20
30
40
50
AMPLITUDE
XFREQUENCY
Figure 13. Effect
ofthe (a£) product on (HTU)oE at
82d2P2
[image:29.600.86.529.152.664.2]degree of pulsation at high (af) products. HTU varied directly with both
pulse amplitude and pulse frequency. Pulse amplitude produced a greater
effect than pulse frequency on extraction efficiency. It should be recalled,
however, that amplitude was varied fourfold while frequency varied only
two-fold.
\. 'With two exceptions, the error in the acid material balance for a
run was less than
5
percent. For runs 21 and 22 the error in the materialbalance was
5.05
percent and5.75
percent, respectively. The standarderror for a single run in terms of HI'U was ;±0.
42
in. The standard error of the mean for three runs made at the same conditions was*
0.24 in. A pictorialrepresentation of the precision of the data can be seen in Figures 6 through
13.
The error term for ~repetition within geometries" in Table 2 includederrors introduced by disassembling and rebuilding the pulse column to change
the levels of the geometry factors for the experiment. An F-ratio (4) of
this term with the "residual" error term gave a value which was not
statistically significant at the 0.01 level. This result means that no
detectable error was introduced by disassembling and rebuilding the column.
Hence a satisfactory method of changing the levels of the geometry factors
was used.
DISCUSSION
A. Effects of Pulse Amplitude and Pulse Frequency
Photographs of the column were taken to show the drop size and the
25
and frequenqy (a1f1) and at high pulse amplitude and frequenqy (a2f2). The
levels of the geometry factors used lvere: 2-in. plate spacing, 1/32 -in.
hole diameter, and 25 percent free area. However, the pictures are
repre-sentative of column operation at these pulsing conditions for all combinations
of levels of the geometry factors. Figure 14 was taken at fllfl shortly
after
the
beginning of an upstroke of the pulse generator and shows 1dropletsof the organic solvent rising up through the plate perforations and into
the aqueous phase above the plates. Figure 15 was talren at the end of an
upstroke of tm pulse generator but before the beginning of a downstroke.
This picture shows the coale~;;cence which occurred between pulses at low
amplitude and frequency. A picture of the pulse column during the
down-stroke can be inferred from Figure 15. During the downdown-stroke, aqueous
phase from above the plates was pulled down through the plate perforations
and through the thin layer of organic phase below the plates.
. . '
Figure 16 was taken at a2f2 during an upstroke of the pulse generator.
This photograph could lvell represent a picture taken at any tine during
column operation at this pulsing condition since no coalescence and
redis-persian could be detected. Rather, the two phases gave the appearance of a uniform emulsion of fine droplets at all times.
These photographs show a marked decrease in drop size at the two
extreme levels of pulsation. The increased velocity of the.fluids through
the plate perforations and the increased turbulence within the column
produced smaller drops and thus created a greater interfacial area between
the two phases. The increased velocity of the fluids through the plate
perforations should increase the mass transfer coefficient ?Y decreasing
at an amplitude of
0,25
in.and a frequenqy
of
25
cpm.
(alfl);
taken just
after the
beginning
of
an upstroke of
the
pulse
[image:32.600.24.547.37.718.2]Figure 1). Photograph of the pulse column operating at an amplitude of 0.2) in. and a frequency of 2) cpm. (alfl); taken at the end of an upstroke of the pulse generator.
29
Now the rate of mass transfer, dN, in a differential height of column, dH, is written:
where, KE = over-all mass transfer co-efficient based on the extract phase
a.
=
interfacial area per unit volume1.
(C~ - C)
=
solute concentration gradient (driving force for mass transfer).Throughout the investigation the mass transfer decreased with increasing values
of the (af) product. If KE and ai both increased then (C§ - C) must have decreased
considerably in order to cause the rate of mass transfer to decrease.
The decrease in the
concentr~tion
gpadient,(C*-
C), with increasing valuesof the (af) product was caused by forced recycle," or back mixing, within the pulse column. Edwards (2) derived an equation for predicting flooding due to
insufficient pulsation in a pulse column to which a sinusoidal pulse was applied.
In deriving this equation he found an expression for the downward rate of flow,
qd,
9f
liquid through the column. The column flooded when qd was less thanL,
where L represented the flow rate of the heavy phase entering from the top ofthe column. When qd was greater than L the column operated without flooding
but a condition existed in which liquid in the column was recycled. This forced recycle, or back mixing, represented the return of an amount of liquid back
from whence it came. Hence during normal column operation, where qd must be
greater than L, some liquid was recycled and passed through a single plate
more than once. The result was that some cocurrent flow was superimposed-upon
the countercurrent flow of both phases. Edwards made a similar analysis of the
rate of flow of fluid through the column on the upstroke of the pulse generator.
The recycle rate was found to be equal for both upstroke and the downstroke.
The equation presented for recycle rate was:
where,
V r = af A co sh Q ... G - t
2
Vr =· recycle rate, mi./min.A = cross-sectional area of the column·
a
=
pUlse amplitude~ cin./cyclef
=
puls·e frequency, cycles/min.· G ::: flow rate of org<inic' phase, rnl./min.
L
=
fl-ow rate of aqueous phase,. mJ../m:in.,'•.
The ;recycle 'o:r;' back rnixi;ng Which pcqurs in a. pulse column repr~sents
a. d~ter:iorat.iop of: i(ru.e countercurrent flo"i a,nd q~c;;rea~es the dri v;ing force qr
. , , I I.
. .
concentration gradient which is ava~lable for ma~s transfer. Consta.rt flow rates
of
35
mi./min. for the aqurous phase ~nd44:5
·
rnl.(min. for the organi,c pha~ewere used in this investigation. 'For these flow rates, the recycle rates
ca+-. . ..
CUlated· from Edwards I equatio~ ,for eac}1 V~'lue Of the (af) product USed is
pre.,.-pented irr Table: 4~ The recycle r~ te, increased rapidly with increased pvlsation.
. ' ···. •' . .
[image:36.600.48.525.109.412.2]At low (af) products~ where-coal~sc~nce of the' phases occurred as shown in
Figure
15,
.the recycled liquid consisted of aqueous phase during the downstroke . ..
aild a mixture of both aqueous and organic phases on t,he upstroke. When pulsa..:..,tion was more vigorous,as shown in_Figure 16>the recycled liquid was composed
of aqueous and organic pha~es during both the upstroke and the downstroke of
· the pulse genera tor •.
As the (af) product is increased the increased interfacial area and the
increas-ed tU!!bulence tend to increase the extraction efficiency of the pulse
31
column. The increase in the.recycle rate tends to decrease the extraction
efficiency. Another factor which tends to decrease the extraction efficiency
at high (af) products is the lack of coalescence and redispersion of· the phases
between pulses. At low levels of pulsation, the two phases coalesce between
pulses and are then redispersed. In studying extraction from single drops,
Licht and Conway (8) found that, for the same liquid system used in the present
Table
4.
.
Recycle rates at different values of (amplitude x frequency)Rec:y cl~ rate Recycle rate
a x f ml./cycle ml../min.
6.25
1.3433.53
12.50
2.30
114.7925.00 11.29 282.21
)0.00 12.38 619.28
investigation, about 13 percent of the extraction occurred during drop formation
and another 8 per cent of the extraction occurred during drop coalescence.
Sherwood, Evans and Longcor (10) studied ext~action from single drops in columns
of different heights. The results were plotted and the curve obtained was
extrapolated to zero column height. For the hexoneacetic acid-water system,
about 40 percent of the extraction appeared to occur during drop formation.
If the two phases coalesce between pulses, then fresh surface for mass
transfer is created when the phases are redispersed. However, as the (af)
Finally a point is reached where the size of the drops is of the same order of
magnitude as the holes in the perforated plates. At this point many of tne
drops would merely be "massaged" or deformed in passing through the plate;:;,
while a few larger drops may be broken into smaller drops. Although thi~;~
massaging action helps znq.ss transfer,' by creating eddies within the drops, it
would not be as effective as the creation of fresh interfacial surface w0ich
ocqurs. at low (af) products where the phas~s coale~c~ and are then redisrer~ed.
For the range of pulse column operation covered in this investigation,
the recycle rate controlled e~traction effi.c:Lency ,for a given column geometry.
Apparentf.y th~ recycl-e rate WBrS sU;ffic~ent. to overqowe the · effects wh:Lch tended
to iroproye e~traction efficiency a$ the valve of the (af) product was increased.
However, this may not be the ca~e for different fluid systems. The ease of
dispersion of the liquids due to their physical properties and to the
plate-wetting properties which influence drop formation in a pulse column may cause
the effects which tend to increase extraction efficiency to control extraction
for other fluid systems. For example, liquids with a low interfacial tension
are easily dispersed. If such a system were used in the pulse column, then good
dispersion could be obtained at relatively low values of the (af) product,
where the recycle rate is low. In this case the extraction efficiency would
probably increase vli th increased pulsation before the recycle rate became large
enough to cause extraction efficiency to decrease. This would cause a plot of
HTU versus (af) product to be concave uptvard.
The flow rate ratio is an important factor which was held constant in this
investigation. The relative magnitudes of the effects which tend to increas(3.
33
for different flow rate ratios. Belaga and Bigelow (1) studied the effects
of pulse amplitude and pulse frequency on HTU using the same fluid system as was used in this investigation. The flow rates were also the same. The curves presented of HTU versus (af) product were comparable to those shown in Figures
6
through 13. Cohen and Beyer
(5)
extracted boric acid from isoamyl alcohol withwater. At (af) products from
5
to30
in./min. the H.E.T.S. (height equivalent to a theoretical stage) decreased from23
in. to 12 in. The dispersed tocon-tinuous phase flow rate ratio was 5:1. Sege and Woodfield (9) reported that, for a complex uranium extraction system, a plot of HTU versus (af) product was concave upward for (af) products in the range 20 to 70 in./min. In view of these results the relationship between flow rate ratio and the (af) product should
be investigated. Extraction efficiencies for different fluid systems should also be compared to see if the curve of HTU versus (af) product has a characteris-tic shape or if the shape of this curve varies widely with the extraction system being employed. Such information would be useful in predicting the proper
operating conditions for pulse columns.
Many of the curves of HTU plotted against the (af) product shown in Figures
6 through 13 have a hump at an (af) product of 12.5. Hayworth and Treybal (7) studied drop si~e as a function of velocity through a nozzle. They concluded that drop size was uniform and increased with velocity up to a velocity of 10 cm./sec. At higher velocities the drop size decreased and became less uniform. This phenomenon could explain the fact the HTU decreased slightly at an (af)
B. Effects of the Geometry Factors
Plate Spacing
Plate spacing affects extraction efficiency through the property of the
plates of redispersing the liquids as tl1ey flow through the extraction column.
This creates fresh interfacial surface for mass transfer between the two phases.
The first perforated plate or sieve plate columns were developed because of
reports that th~ rate of extraction in a spray column was greatest in the
im-mediate vicinity of the inlet distributor for the dispersed phase. This led to
the idea of providing many distributors by placing perforated plates at regular
'
intervals up the column, thus taking advantage of the higher extraction rate which
occurred near the distributor. Sieve plate columns were built and tested.
They are used today but their use has probably been limited because of the lack
of performance data.
Close plate spacing gives better extraction efficiency in the pulse co~umn
by redispersing the two fluids more frequently as they pass through the column. Only two levels of plate spacing were used in this experiment. Future work
involving this factor should include levels of plate spacing·from approximately
1/2 in. up to large spacings where spray column operation is approached. For very small plate spacings the diameter of the holes in the perforated plates
may have to be large in order to obtain satisfactory column throughput capacity.
Hole Diameter
Hole diameter affects extraction efficiency in the pulse column by changing
35
(7) showed experimentally that drop size decreases with a decrease in the
di-ameter of the nozzle from which a stream of liquid is issuing. Fieure
4
showsthat the HTU decreased 1-vi th a decrease in the diameter of the holes in the
perforated plates. The smaller diameter holes produced smaller droplets, thus
increasing the interfacial area between the two phases.
Hole diameters which have'been used in pulse columns lie in the range
1/32 to 1/8 in. Th~ hole diameter must be .chosen with respect to both extraction efficiency and throughput rate. Another factor to be considered is clogging of
small diameter holes. This investigation showed that the hole diameter should
be as small as is consistent with the above requirements. Holes smaller than
1/32-in. diameter would probably limit the capacity of a pul.se column
consider-ably and the value of 1/32 in. would be an approximate lower limit for hole
diameter in future investigations. A hole diameter of 1/8 in. is a popular
size for larger diameter pulse columns and additional work should include this
value for the hole diameter.
Percent Free Area
Percent free area of tile plates produced only small changes in the extraction
efficiency of the pulse column over the range of conditions studied. For small
holes, the percentaee of perforated area that can be produced in a plate is
limited to about
30-35
percent for perforating presses. Approximately the samelimit would apply from consideration of the strength of the resulting perforated
plate. Thus the range of percent free area covered in this investigation
represents the probable range of the factor from a design standpoint. Values
The factor percent free area could probably be set at some value in th~ range
of
25
percent in future investigations.Interactions
The results of the analysis of variance showed two-factor interactions
between amplitude-plate spacing, amplitude-percent free area, and
ampl~tude-hole diameter• The first two interactions can be seen from the re~ults of 1;1:1e
t-test ap~lied to the geometry factors. No effect of plate spacing on ext~action
efficiency could be detected at tne highest level of the (~f) product,-a
2
f 2, whilean effect on extraction efficiency was d~monstrated at the three lo~er levels
o~ the (af) product. ~opposite case occurred for the effect of-percent fr~e
area. No effect of percent free area could be detected at the two low.levels of the (af) product, a1f 1 and a1f 2 while an effect was demonstrated at the
two high levels of the (af) product, a2f 1 and a2f 2• Although hole diameter
produced an effect on HTU which could be detected at all levels of amplitude
and frequency, the interaction effect which appeared in the analysis of
vari-ance can be seen by comparing the results presented in Figure
4.
,
Any interpretation which might be given for these interactions would be
clouded by the unknown effect of liquid recycle in the column. Consider the
figures for recycle rate presented in Table
4.
From Table4
it is seen thatboth amplitude-frequency combinations which contained a1 were at the two low .
recycle rates while the two amplitude-frequency combinations which contained
a2 were at the high r~cycle rates. It has been postulated that this recycled
liquid produces a profound effect upon the operation of a pulse column;
37
geometry factors should be made from data taken at the same recycle rate. ,This
discussion points out another phase of investigation on the pulse column which
should be studied -- the relationship between pulse amplitude, pulse frequency,
the (af) product, and their effect on extraction efficiency. The question
arises whether the (af) product, regardless of the combination of amplitude
and frequency which produces it, is the main factor to be considered or whether
amplitude and frequency should be considered separately. In Table
4,
the recyclerate in cm.3 per minute increases almost linearly with the (af) product, whereas
the recycle rate in cm.3 per cycle shows a sharp break between the two low (af)
products and the two high (af) products. An experiment in which the extraction
efficiency of a pulse column is studied at various combinations of amplitude
and frequency which produce a constant (af) product would provide information
on this subject.
CONCLUSIONS AND RECOMMENDATIONS
1. The geometry factors plate spacing, hole diameter, and percent free
area all affected the extraction efficiency of the pulse column within the
range studied. Hole diameter produced an etfect at all levels of pulsation
investigated. The effect of plate spacing was significant at (af) products of
6.25, 12.5,
and25
in./min. The effect of percent free area was significantat (af) products of
25
in./min. and50
in./min.2. Pulse amplitud~ and pulse frequency both affected extraction efficiency
although the effects of amplitude, frequency, and the (af) product were not
clearly defined. Extraction efficiency was highest at the lowest value
(6.25
in./min.) of the (af) product regardless of the levels of the geometry factors.
-
.
For r<·m~·.:c of opcrntion CO'Jerccl, t.l1E: ct cf-fichm_c~r o:: t~ c pul se colw.m c.-t. different l evel s o nlls~:Liun 1JaG cnntrollocl
by the rGc~rcJ.e l'<J.tc 1.i tld.n the colunn.
l+. The results of the im·estiE::1.i,ion Here re)orted by statistical anal=rsis,
at the '.1.01 sicnific<tncc le,...-el. ·~-ldn nethod of .1pproc.>ch ;-Jas sr:cces:c.ft:l :i.:.1 scpnr
-!."'.tin~ the effects oj ~11c fn.ctors iJ ".res Li:~nted j_n the >rcscnce of CXJ)crj_mCntnl
et'ror. ".i'he method also rrovided n.n objcctJ vG vic~" 0f the rc]')roclucihili ty of the
cla tn and of tlte reliabilit~r of the res1.1l ts. St<JEclnrr~ Ol'ror for the imli vicual
As :1 resul t of thi..s investigation, the follov.ling rccommcm1at\.rms are made
for further TrJOrk.
1. 'I'he effect 0£' hole diameter on the extraction efficieac~' of a pulse
colur.n should be investicated at several levels to rleterncinc the nature of tbe
effect. !tddi tional 1.ork Hi th this factor shoulrl incluc;e n hole rl:l.an~tcr of
1/0 in. ~in co this is a cornmon value ~JJ,ich is PserJ. i""l
" c ··~:::r:crci.'!l J)t~lsc:; collU~ms.
A lmmr l:!.r:li t of hol e diameter could lie taken D.S l/J2
in
.
2. 'l'lle effect of ~late spncin;_; on the extr:-:.c-L:Lnn ci'i'Lcienc;: of ~ rulsc
column should be investicatcd furtlter. I:ult:i.:;lc l cvclG of rlnte spn.cin;: shoulr1
be studied to deterr:rLno the nn turc of its effect on extraction e~f'icicncy.
3. Percent frec- Rrea should be fixed at some value ne~lr 25 pF·rcent i n
future investigation~ :mil f;.Jrthcr work on this :Cac~or :.:houlrl lJc cJelnycrl until
the effects of more ir:1portant factors have been consi(1crcc1•
J
-1
.
Pnlse amplitude and rmlse freq··.wnc;r should be Jncluder1 in future in-vestigR tions of the effects of pulse column georrP.try factors Rnd tlte experiments
39
5.
The effects of flow rate ratio on extract~on efficiency s~ould bestudied at various pulse amplitudes and pulse frequencies.
6.
The individual effects of pulse amplitude and pulse frequency at fixedl.. Be1aga, N, "vl. and Bigelow, J. E.,
u.
S • . ~tomic Energy Cornr11.ission ReportKT-133. 1952.
2. Beyer, G, H. and Edwards, R. B., U. S. Atomic Energy Commission Report
ISC-553. 1954.
3. Chantry,
vi.
A .• , Von Berg, R. L., and 1rliegandt, H. F., Ind. Eng. Chem.47, 1153-1159. 1955.
4. Cochran, ·,;. J. and Cox, G.
r;
.,
E.""<perirnentfl1 Designs. Nev< York.John l:iley and Sons, Inc. 1951.
5.
Cohen,n
.
1
:
.
and Ee:yer, G. E., Chcm.Enc.
Pro;::;,L?,
27?-286. 19)3.6. Griffith, U. 1., Jasn;:,r, G. R.., u.nd 1u?pcr, 1!. T,, U. S. Atomic Energy
ComFlission Report AECD-3LI4o. 19)2.
7. I-la:y-vmrth, C. B. and Treyba1, R. E., Ind .• Enc. Chern. 42, 117l~-118l. 1950.
e
.
Licht, II. and Comray, J, B., Ind, Enc;. Chem. L~2, 11)1-11)7. 1950.9. Sece, G. and Hoodfie1d, F.\-'!,, Chem. Enr;. Prog.
5o,
396-1~02. 1954.10. Sherwood, T. l\., Evans, J. E., and Lone cor, J, V. A., Ind. Enc;, Chern,
31, 11UL-115o. 1939.
/
(,
Table 5.
Run Pulse Pulse Plate Hole No. amplitude frequency spacing diameter
(inches) (cycles/min) (inches) (inches)
8 0.25 25
-
1.06 0.031215 26
6 0.25 50 1.06 0.0312
16 27
7 1.00 25 1.06 0.0312
14 25
'-.1.06 ::_
5 1.00 50 0.0312
13 28
47 0.25 25 1.06 0.0312
59 92
48 0.25 50 1.06 0.0312
57 89
46 1.00 25 1.06 0.0312
58 -90
45 1.00 50 1.06 0.0312
60 91
Calculated data for individual Tuns
Free Acid in Acid in Acid in area feed solvent extract
(%) (gm/gm H) (gm/gm L) (gm/gm L)
13 0.1754 0.0105 0.1084 0.1754 0.0106 0.1169 0.1754 0.0104 0.1.141
13_ 0.1754 0.0105 0.1053 0.1754 0.0106 0.1138 0.1754 0.0104 0.1.137
13 0.1754 0.0105 0.0545 0.1754 0.0106 0.1 46 0.1754 0;0104 0.1.011
0.1754 0.0943
13 0.0105
0.1754 0.0106 0~0978
0.1754 0.0104 0.0981
25 0.1767 0.0100 0.1137 0.1754 0.0100 0.1119 0.1771 0.0102 0.1135
25 0.1767 0.0100 0 .. 1094 0.1754 0.0100 0.1102 0.1771 0.0102 0.1110
25 0.1767 0.0100 0.1062 0.1754 0.0100 0.1045 0.1771 0.0102 0.1058
25 0.1743 0.0100 0.1050 0.1754 0.0104 0.1045 0.1771 0.0102 0.1051
,Acid in (HTU)OE
raf'finate
(gm/gm H) (inches)
0.0553 3.86 0.0530 3.55 0.0527 3.53
0.0590 4.51 0.0544 3.70 0.0565 4.28
o.o688 7.12 0.0670 5.89 0.0666 6.47
0.0710 7.32 0.0727 7.44 0.0711 7.23
0.0578 4.02 0.0522 3.81 0.0543 3.89
0.0586 4.64 0.0608 4.60 0.0590 4.88
0.0261· 5.37 0.0633 5.57 0.0624 5.48
0.0637 5 .. -43 0.0647 5.70 0.0639 5.69
Material-balance
(%error)
-1.08 +1.56 -1.04 -1.62 -1.39 -0.35 -2.17 -0.70 -1.57 -1.99 -0.86 -2.44 +0.50 -2.41 +0.35 -1.21 +0.~4
+0. 7
[image:47.593.79.719.130.473.2]Table 5. {continued)
Run
Pulse Pulse Plate 'Hole Free -Acid in Ac~d in Acid in Acid in (HTU) 0E ·MaterialNo. amplitude frequency spacing diameter area feed solvent extract raf.finate balance
(inches) (eye les/min) (inches) (inches) (%) (gm/gm H) {gm/~m L) fgm/gm .L) {gm/gm H) (inches~ (%error)
-4 0.25 25 1.06 0.0265 13 0.1754 0.0105 0.0916 0.0783 8.43 -0.18
22 0_.1754 0.0104 :0.1009 0.0616 6.02 -5.75
80 0.1754 0.0100 0.1068 0.0613 5.19 -0.87
3 0.25 50 1.c06 0.{)625 13 0.1754 0.0105 0.0946 0.0759 7.59 +1.62
23 0.1754 0.0104 0.1041 0.0648 5.76 -1.96
77 0.1754 -o.OlOO .0.1034 0.0647 5.93 -0~30
1 1.00 25 1.06 0.0625 13 0.1754 0.0105 0.0955 0.0712 7.04 ~0.12
21 0.1754 0.0104 . 0.'0996 "{).0659 6.58 -5.05
78. -0.1754 0.0100 -{) .1004 0.0688 6.70 -0.17
2 1.00 50 1.06 0.0625 13 0.1754 0.0105 o.og66 0.0712 6.88 -0.54
24 '0.1754 -0.0104 0•0976 :0.0723 7.41 -1.75
79 o.-1754 0.0100 0.0957 -o.0762 8.16 -0.52
42 0.25 .25 1.06 0.0625 25 0.1743 0.0106 0.1018 0.:0641 6.:06 -2.44
52 0.1754 0.0100 {).1057 ;().0635 5.85 +0.86
61 0.1754 0.0101 0.1029 0.0646 5.98 -1.21
41 0.25 50 1.06 0.0625 25 {).1743 0~'0106 0~1025 0.0693 6.36 +0.20
51 0.1754 0.0100 0.1041 '0;()671 5.92 +1.04
64 -0.1754 ·0.0102 ---o.i020 ;(). 680 6.49 -0.52
44 1.00 25 1.06 0.0625 25 0~1743 0.0106 0.1014 0.0685 6.36 -1.22
50 :0.1754 0.0100 Q.1038 ''0.0694 6.14 +1.92
62 0 .. 1754 :0.:0100 -0 .. 1014 0.0668 6.36 -1.04
43 1.00 '50 1.06 0.0625 25 {).1743 0.0106 .0.0981 0.0741 7.47 -0.50
49- 0.1767 :0.0100 .... 0.0990 . 0.071.8. 7.23
~:~~
-63~ 0.1754 0•0102 :0,.-0990 -().0731 7.26
Cl
[image:48.599.57.716.109.472.2](\
Run Pulse Pulse Plate Hole
No. amplitude frequency spacing diameter
(inches) (cycles/min) (inches) (inches)
11 0.25 25 2.00 0.0312
38 56
9 0.25 50 2.00 0.0312
39 53
12 1.00 25 2.00 0.0312
40 55
10 1.00 50 2.00 0.0312
37 54
35 0.25 25 2.00 0.0312
72 82
33 0.25 50 2.00 0.0312
~~
36 1.00
69 81
25 2.00 0.0312
34 1.00 50 ·2.00 0.0312
70 83
Table 5. (continued)
Free Acid in Acid in Acid in
area feed solvent extract
(%) (gm/gm H) (gm/gm L) (gm/gm L)
13 0.1754 0.0106 0.1030
0.1743 0.0106 0.1095
0.1754 0.0100 0.1074
13 0.1754 0.0105 0.0978
0.1743 0.0106 0.1039
0.1754 0.0100 0.1012
13 0.1754 0.0106 0.0977
0.1743 0.0106 O.lOlb
0.1754 0.0100 0.1074
13 0.1754 0.0105 0.0954
0.1743 0.0106 0.0970
0.1754 0.0100 0.0968
25 0.1743 0.0104 0.10~5
0.1754 0.0100 0.10 9
0.1754 0.0100 0.1093
25 0.1743 0.0111 0.1035
0~1754 0.0100 0.1019
0.1771 0.0100 0.1019
25 0.1743 0.0108 0.1045
0.1754 0.0100 0.1017
0.1754 0.0100 0.1046
25 0.1743 0.0110 0.1030
0.1754 o.o10o-- 0.1028
0.1771 0.0100 O.i038
Acid in (HTU)OE
raffinate
(gm/gm H) (inches)
0.0612 5.10
0.0591 4.47
0.0592 4.91
0.0689 6.51
0.0663
0.0696 5.89 6.58
0.0705 6.58
0.0716 6.83
0.0699 7.01
0.0717 7.15
0.0748 7.69
0.0753 7.85
0.0613 4.95
0.0591 4.75
0.0590 4.62
0.0694 6.14
0.0676 6.40
0.0699 6.66
0.0667 6.12
0.0659 6.40
0.0667 5.83
0.0683 6.16
.().0677 6.61
0.0695 6.23
Material
balance
(%error)
[image:49.599.65.695.125.477.2]Table 5. (continued)
Run Pulse Pulse Plate Hole Free Acid in Aciu in Acid in Acid in (HTU)OE Material
No. amplitude frequency spacing diameter area feed solvent extract raffinate balance
(inches) (cycles/min) {inches) (inches) (%) (gm/gm H) (gm/gm L) (gm/gm L) (gm/gm H) (inches) (%error)
30 0.25 25 2.oo 0.0625 13 0.1712 0,0111 0.1019 . .0.0742 6.51 +3.16
87 0.1771 0.0102 0.1039 0.0663 6.10 +1.04
96 0.1771 0.0102 -0.1036 0.0663 6.18 -0.18
32 0.25 50 2.00 0.0625 13 0.1712 0.0111 0.0987 0.0740 7.06 +0.52
86 0.1771 0.0102 0.1004 0.0717 7.04 +0.69
94 0.1771 0.0102 0,1000 0.0724 7.18 +0,18
31 1.00 25 2.00 0.0625 13 0.1712 0.0111 0.0982 0.0752 7.23 +0.70
88 0.1771 0.0102 0.0987 0.0728 7.47 +0.53
93 0.1771 0.0102 0,1025 0.0651 6.23 -0.89
29 1.00 50 2.00 0.0625 13 0.1712 0.0111 0.0942 0.0743 7-99 -1.76
85 0.1771 0.0102 0.0951 0.0785 8.50 +0.70
95 0.1771 0.0102 0.0963 0.0786 8.35 +0.35
18 0.25 25 2".00 0.0625 25 0.1754 0.0104 0.0996 0.0748 7.20 -0.70
68 0.1754 0.0100 0.1005 0.0675 6.54 -1.60
75 0.1754 0;0100 0.1011 -0.0705 6.70 +0.52
17 0.25 50 2.00 0.0625 25 0.1754 0,0104 0.0961 0.0750 7.75 -2.44
67 0.1754 0.0100 0.0966 0.0749 7.65 -0.17
76 0.1754 0.0100 0.0970 0.0734 7.65 -0.87
19 1.00 25 2.00 0,0625 25 0.1754 0.0104 0.0981 0.0726 7-~5 -2.62
65 0.1754 0.0101 0.0999 0.0705 6. 8 -0.52
74 0.1754 0.0100 0.0997 .0.0696 6.91 -1.34
20 1.00 50 2.00 0.0625 25 0.1754 0.0104 0.1000 0.:0739 7.-44 -1.05
66 0.1754 0.0100 0.0988 .Q .0712 7.12 -0.17
73 - 0.1754 0.0100 0.0984 ' - -.1().0720 7·32 ' .. ·-0.35
[image:50.601.56.705.98.457.2]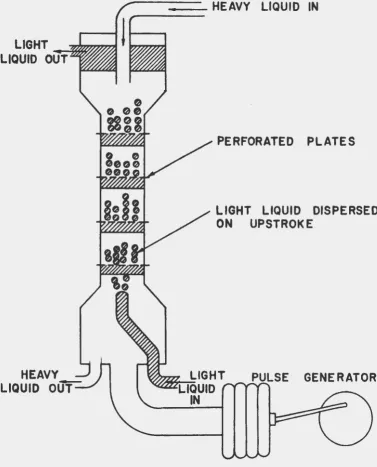


![Figure 9. Ettect ot the (at) product on (BTU)OE at 12d].P2](https://thumb-us.123doks.com/thumbv2/123dok_us/8112242.236812/25.597.88.541.168.667/figure-ettect-ot-product-btu-oe-d-p.webp)
