International Journal of Innovative Technology and Exploring Engineering (IJITEE) ISSN: 2278-3075,Volume-8 Issue-3C, January 2019
Abstract: Background/Objectives: Today, modern society is constantly changing with the development of innovations. This development is the leading to the fourth industrial revolution in the fields of AI, cloud and Big data. However, a hyper-connected society is vulnerable to cyber-attacks. However, existing countermeasures have not kept in pace with the rapid development in cyber threats. It is necessary to determine critical and dangerous elements in massive data. This requires new networking technology that can malicious traffic. Methods/Statistical analysis: To address the aforementioned issues, we developed Bro-IDS, which can monitor large-scale traffic for cyber threats. Bro-IDS is an intrusion detection system based on open source software. Bro-IDS also can create network traffic for various logs and be used for traffic measurement or forensic purposes. We perform experiments to analyze large-scale threats in real-time using the ELK Stack (Elastic search, Log stash, Kibana) to validate Bro-IDS. Findings: We performed a cyber threat analysis based using our security monitoring system from July 25th to August 5th 2018 on KREONET. During this period, all connections generated approximately 610 million logs and the total payload collected was approximately 300GB.First, weird logs and notice logs were generated. Weird logs are generated when abnormal traffic is routed through the network and notice logs are generated when anomalous signals, such as those from cyber-attacks, are generated. Regarding weird logs, split routing occurred 58 million and occupied approximately 33% of the total .An average of approximately 500 events per day accounted for Notice logs and they occupied 93.5% of the total of Notice log and address scan attacks for 57,116 logs. These cyber-attacks were used to determine specific IP addresses in the target network. Regarding protocols, TCP was used most often, accounting for 79.2% of the total, followed by UDP at 18.6% and ICMP at 2.1%. Regarding ports, port 443 accounted for 68% of the total, followed by port 25, 587, 2191, and 23.In terms of attacks, most attempts were made from South Korea, followed by Europe and the US. Improvements/Applications: We implemented Bro-IDS, a system for real-time detection and analysis of cyber threats on large-networks using the ELK stack. The results indicate that the proposed model has scalable security and can guarantee throughput corresponding to the bandwidth in a high-speed network environment.
Keywords: IDS, Cyber-attacks, Big Data, Security, KREONET
Revised Manuscript Received on January 03, 2019.
Kyuil Kim, Senior Researcher, Advanced KREONET Center, Korea Institute of Science Technology Information(KISTI), 245 Daehangno, Yuseong, Daejeon, 306-806, Korea,
Chanjin Park, KISTI, Advanced KREONET Center, 245 Daehangno, Yuseong, Daejeon, 306-806, Korea,
Wonhyuk Lee, Corresponding author, KISTI, Advanced KREONET Center, 245 Daehangno, Yuseong, Daejeon, 306-806, Korea,
Seunghae Kim, KISTI, Advanced KREONET Center, 245 Daehangno, Yuseong, Daejeon, 306-806, Korea,
Woojin Seok, KISTI, KREONET Center, 245 Daehangno, Yuseong, Daejeon, 306-806, Korea,
I.INTRODUCTION
Recently, the fourth industrial revolution, which has become a global phenomenon that connects all devices and enhances the welfare of mankind by applying intelligence to all aspects of society, has been gaining interest. In the past, people performed their tasks manually; however, the fourth industrial revolution has been bringing comfort and efficiency in performing these tasks because devise have become smart enough to perform certain tasks on their own. However, this increases vulnerability in terms of cyber security and the scope of damage caused by cyber-attacks. To ensure cyber security, it is important to focus primarily on networking and data security. The reason is that almost all data is shared and spread across the Internet. In this study, we built a software-based intrusion detection system (IDS)that detects cyber-attacks on high volume of traffic. The proposed IDS model is representative security project, named Bro-IDS. Bro-IDS [1] is intrusion detection system based on Unix. Bro-IDS also can generate various logs from large network traffic and analyze it to verify digital signature In addition, we propose a threat traffic monitoring model that analyzes cyber-attacks on large amounts of data. We used the ElasticSearch, Logstash, Kibana(ELK) stack[2],which is based on open source software, for large data analysis. ELK stack is the most popular big data analysis tool that supports the collection and analysis of large-scale data. We also realized cyber threat response environments to detect and analyze high-volume traffic threats using the proposed system. We performed a cyber threat analysis using our security monitoring system from July 25th to August 5th, 2018 on KREONET. During this period, all connections generated a approximately 610 million logs and the total payload collected was approximately 300GB.First, weird logs and notice logs were generated. Weird logs are generated when abnormal traffic is routed through the network and notice logs are generated when anomalous signals, such as those from cyber-attacks, are generated. Regarding weird logs, split routing occurred 58 million and occupied approximately 33% of the total. An average of approximately 500 events per day accounted for Notice logs and they occupied 93.5% of the total of Notice log and address scan attacks for 57,116 logs. These cyber-attacks were used to determine specific IP addresses in the target network. Regarding protocols, TCP was used most often, accounting for 79.2% of the total, followed by UDP at 18.6% and ICMP at 2.1%.
Large-Scale Threat Traffic Analysis and IDS
Development using Software
1
Regarding ports, port 443 accounted for 68% of the total, followed by port 25, 587, 2191, and 23.In terms of attacks, most attempts were made from South Korea, followed by Europe and the US.
II.RELATED WORK
Recently, cyber security has become big issue with the advent of the fourth industrial revolution. New security technologies have been published based on confidentiality, integrity, and availability to enhance cyber security[3-12]. However, existing security technologies cannot effectively detect cyber threats in real-time for large traffic. Furthermore, they do not provide a model to accurately analyze the detected malicious traffic from big data. Therefore, the priority is to establish a sophisticated cyber security model. To address this, we propose a model to monitor large-scale threat traffic, which is the biggest weakness of current cyber security systems, and to analyze and visualize the detected cyber-attack patterns.
III.SOFTWARE-BASED IDS BUILDING
We developed Bro-IDS to detect large-scale malicious traffic on KREONET[13]. Bro-IDS is a network security monitoring platform and provides additional general network traffic analysis as well. Bro-IDS can record logs for each protocol, as well as detect and analyze external network threats. Bro-IDS also easily identifies threats by separately recording notifications or summary information logs for specific network situations. The logs files typically include notice.log, weird.log, and intel.log. The above logs are discussed in detail in chapter 4. Bro-IDS uses the interpreter Broctl(Bro control) to perform most of its operations through a pre-defined command. Broctl controls the main functions of Bro-IDS and Bro scripts or plug-ins can be applied/executed using just Broctl. In addition, commands including Broctl can be used independently in Bro-IDS and are stored in the /bin directory of the default path. Before running the Bro=IDS, we set the type, host, and interface in the node.cfg configuration file. The properties of the Bro-IDS include type, manager, proxy, and worker. A security environment that for a given purpose can be constructed using these properties.
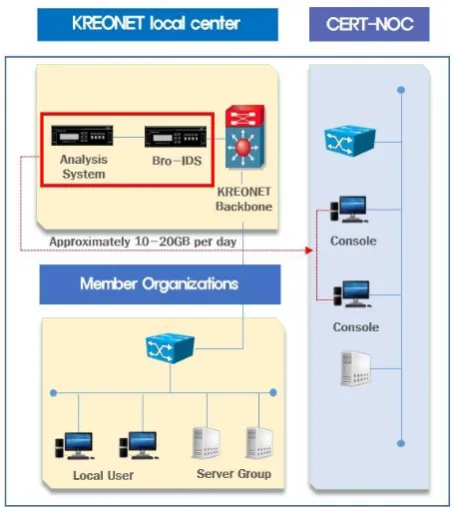
[image:2.595.317.545.51.307.2]Two instances of Bro-IDS were constructed via mirroring at the Daejeon center among the 17 regional network centers of KREONET as shown in figure 1. KREONET is a network dedicated to national research in South Korea to support general-purpose research and advanced application research activities. We configured a 10-core and 2.5GHz CPUs to overcome hardware performance limitations because the Bro-IDS does not support multithreading. We collected the main traffic through the aforementioned implementation and the log data was collected from member organizations at approximately 10~20GB per day.
Fig 1. Bro-IDS Network Construction on KREONET The logs collected from the CERT-NOC are HTTP, SSH, SSL, DNS, FTP, among many other application layer protocols, as shown in figure 2. The network status can be determined based on these logs. However, because the Bro-IDS is provided in text form, it is difficult to perform data analysis and real-time monitoring. Therefore, in the next chapter, we introduce a mechanism to analyze and visualize the large data of the Bro-IDS.
Fig 2. Bro-IDS Configuration
IV.VISUALIZATION OF IDS-DETECTED LOGS
As mentioned earlier, we built an open source-based ELK stack for the analysis of the large logs detected by the Bro-IDS. The ELK stack consists of Logstash, Elasticsearch, and Kibana. Logstash collects the data from multiple platforms and converts it into the format that Elasticsearch can store, as shown in figure 3. Logstash is a pipeline model with three stages, namely input, filter, and output. It provides a variety of plug-ins for each
International Journal of Innovative Technology and Exploring Engineering (IJITEE) ISSN: 2278-3075,Volume-8 Issue-3C, January 2019
thus, it can be configured to suit the user’s requirements. In the input phase log files from various platforms are collected and t the collected log files are converted into a regular form in the filter phase. In the output step, the storage location of the log records that were parsed in the previous phase are specified. Elasticsearch is a distributed search engine that provides clustering and is often used for the data analysis of large amounts of data because it can be easily extended and provides high availability in the event of errors. Kibana provides the ability to visualize the data stored in Elasticsearch. We use Filebeat, which stores the logs in a single location, to reduce the load on the Bro-IDS as shown. In addition, given that Filebeat stores its own last breakpoint, it can be restarted even if it is interrupted. We installed the Bro-IDS and ELK stacks on different hosts and pass the log files generated by Bro-IDS to the ELK stack server
Fig 3. ELK Stack principle
V.THREAT TRAFFIC ANALYZING
5.1. Dashboard configuration and layout
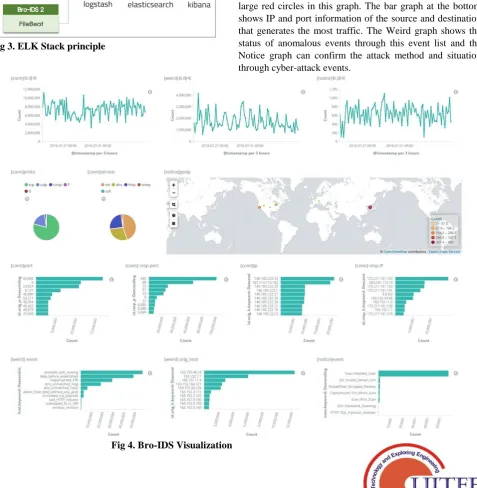
[image:3.595.66.544.303.792.2]We constructed a dashboard that can monitor threat traffic using the aforementioned ELK stack. The dashboard makes it convenient to observe threat traffic by listing the various types of visualized panels in one place. It also can also place/delete and customize the panels based on the user requirements for specific scenarios. As shown in figure 4, our dashboard displays nine graphs. The top left graph shows Conntection.log, which records all connections to identify the entire network traffic. The next graph shows Weird.log, which records the problems that occurred at the network layer. In the top right, Notice.log, which is a graph showing the attempted the intrusion event, is shown. The center left and middle pie graphs indicate how much of the total traffic uses a given particular protocol. The geographical graph shown in the center right is used as a map to identify regions (countries) that attempted cyber-attacks. The countries were identified based on the IP addresses using the GeoIP plug-in. Areas where cyber-attacks occur frequently are indicated by large red circles in this graph. The bar graph at the bottom shows IP and port information of the source and destination that generates the most traffic. The Weird graph shows the status of anomalous events through this event list and the Notice graph can confirm the attack method and situation through cyber-attack events.
Fig 5. Geographical threat graph based on Geo-IP
5.2. Cyber threat analysis
[image:4.595.59.280.419.584.2]We analyzed cyber threats using our system from July 25th to August 5th 2018 on KREONET. Table 1shows how many threat-related issues occur between July 25th and August 5th.All connections generated approximately 610 million logs together while the total payload collected was approximately 300GB.Wierd.log is a log that is updated when an unusual event occurs on the network. This accounts for approximately 13 million recorded events each day. In the Weird log, split routing occurred 58 million and occupied about 33% of the total. This log occurs only when the configured bandwidth is sent through the SSL tunnel and the rest is sent to the other interface. In addition, events that were not properly terminated on the network accounted for approximately 17% of the logs and events that did not normally connect to the DNS accounted for approximately 11% of the logs.
TABLE 1. Detection logs in KREONET
Date Connection.log Weird.log Notice.log
7/25 61,140,454 16,585,626 3,932
7/26 63,153,878 14,792,385 5,352
7/27 63,401,247 12,908,988 4,857
7/28 48,780,100 14,903,211 5,521
7/29 48,015,390 12,315,849 5,838
7/30 54,935,780 18,686,820 5,423
7/31 58,159,079 15,051,456 4,894
8/1 61,323,172 13,751,058 5,980
8/2 60,917,934 13,907,225 5,248
8/3 61,079,474 12,198,799 4,257
8/4 63,678,714 11,375,924 4,591
8/5 60,838,646 9,750,644 5,297
An entry in the Notice.log file is made when a cyber-attack occurs. Approximately 5000 such events were recorded each day, on average, in table 2.During this time, address scan attacks accounted were the most common type of attacks and accounted for approximately 93.5% (57,116 events).Address scans threat are often used to find specific IP addresses on the target network prior to cyber-attacks. The second most common event is the Invalid_Sever_Certevent. This event occurs frequently when the client communicates with the server using SSL protocol. If SSL certificate in the server is an unclear certificate, then this event occurs. The next event is the PacketFilter event, which accounted for 1,034(1.7%) events. CaptureLoss events accounted for 871(1.4%) events. CaptureLoss occurs when the packet capture process has excessive packet loss on the host or NIC. Finally, Port_Scan
to find an open port on a target network before a hacker attacks it.
TABLE 2. Cyber-attacks events in KREONET
Notice Event Count
1 Scan::Address_Scan 57,116
2 SSL::Invalid_Server_Cert 1,228
3 PacketFilter::Dropped_Packets 1,034 4 CaptureLoss::Too_Much_Loss 871
5 Scan::Port_Scan 846
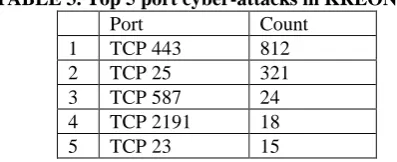
[image:4.595.318.517.466.547.2]In terms of protocol statistics, TCP was the most frequently used protocol at 79.2%, followed by UDP(18.6%), and ICMP (2.1%).The port status of the notice event is shown in table 3.Port 443 accounted for 68% of the total events. Port 443 uses the SSL protocol and is primarily used when connecting with HTTP servers (for encryption between the web server and the user’s Internet browser). Next, port 25 and 587 occupied 27% and 2%, respectively, using the SMTP protocol and they are used primarily for email delivery. Next, port 2191, which uses TCP and occupied 1.5%. Finally, port 23 accounted for 1.2% using TELNET. This port is mainly used to connect a remote host computer via the Internet.
TABLE 3. Top 5 port cyber-attacks in KREONET
Port Count
1 TCP 443 812
2 TCP 25 321
3 TCP 587 24
4 TCP 2191 18
5 TCP 23 15
The cyber-attacks locations are shown in figure 5, South Korea attempted the most cyber-attacks, followed by Europe and the US. We have listed the number of times a particular IP attacked the network in table 4.The highest number of attacks (203)originated from the IP address 163.152.6.95 and the country of origin was South Korea. The IP addresses that sent the 4th highest and 5th highest number of attacks originated from South Korea, the 2nd highest number of attacks originated from Europe and the 3rd highest number of attacks originated from the US.
Table 4: Top 5 IP cyber-attacks in KREONET
IP Count
1 163.152.6.95 203
2 138.246.253.5 61
3 67.21.36.3 57
4 163.152.174.252 43
International Journal of Innovative Technology and Exploring Engineering (IJITEE) ISSN: 2278-3075,Volume-8 Issue-3C, January 2019
VI.CONCLUSION
We proposed the Bro-IDS to deal with the cyber threat traffic in large-scale networking environments. We also analyzed large volumes of logs using ELK stack and monitored threat traffic in real-time through visualization. Furthermore, we proposed a scalable security model that can guarantee the throughput corresponding to the bandwidth in a high-speed network environment.
ACKNOWLEDGMENT
This research was supported by “Building and Services of Advanced KREONET for Global Collaborative Researches” Program funded by the Ministry of Science, ICT(K-18-L12-C03)
REFERENCES
1. www.bro.org
2. www.elastic.co/elk-stack
3. Abigail P,Asaf S, Rami P, Aviad E, Yuval E, Mehran R. Creation and
management of social network honeypots for detecting targeted cyber-attacks. IEEE Transactions on Computational Social Systems. 2017 Sept;4(3):65-79.
4. Kurek T, Lason A, Niemiec M. First step towards preserving the privacy
of cloud-based IDS security policies. Security and communication networks. 2015 May8(18); :3481-3491
5. Philip Chen C.L, Chun-Yang Z. Data-intensive applications, challenges,
techniques and technologies: A survey on Big Data. Information Science Journal of Elsevier. 2014 Aug;275(1):314-347.
6. Robin G, Anup S, William M, William S, Qiuming Z, Phillip L.
Dimensions of cyber-attacks social, political, economic, and cultural. IEEE Technology and society magazine. 2011 Spring; Vol 30(1): 28-38.
7. Solms RV, Niekerk JV. From information security to cyber security.
Computers & Security of Elsevier. 2013 Oct;Vol38(1):97-102.
8. Juntao C, Quanyan Z. Security as a Service for Cloud-Enabled Internet
of Controlled Things Under Advanced Persistent Threat: A Contract Design Approach. IEEE Transactions on information forensics and security. 2017 Nov;Vol12(11):2736-2750.
9. Kim KI, Lee WH, Cho BS, Kim DK, Park HW. Case study of application
of integrated control and management system based on
inter-collaboration against cyber threat. Journal of Engineering and Applied Sciences. 2018 Aug;Vol13(2):2872-2877
10. Abomhara M, Koen GM. Cyber Security and the Internet of Things:
Vulnerabilities, Threats, Intruders and Attacks. Journal of Cyber Security. 2015 May;Vol4(1):65-88
11. Chen D, Zhao H. Data Security and Privacy Protection Issue in Cloud
Computing. Proceeding of IEEE International Conference on Computer Science and Electronics Engineering. 2012 Mar:647-651.
12. Cherdantsefva Y, Burnap P, Blyth A, Eden P, Jones K, Soulsby H, et al.
A review of cyber security risk assessment methods for SCADA systems. Computers & Security of Elseview. 2016 Feb;Vol56(1):1-27