This is a repository copy of Who are the obese? A cluster analysis exploring subgroups of
the obese..
White Rose Research Online URL for this paper:
http://eprints.whiterose.ac.uk/84606/
Version: Accepted Version
Article:
Green, M.A., Strong, M., Razak, F. et al. (3 more authors) (2015) Who are the obese? A
cluster analysis exploring subgroups of the obese. Journal of Public Health. ISSN
1741-3842
https://doi.org/10.1093/pubmed/fdv040
[email protected] https://eprints.whiterose.ac.uk/ Reuse
Unless indicated otherwise, fulltext items are protected by copyright with all rights reserved. The copyright exception in section 29 of the Copyright, Designs and Patents Act 1988 allows the making of a single copy solely for the purpose of non-commercial research or private study within the limits of fair dealing. The publisher or other rights-holder may allow further reproduction and re-use of this version - refer to the White Rose Research Online record for this item. Where records identify the publisher as the copyright holder, users can verify any specific terms of use on the publisher’s website.
Takedown
If you consider content in White Rose Research Online to be in breach of UK law, please notify us by
Who are the obese? A cluster analysis exploring subgroups of the obese.
Green, MA (Corresponding author), Research Associate, School of Health and Related
Research (ScHARR), University of Sheffield, Sheffield, UK. Email:
[email protected]
. Tel: 0114 222 0838.
Strong, M, Senior Clinical Lecturer, School of Health and Related Research (ScHARR),
University of Sheffield, Sheffield, UK.
Razak, F, Bell Postdoctoral Fellow, Harvard Center for Population and Development Studies,
Harvard, Cambridge, MA, USA. Also affiliated with
: St. Michael’s Hospital, University of
Toronto, Toronto, Ontario, Canada & Li Na Shing Knowledge Institute, Toronto, Ontario,
Canada.
Subramanian, SV, Professor of Population Health and Geography, School of Public Health,
Harvard, Boston, MA, USA. Also affiliated with: Harvard Center for Population and
Development Studies, Harvard, Cambridge, MA, USA.
Relton, C, Research Fellow, School of Health and Related Research (ScHARR), University
of Sheffield, Sheffield, UK.
Bissell, P, Professor of Public Health, School of Health and Related Research (ScHARR),
ABSTRACT
Background: Body mass index can be used to group individuals in terms of their height and weight
as obese. However, such a distinction fails to account for the variation within this group across other
factors such as health, demographic and behavioural characteristics. The study aims to examine the
existence of subgroups of obese individuals.
Methods: Data were taken from the Yorkshire Health Study (2010-2012) including information on
demographic, health and behavioural characteristics. Individuals with a body mass index of greater
than or equal to 30 were included. A two-step cluster analysis was used to define groups of
individuals who shared common characteristics.
Results: The cluster analysis found six distinct groups of individuals whose BMI was greater than or
equal to 30. These subgroups were: heavy drinking males, young healthy females; the affluent and
healthy elderly; the physically sick but happy elderly; the unhappy and anxious middle aged, and a
cluster with the poorest health.
Conclusion: It is important to account for the important heterogeneity within individuals who are
obese. Interventions introduced by clinicians and policy makers should not target obese individuals as
a whole, but tailor strategies depending upon the subgroups that individuals belong to.
MeSH KEY WORDS
INTRODUCTION
Individuals with a body mass index (BMI) of greater than or equal to 30 are classified as obese.
However, this classification assumes homogeneity within the group. BMI is a classification of weight
and height, not of people, who are only similar in terms of their BMI category (1). Using a single
classification for obesity will fail to recognise the variation between the individuals who are obese (2).
For example, there has been debate about the existence of a metabolically healthy and fit set of obese
individuals, contrary to the traditional understanding of the impact of obesity on health (3). Failing to
acknowledge the population-level heterogeneity amongst those classified as obese may restrict the
effectiveness of interventions or treatments offered by clinicians, since approaches may need tailoring
depending upon the health practices associated with individuals involved.
There has been relatively little consideration of the population-level heterogeneity of those classified
as obese. There is some evidence that obesity-related behaviours including physical activities,
diet/nutrition, lifestyle and sedentary behaviours cluster together amongst adolescents across all BMI
categories (4–10). For example, Ogden et al. (11) used a cluster analysis to identify subgroups of
individuals who were successful in maintaining weight loss. Analysis showed that individuals
differed in their strategies and outcomes, indicating that weight loss interventions require tailoring
towards individuals to be most effective. Such an approach may be useful for thinking about obesity,
allowing our understanding to move beyond a single classification of individuals as just obese.
Obesity has been shown to be associated with a variety of demographic factors, for example age (12),
gender (12,13) and deprivation (14,15). There are behavioural differences such as reduced physical
activity (7) and poorer diet (9). Obesity is associated with increased risk of adverse health outcomes
including diabetes, cardiovascular diseases, stroke and osteoarthritis (16–18). Such research tends to
consider obesity as a single discrete factor, analysing its relationship to a single outcome variable
treated in isolation to the other factors. This ignores how these demographic, health and behavioural
factors are inter-related amongst (and between) certain groups of individuals (7). Exploring the
heterogeneity of obese individuals will help to identify population subgroups that can help clinicians
and policy makers explore the need for differing strategies/interventions in helping individuals lose
METHODOLOGY
Data
Data were taken from the first wave of the Yorkshire Health Study (YHS) (2010-2012). The YHS is a
longitudinal observational study that collects information on the health and heath needs of individuals
in the Yorkshire region of England (the first wave only collected data for residents in South
Yorkshire) (19,20). The focus of the YHS is on weight, weight management and chronic health
conditions. Data were collected through recruiting General Practitioners surgeries (43 accepted; 50%
acceptance) and sending out questionnaires to all patients aged 16-85 (achieving a response rate of
15.9%). Data were self-reported. The first wave of the YHS collected data on 27 806 individuals, of
which 4 144 were classified as having a BMI greater than or equal to 30.
Demographic variables included were age, sex, ethnicity and socioeconomic deprivation due to their
importance in previous research (12–14). Ethnicity was reported as a binary variable for whether an
individual was ‘White’ or ‘Non-White’. Deprivation was determined using the area individuals lived
in. The area measure ‘Indices of Deprivation 2010’ was used since it is a multidimensional measure
presenting a detailed understanding of the multiple determinants of deprivation (21).
Health-related variables included were whether an individual reported the following chronic
conditions: fatigue, pain, insomnia, anxiety, depression, diabetes, breathing problems, high blood
pressure, heart disease, osteoarthritis, stroke or cancer. The EuroQoL EQ5D was included as a
measure an individual’s health-related quality of life (22). Well-being was captured through asking
individuals how satisfied they were of their life on a scale of zero (completely dissatisfied) to 10
(completely satisfied).
Variables related to behavioural characteristics included were: smoking status (binary variable for
whether individuals smoked or not), the number of units of alcohol consumed in the previous week,
whether an individual engaged in more than one hour of physical activity a week, and whether an
individual walked for more than one hour in a week. The low level cut-off points for physical activity
and walking was chosen to capture sedentary characteristics. Finally, we included a binary factor
relating to whether an individual engaged in active management of their own weight (including; use
of slimming clubs, increasing exercise, controlling portion size, eating healthier, using
over-the-counter weight loss medication or using meal replacements).
Analysis
Cluster analysis was used to identify subgroups within the data. The method groups together
exploratory and hypothesis generating (23,24). Although it cannot identify causation, the results are
often used to drive future research (4).
As the data included both binary and continuous variables a two-step cluster analysis method was
used (7,25). The method operates through firstly scanning the data in a pre-classificatory stage and
identifying ‘dense’ regions of data known as cluster features (data points that share similar values
across a range of variables) (25). An algorithm similar to an agglomerative hierarchical clustering
method is then used to classify the data (25). The log-likelihood is used as a distance measure since it
normalises distance between different data types (25). Continuous variables are also standardised
using z-scores to allow for greater comparability between the different scales (23). The analysis was
conducted using SPSS (version 21).
There is no well-defined method for determining the optimal number of clusters (23,26). The number
of clusters needs to be large enough to capture the important features in the data, but not too large that
interpretation becomes difficult (23,24). Chiu et al. (22) recommend using Schwartz’s Bayesian
Information Criterion (BIC) to inform the decision on the number of clusters that best represents the
underlying structure of the data, as it has been shown to be useful (27). Change in BIC was plotted
against the number of clusters to identify a “kink” in the relationship that would demonstrate when
subsequent solutions added less detail to the results (23).
Interpretation of the results will be described through calculating the mean values of the variables for
each cluster (with clusters labelled accordingly). The coefficient of variation was also calculated to
present a normalised measure of the variation in variables to help assess their contribution to cluster
formation.
To test the stability of the clusters, a replication analysis was conducted to assess how robust the
clusters are at capturing the structure of the data. Blashfield and Macintyre’s (28) split sample method was used. The procedure randomly divides the sample in half and performs the cluster
analysis using the same rules and parameters from the main cluster analysis on each sample. The
results from one of the samples is then taken and applied to the other sample, using the clusters
derived from the first sample to classify the data in the second sample. The cluster centres for the two
solutions for the second sample are compared and Cohen’s kappa coefficient is calculated to measure
RESULTS
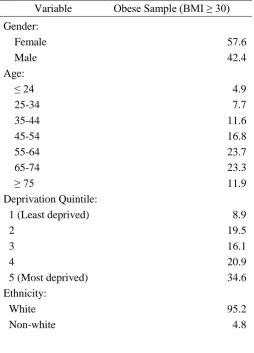
Table 1 presents the demographic characteristics of the sample of individuals defined as obese using
BMI (deprivation is reported in national quintiles). Mean age of the sample was 56 (s.d. = 15). Mean
BMI was 34 (s.d. = 4). 57.6% of the sample were female, 95.2% were White and individuals were
most commonly found in more deprived areas. The obese sample contained a higher proportion of
older people, females and individuals from deprived areas than compared to the rest of the YHS
(which is broadly representative of South Yorkshire; (20)).
Change in BIC against number of clusters is shown in Figure 1. There are two obvious kinks in the
plot: one at a three cluster solution and the other at a six cluster solution. Although the three cluster
solution leads to a distinct change in the gradient of the slope, the BIC continues to decline
considerably until the six cluster solution. This would suggest that a six cluster solution offers greater
discriminatory power by capturing further variation in the data that would be missed out if the broader
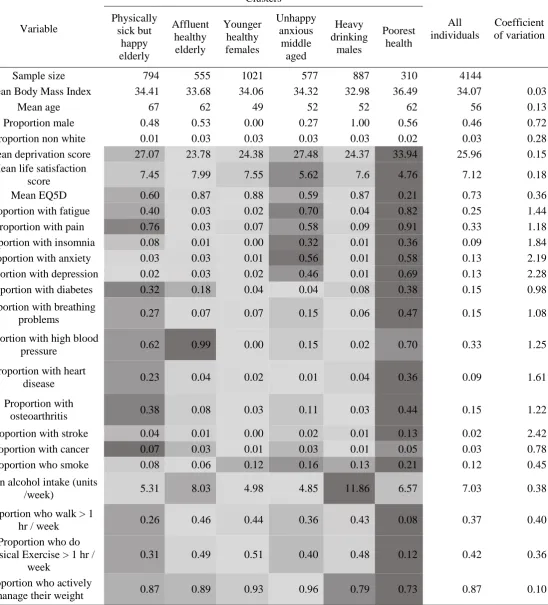
three cluster solution was used. A six cluster solution was chosen and Table 2 presents the mean
characteristics of each cluster from this solution.
The largest cluster was ‘younger healthy females’ who were the youngest cluster. They displayed the most positive health characteristics of all the clusters and also engaged in some healthy behaviours.
‘Heavy drinking males’ were similar to ‘young healthy females’ except with respect to their high alcohol consumption. This group were also less likely to be managing their weight, although they did
report above average levels of physical exercise and walking.
The “unhappy anxious middle aged” group were primarily female. They have poor mental health,
with a low EQ5D and high values for insomnia, anxiety, depression and fatigue. Their sense of
wellbeing is relatively low. However, this group does engage in healthy physical activity and in
weight management, and has the lowest alcohol consumption.
The final three clusters capture different patterns amongst older people. The ‘affluent healthy elderly’
is the least deprived cluster. They have positive health characteristics (although have above average
alcohol consumption). The individuals in this cluster include a large proportion with high blood
pressure and this may partially explain how the cluster was formed, although the high value may be
related to their age. Next there are the ‘physically sick but happy elderly’, a group that has a higher
prevalence of chronic health conditions (including osteoarthritis, diabetes and high blood pressure)
but who also exhibit low levels of anxiety and depression. Finally there are those with the ‘poorest
health’. This group is the most deprived, has the worst health (highest prevalence of most chronic
health conditions) and tends not to engage in healthy behaviours. Individuals reported high levels of
The coefficient of variation presented information regarding the dispersion of variables. Variables
with greater variation will be more important in cluster formation, as they allow for higher
discrimination between clusters. Values were highest amongst the health-related variables (especially
stroke, anxiety, depression), suggesting that they were most important in cluster formation. Although
mean alcohol intake contained a low value, this is because the variable only contains high values for
one cluster, with the other clusters containing similar values.
Conducting a replication analysis using Blashfield and Macintyre’s (28) split sample method
produced clusters that were fairly similar to the main results. Cohen’s kappa coefficient was 0.41
(p<0.001), suggesting moderate agreement (29). The cases that altered were mostly found on the
boundaries of each cluster and hence any differences were due to these cases moving to clusters of
similar characteristics (i.e. knife edge issues; (23,24)). The clusters also remained consistent if the
morbidly obese were removed from the sample (i.e. leaving only the obese (BMI = 30 to 40, n=3757);
kappa coefficient against the original solution was 0.56, p<0.001). A cluster analysis of just the
morbidly obese (BMI = 40+, n=387) did not produce broadly similar clusters. We also repeated the
analysis for normal and overweight BMI categories. The clusters we found in the overweight group
were similar to those found in the obese group, however this similarity was not seen in the analysis of
DISCUSSION
Main findings
The analysis presented in this study has identified six types of obese individuals: heavy drinking
males, younger healthy females; affluent healthy elderly; the physically sick but happy elderly;
unhappy anxious middle aged, and a cluster with the poorest health. Health conditions (especially
stroke, anxiety and depression) displayed the greatest variation in mean values between clusters
suggesting that they were important in differentiating between types of obese individuals. Testing
suggested that the clusters were fairly stable.
What is already known on this topic
Although there has been sustained criticism of BMI as a measure of body fat and obesity (30,31),
BMI continues to be an important measure for reporting obesity levels within a population (18).
There has been less critique surrounding BMI as a classificatory tool. Our paper helps to drive debate
around the application of BMI, refining the measure to improve the detail it can offer as tool for
grouping individuals.
What this study adds
The heterogeneity of obese individuals has important policy and clinical relevance. Obesity-related
interventions often target obese people in general, rather than any particular population subgroup
(except perhaps relative to age and/or gender) (4,10). A focus on subgroups of individuals may allow
a much more efficient targeting of scarce health care and health promotion resources. An example
might be the targeting of messages about the role of alcohol in weight management to young males as
opposed to young females. Likewise, the ‘affluent healthy elderly’ may respond to different messages, and may require different interventions, compared with those who are in the ‘poorest
health’ group who appear to be those with the most significant clinical need.
Although it is clear that the individuals in the study would benefit from weight loss, an important
implication from the results is that weight loss may not be the primary clinical focus. For example,
amongst the ‘poorest health’ group weight loss may be less of an issue compared to the chronic health issues associated with the cluster. This is in contrast to other groups such as ‘younger healthy
females’ or ‘affluent healthy elderly’ where weight loss could be a priority. Clinical prioritisation is key here and the cluster analysis highlights this issue when dealing with obese patients (where weight
Interventions may need to be targeted to the cluster that patients correspond, to help patients lose
weight or to effectively tailor their design. For example, for the ‘unhappy anxious middle aged’ an
intervention involving increasing exercise may need to be mixed with psycho-social counselling,
whereas for those in the ‘poorest health’ group advice surrounding exercise may not be reasonable
and much more modest goals may be needed. It is important for clinicians and policy makers to
recognise the different types of obese individuals they will encounter and moving beyond just using
BMI alone will be important for successful treatment (32).
Limitations of this study
BMI is used to identify individuals who are obese for the analysis. BMI may not always accurately
classify individuals as obese as it does not directly measure body fat. Although BMI is easy to
measure, there is conflicting evidence surrounding how useful BMI is as a measure of obesity in the
general population. Shah & Braverman (24) found that BMI underestimated prevalence of obesity
compared to body fat, however Gallagher and colleagues (25) have shown BMI to be correlated to
most other measures of body fat. Green (18) also demonstrated that BMI was a useful measure
compared to waist circumference for estimating a variety of health risks. Future research should
explore whether the clusters exist when using other measures of obesity to explore their validity.
The data collected in the YHS are based on self-reported information and are therefore subject to a
range of different biases. Self-reported BMI has been shown to be downwardly biased (30). The
variables used to classify individuals may also be affected by bias, for example diabetes has been
shown to be under-reported through self-reported methods (33).
The number of clusters chosen is somewhat arbitrary, and will affect the results that are reported
(23,24). Whilst the decision for the number of clusters selected was based upon the BIC (a measure
previously shown to be effective at detecting the correct number of clusters), the choice is still
somewhat subjective (25,27). Exploring the results for a varying number of clusters in the data set
showed that the patterns captured in the six cluster solution remained broadly consistent (with clusters
either combined or split up depending on the number of clusters), suggesting that a six cluster solution
was appropriate. Testing also indicated that the solution was fairly stable.
Cluster analysis is a data driven method and hence despite the stability of the clusters within the
study, the results may not be generalizable to other obese populations. However, the methodology is
designed to generate hypotheses that can drive future research (23,24). It would be useful to explore
the existence of the clusters in other data sets to validate how useful the groupings are both nationally
and internationally. It is also worth exploring how similar the obese clusters are to other population
ACKNOWLEDGMENTS
We are grateful to all the individuals who have enrolled in the cohort. We also acknowledge the GP
practice staff for their contribution in the recruiting process. This publication is the work of the
authors and does not necessarily reflect the views of the Yorkshire Health Study Management Team
or Steering Committee.
This publication presents independent research by the National Institute for Health Research
Collaboration for Leadership in Applied Health Research and Care for South Yorkshire (NIHR
CLAHRC SY) a pilot which ended in 2013. Further details about the new NIHR CLAHRC Yorkshire
and Humber can be found at www.clahrc-yh.nihr.ac.uk. The views and opinions expressed are those
of the authors, and not necessarily those of the NHS, the NIHR or the Department of Health.
CONFLICT OF INTEREST
REFERENCES
1. Nicholls SG. Standards and classification: a perspective on the “obesity epidemic”. Soc Sci Med 2013;87:9–15.
2. Andreyeva T, Sturm R, Ringel JS. Moderate and severe obesity have large differences in health care costs. Obes Res 2004;12:1936–43.
3. Ortega FB, Lee D-C, Katzmarzyk PT, et al. The intriguing metabolically healthy but obese phenotype: cardiovascular prognosis and role of fitness. Eur Heart J 2013;34:389–97.
4. Boone-Heinonen J, Gordon-Larsen P, Adair LS. Obesogenic clusters: multidimensional adolescent obesity-related behaviors in the U.S. Ann Behav Med 2009;36:217–30.
5. Cameron AJ, Crawford DA, Salmon J, et al. Clustering of obesity-related risk behaviors in children and their mothers. Ann Epidemiol 2011;21:95–102.
6. De Vries H, van ’t Riet J, Spigt M, et al. Clusters of lifestyle behaviors: results from the Dutch SMILE study. Prev Med 2008;46:203–8.
7. Landsberg B, Plachta-Danielzik S, Lange D, et al. Clustering of lifestyle factors and association with overweight in adolescents of the Kiel Obesity Prevention Study. Public Health Nutr 2010;13:1708–15.
8. Nelson MC, Gordon-Larsen P, Adair LS, Popkin BM. Adolescent physical activity and sedentary behavior: patterning and long-term maintenance. Am J Prev Med 2005;28:259–66.
9. Newby PK, Tucker KL. Empirically Derived Eating Patterns Using Factor or Cluster
Analysis : A Review. Nutr Rev 2004;62:177–203.
10. Leech RM, McNaughton SA, Timperio A. Clustering of children’s obesity-related behaviours: associations with sociodemographic indicators. Eur J Clin Nutr 2014;68:623–8.
11. Ogden LG, Stroebele N, Wyatt HR, et al. Cluster analysis of the national weight control registry to identify distinct subgroups maintaining successful weight loss. Obesity 2012;20:2039–47.
12. Ng M, Fleming T, Robinson M, et al. Global, regional, and national prevalence of overweight and obesity in children and adults during 1980–2013: a systematic analysis for the Global Burden of Disease Study 2013. Lancet 2014;6736:1–16.
13. Canoy D, Buchan I. Challenges in obesity epidemiology. Obes Rev 2007;8:1–11.
14. Stafford M, Brunner EJ, Head J, Ross NA. Deprivation and the development of obesity a multilevel, longitudinal study in England. Am J Prev Med 2010;39:130–9.
15. McLaren L. Socioeconomic status and obesity. Epidemiol Rev 2007;29:29–48.
16. Dixon JB. The effect of obesity on health outcomes. Mol Cell Endocrinol 2010;316:104–8.
18. Green MA. Do we need to think beyond BMI for estimating population-level health risks? J Public Health. In Press; doi:10.1093/pubmed/fdv007.
19. Relton C, Bissell P, Smith C, et al. South Yorkshire Cohort: a “cohort trials facility” study of health and weight - protocol for the recruitment phase. BMC Public Health 2011;11:640.
20. Green MA, Li J, Relton C, et al. Cohort Profile: The Yorkshire Health Study. Int J Epidemiol In Press; doi: 10.1093/ije/dyu121.
21. Department for Communities and Local Government. The English Indices of Deprivation 2010. London: DCLG; 2011. URL:
https://www.gov.uk/government/uploads/system/uploads/attachment_data/file/6871/1871208.p df. Date accessed: 30th July 2014.
22. Rabin R, Charro F. EQ-SD: a measure of health status from the EuroQol Group. Ann Med 2001;33:337–43.
23. Everitt B, Sabine L, Leese M. Cluster Analysis. London: Arnold; 2001.
24. Gordon AD. Classification. London: Chapman and Hall; 1999.
25. Chiu T, Fang D, Chen J, et al. A robust and scalable clustering algorithm for mixed type attributes in large database environment. Proc seventh ACM SIGKDD Int Conf Knowl Discov data Min - KDD’01 2001;263–8.
26. Milligan G, Cooper M. An examination of procedures for determining the number of clusters in a data set. Psychometrika 1985;50:159–79.
27. Fraley C, Raftery AE. How Many Clusters ? Which Clustering Method ? Answers Via Model -Based Cluster Analysis. Comput J 1998;41:578–88.
28. Blashfield R, McIntyre R. A nearest-centroid technique for evaluating the minimum-variance clustering procedure. Multivar Behav Res 1980;15:225–38.
29. Fleiss JL. Statistical methods for rates and proportions. New York: John Wiley; 1981.
30. Shah NR, Braverman ER. Measuring adiposity in patients: the utility of body mass index (BMI), percent body fat, and leptin. PLoS One 2012;7:e33308.
31. Gallagher D, Visser M, Sepúlveda D, Pierson RN, Harris T, Heymsfield SB. How useful is body mass index for comparison of body fatness across age, sex, and ethnic groups? Am J Epidemiol 1996;143:228–39.
32. Sharma AM, Kushner RF. A proposed clinical staging system for obesity. Int J Obes 2009;33:289–95.
TABLES
Table 1: Description of the demographic factors (%) of individuals whose body mass index was
greater than or equal to 30.
Variable Obese Sample (BMI ≥ 30)
Gender:
Female 57.6
Male 42.4
Age:
≤ 24 4.9
25-34 7.7
35-44 11.6
45-54 16.8
55-64 23.7
65-74 23.3
≥ 75 11.9
Deprivation Quintile:
1 (Least deprived) 8.9
2 19.5
3 16.1
4 20.9
5 (Most deprived) 34.6
Ethnicity:
White 95.2
Non-white 4.8
Table 2: The mean values of variables split by clusters. Variable Clusters All individuals Coefficient of variation Physically sick but happy elderly Affluent healthy elderly Younger healthy females Unhappy anxious middle aged Heavy drinking males Poorest health
Sample size 794 555 1021 577 887 310 4144
Mean Body Mass Index 34.41 33.68 34.06 34.32 32.98 36.49 34.07 0.03
Mean age 67 62 49 52 52 62 56 0.13
Proportion male 0.48 0.53 0.00 0.27 1.00 0.56 0.46 0.72 Proportion non white 0.01 0.03 0.03 0.03 0.03 0.02 0.03 0.28 Mean deprivation score 27.07 23.78 24.38 27.48 24.37 33.94 25.96 0.15
Mean life satisfaction
score 7.45 7.99 7.55 5.62 7.6 4.76 7.12 0.18
Mean EQ5D 0.60 0.87 0.88 0.59 0.87 0.21 0.73 0.36
Proportion with fatigue 0.40 0.03 0.02 0.70 0.04 0.82 0.25 1.44 Proportion with pain 0.76 0.03 0.07 0.58 0.09 0.91 0.33 1.18 Proportion with insomnia 0.08 0.01 0.00 0.32 0.01 0.36 0.09 1.84 Proportion with anxiety 0.03 0.03 0.01 0.56 0.01 0.58 0.13 2.19 Proportion with depression 0.02 0.03 0.02 0.46 0.01 0.69 0.13 2.28 Proportion with diabetes 0.32 0.18 0.04 0.04 0.08 0.38 0.15 0.98
Proportion with breathing
problems 0.27 0.07 0.07 0.15 0.06 0.47 0.15 1.08
Proportion with high blood
pressure 0.62 0.99 0.00 0.15 0.02 0.70 0.33 1.25
Proportion with heart
disease 0.23 0.04 0.02 0.01 0.04 0.36 0.09 1.61
Proportion with
osteoarthritis 0.38 0.08 0.03 0.11 0.03 0.44 0.15 1.22
Proportion with stroke 0.04 0.01 0.00 0.02 0.01 0.13 0.02 2.42 Proportion with cancer 0.07 0.03 0.01 0.03 0.01 0.05 0.03 0.78 Proportion who smoke 0.08 0.06 0.12 0.16 0.13 0.21 0.12 0.45
Mean alcohol intake (units
/week) 5.31 8.03 4.98 4.85 11.86 6.57 7.03 0.38
Proportion who walk > 1
hr / week 0.26 0.46 0.44 0.36 0.43 0.08 0.37 0.40
Proportion who do physical Exercise > 1 hr /
week
0.31 0.49 0.51 0.40 0.48 0.12 0.42 0.36
Proportion who actively
manage their weight 0.87 0.89 0.93 0.96 0.79 0.73 0.87 0.10 Note: The mean scores have been conditionally formatted for each variable to improve their visual interpretation (this is
15
FIGURE LEGENDS