³EFFECTIVENESS OF MULTIMEDIA EDUCATION ON
LEVELS OF KNOWLEDGE, ATTITUDE AND EXPRESSED
PRACTICES REGARDING CANCER BREAST AND SCREENING
AMONG WOMEN AT SELECTED URBAN AREA, VELLORE´
M.Sc (NURSING) DEGREE EXAMINATION
BRANCH-III OBSTETRICS AND GYNAECOLOGICAL NURSING SRI NARAYANI COLLEGE OF NURSING
VELLORE-55
A Dissertation submitted to
THE TAMILNADU DR. M.G.R. MEDICAL UNIVERSITY, CHENNAI-600 032.
In partial fulfilment of the requirement for the degree of MASTER OF SCIENCE IN NURSING.
APRIL-2016.
CERTIFICATE
This is to certify that the dissertation titled is ³EFFECTIVENESS OF
MULTIMEDIA EDUCATION ON LEVELS OF KNOWLEDGE, ATTITUDE AND EXPRESSED PRACTICES REGARDING CANCER BREAST AND SCREENING AMONG WOMEN AT SELECTED URBAN AREA, VELLORE´ is a bonafide research work done by Mrs.S. Emerald Raja Kumari, Sri Narayani College of Nursing, Vellore-55, in partial fulfilment of the requirement for the degree of Master of Science in Nursing , Branch- III Obstetrics and Gynaecological Nursing, under my guidance and supervision during the academic year 2014-2016.
______________________
Prof . Mrs. Lalitha Purushothaman, M.Sc(N).,M.Phil.,
Administrative cum liaison Officer,
HOD of Nursing Research Department,
Sri Narayani College of Nursing,
Thirumalaikodi,
Vellore-55
³EFFECTIVENESS OF MULTIMEDIA EDUCATION ON
LEVELS OF KNOWLEDGE, ATTITUDE AND EXPRESSED
PRACTICES REGARDING CANCER BREAST AND SCREENING
AMONG WOMEN AT SELECTED URBAN AREA, VELLORE.
Approved by Dissertation Committee on July 2015
RESEARCH GUIDE:
Prof.Mrs. SUJATHA.V.,M.Sc.(N), --- Principal and Research Co-Ordinator,
Sri Narayani College of Nursing, Vellore-55.
SPECIALITY GUIDE:
MRS. SUDHA.R.,M.Sc.(N),MBA(HM), --- Professor,
HOD-Obstetrics and Gynaecological Nursing, Sri Narayani College of Nursing,
Vellore-55.
A Dissertation submitted to
THE TAMILNADU DR.M.G.R. MEDICAL UNIVERSITY CHENNAI-600 032
In partial fulfilment of the requirement for the degree of
³EFFECTIVENESS OF MULTIMEDIA EDUCATION ON
LEVELS OF KNOWLEDGE, ATTITUDE AND EXPRESSED
PRACTICES REGARDING CANCER BREAST AND SCREENING
AMONG WOMEN AT SELECTED URBAN AREA, VELLORE.
By 301423101
M.Sc. (Nursing) Degree Examination, Branch-III Obstetrics and Gynaecological Nursing,
Sri Narayani College of Nursing, Vellore.
A Dissertation submitted to
THE TAMILNADU DR. M.G.R. MEDICAL UNIVERSITY CHENNAI-600 032
In partial fulfilment of the requirement for the degree of MASTER OF SCIENCE IN NURSING.
APRIL-2016.
__________________________ ____________________________ Internal Examiner External Examiner
ŝ
ACKNOWLEDGEMENT
My heartfelt gratitude is articulated to the Almighty God and beloved SRI SAKTHI AMMA for his abundant grace, love, compassion and immense
showers of blessing, which gave me the strength and courage throughout the completion of this study.
I am grateful to our Managing Director DR. N. BALAJI Ph.D, MACE, FIMSA, FACSc, MBA, Sri Narayani Hospital and Research Centre for giving this opportunity to conduct this study.
It is my privilege to express my deep sense of gratitude to the esteemed Prof. Mrs. LALITHA PURUSHOTHAMAN.,M.Sc(N)., M.Phill., Administrative
cum Liasion Officer, Sri Narayani College of Nursing for her constant support and motivation.
I am greatly indebted and express my sincere thanks to Prof. Mrs. SUJATHA.V.M.Sc(N)., Principal and Research Co-ordinator, Sri Narayani College of Nursing, for her expert advice, and valuable guidance
throughout my study.
I wish to extend my sincere thanks to Prof. Mrs. R. SUDHA.,M.Sc(N), MBA(HM), HOD of Obstetrics and Gynaecological Nursing Department, Sri Narayani College of Nursing, for her constant directions, encouragement, nobility, motivation, valuable suggestions and excellent guidance which enlightened my path to complete the work systematically.
I wish to extend my thanks to Prof. Mr. MUTHURATHINAM.,M.Sc., Biostatistics, Sri Narayani College of Nursing for his valuable suggestions, assistance in content validity, statistical analysis & presentation of data.
ŝŝ
I wish to extend my thanks to Prof. Mr. Dr. B.G. THIRUINBAEZHILAN., MA., B.Ed., M.Phil., PhD., Voorhees College, P.G. Research Department Vellore for his suggestions and for Tamil editing of the dissertation.
I would like to express my sincere thanks to Mrs. Alice Sony.M.Sc(N)., Professor, College of Nursing, CMCH, Vellore, Dr. Mrs. Latha Venkatesan., M.Sc(N).,Ph.D., Principal of Apollo College of Nursing, Dr.Mrs.Nalini.,M.Sc.,Ph.D Vice Principal of Ramachandra Medical University, Mrs. V. Prabha.,M.Sc(N).,Ph.D Vice principal, Arun College of Nursing for their valuable suggestions and content validity.
I would like to thank all THE TEACHING, NON TEACHING FACULTY AND LIBRARY STAFFS OF SRI NARAYANI COLLEGE OF NURSING for their valuable help during the study.
I would like to thank Tmt. P. JANAKI RAVIDRAN., M.Sc., B.Ed., APGDUM., Commissioner, Vellore Municipal, for the permission to conduct my study, at Kaspa, Vellore
I would like to thank Dr. SHOBANA.,MBBS., Medical officer, Kaspa, Health Centre, Vellore, for performing clinical breast examination for the samples & her encouragement throughout the study .
I would like to thank all the women who have participated in my study, Kaspa, Urban Area, Vellore, to bring out my dissertation, in a effective way.
I express my special indebtedness, to my parents, Mr.S.Sounder Rajan, Mrs.Ganadiraviam, my husband Mr.K.Napoleon.,MA.,M.Sc(Agri)., and my beloved brothers Mr. Elvis., MA.,MRD, Dr.Mr. Arnold Rajan., M.PT., for their emotional and financial support throughout the course of study.
I express my special heartful thanks to my Mentor Mrs. C. Radhika.,M.Sc(N)., for helping in Biostatistics to bring out my dissertation
in time.
Finally, I wish to thanks one and all who are directly or indirectly responsible for the successful completion of the study.
ŝŝŝ
LIST OF CONTENTS
CHAPTER
NO
LIST OF CONTENTS
PAGE NO
I INTRODUCTION x Need for the study x Statement of problem x Objectives
x Operational definitions x Hypotheses
x Limitations
x Conceptual framework
1 5 11 11 11 12 12 13
II REVIEW OF LITERATURE 16
III RESEARCH METHODOLOGY x Research approach
x Research design
x Description of variables x Setting of the study x Population
x Sample
x Sampling technique x Sample size
x Criteria for sample selection
x Development and description of the tool x Score interpretation
x Validity and Reliability x Pilot study
x Data collection procedure x Plan for data analysis
ŝǀ
CHAPTER
NO LIST OF CONTENTS PAGE NO
IV DATA ANALYSIS AND INTERPRETATION 36
V DISCUSSION 68
VI SUMMARY AND RECOMMENDATIONS 74
VII REFERENCES 80
VIII APPENDICES
ǀ
LIST OF TABLES
TABLE
NO TITLE
PAGE NO
1 Frequency and percentage distribution of women according to
the age group. 36
2 Frequency and percentage distribution of women according to
education 37
3 Frequency and percentage distribution of women according to
religion 38
4 Frequency and percentage distribution of women according to
occupation 39
5 Frequency and percentage distribution of women according to
family monthly income 40
6 Frequency and percentage distribution of women according to
dietary habits. 41
7 Frequency and percentage distribution of women according to
family history of breast cancer. 42
8 Frequency and percentage distribution of women according to
previous knowledge of breast cancer. 43
8.1 Frequency and percentage distribution of women according to sources of information, on previous knowledge of breast cancer. 44
9 Frequency and percentage distribution of women according to
age at menarche 45
10 Frequency and percentage distribution of women according to
the marital status. 46
11 Frequency and percentage distribution of women according to
age at marriage. 47
12 Frequency and percentage distribution of women according to parity.
48
ǀŝ
TABLE
NO TITLE
PAGE NO
14 Frequency and percentage distribution of women according to the history of oral contraceptive intake. 50
15 Frequency and percentage distribution of women according to
the attainment of menopause 51
15.1 Frequency and percentage distribution of women according to
the age of attainment of menopause
.
5216 Frequency and percentage distribution of pre and posttest levels
of knowledge regarding cancer breast 53
17 Frequency and percentage of pre and posttest levels of attitude
regarding cancer breast 54
18 Frequency and percentage distribution of pre and posttest levels of expressed practices regarding cancer breast 55
19 0HDQVWDQGDUGGHYLDWLRQDQGSDLUHGµW¶YDOXHRISUHDQGSRVWWHVW levels of knowledge regarding cancer breast among women. 56
20 0HDQVWDQGDUGGHYLDWLRQDQGSDLUHGµW¶YDOXHRISUHDQGSRVWWHVW levels of attitude regarding cancer breast among women. 57
21
0HDQVWDQGDUGGHYLDWLRQDQGSDLUHGµW¶YDOXHRISUHDQGSRVWWHVW
levels of expressed practice regarding cancer breast among women.
ǀŝŝ
LIST OF TABLES ± Contd..
TABLENO TITLE
PAGE NO
22 Analysis of association between pre and post test levels of knowledge and selected demographic variable 59
23 Analysis of association between pre and post test levels of attitude and selected demographic variable 62
ǀŝŝŝ
LIST OF FIGURES
FIGURENO
TITLE
PAGE NO
1 Conceptual framework 15
2 Schematic representation of methodology 34
3 Frequency and percentage distribution of women according to the age group.
36
4 Frequency and percentage distribution of women according to education.
37
5 Frequency and percentage distribution of women according to
religion 38
6 Frequency and percentage distribution of women according to
occupation 39
7 Frequency and percentage distribution of women according to
family monthly income. 40
8
Frequency and percentage distribution of women according to
dietary habits
.
419 Frequency and percentage distribution of women according to
family history of breast cancer. 42
10 Frequency and percentage distribution of women according to
previous knowledge of breast cancer 43
11
Frequency and percentage distribution of women according to sources of information, on previous knowledge of breast cancer.
44
12 Frequency and percentage distribution of women according to
age at menarche 45
13 Frequency and percentage distribution of women according to
the marital status 46
14 Frequency and percentage distribution of women according to
age at marriage 47
15 Frequency and percentage distribution of women according to
ŝdž
FIGURE NO
TITLE
PAGE NO
16 Frequency and percentage distribution of women according to duration of breast feeding for the last child 49
17 Frequency and percentage distribution of women according to the history of oral contraceptive intake. 50
18 Frequency and percentage distribution of women according to
the attainment of menopause. 51
19 Frequency and percentage distribution of women according to
the age of attainment of menopause 52
20 Frequency and percentage distribution of pre and posttest levels of knowledge regarding cancer breast 53
21 Frequency and percentage of pre and posttest levels of attitude
regarding cancer breast 54
dž
LIST OF APPENDIX APPENDIX
NO TITLE
PAGE NO
A Letter requesting and granting permission to conduct main study
i
B Letter seeking permission to conduct main study ii
C Certificate Validation iii
D List of content experts for tool validation iv
E Certificate of English editing v
F Certificate of Tamil editing vi
G Letter requesting for participation in the study vii H Demographic variables of the women (English) viii
I Demographic variables of the women (Tamil) xix
J Lesson Plan English xxx
K Lesson Plan Tamil xlviii
džŝ
ABSTRACT
Introduction:
Breast cancer is a global health problem and also the leading cause of death in low± resourced countries.
Statement of the problem:
Effectiveness of multimedia education on levels of knowledge, attitude and expressed practices regarding cancer breast and screening among women at selected urban area, Vellore.
Objectives:
x To assess the pretest levels of knowledge, attitude and expressed practices regarding cancer breast among women.
x To evaluate the effectiveness of multimedia education regarding cancer breast among women.
x To associate the posttest levels of knowledge, attitude and expressed practices regarding cancer breast among women with selected demographic variables. x To perform screening for cancer breast by clinical breast examination.
Methods:
A Quantitative approach and a one group pre and post test research design was adopted. Systematic sampling technique was used to select 60 women in Kaspa urban area.
Results and Interpretation:
džŝŝ
expressed practices mean score was 22.3 ± 4.11 and the posttest mean score was 40.9 ± 7.23. The calculated paired ³t´ test value 21.4 was higher than the table value
2 which was significant at p<0.05 level.
Regarding the association between posttest levels of knowledge and selected demographic variables such as education, religion, and dietary habits are statistically significant at p<0.05 level. With regard to the association of posttest levels of attitude and expressed practices with selected demographic variables, religion, parity and duration of breast feeding for the last child are significantly associated at p<0.05 level respectively.
Conclusion:
The findings of the study concluded that there was significant increase in the level of knowledge, favourable attitude and good expressed practices of women after the multimedia education. This shows that the multimedia education was effective.
Keywords:
Effectiveness, multimedia education, knowledge, attitude, expressed practices, screening, cancer breast.
ϭ
CHAPTER I
INTRODUCTION
Breast cancer is a global health problem and the most common cancer amongst women, comprising 23% of the female cancers (Parkins &Fernández 2009). It is also the leading cause of cancer-related deaths in low-resourced countries. Women in any age range are at risk of breast cancer and the risks increases with advanced age (Omotara et al. 2012). Despite the development of advanced technology in the detection of breast cancer, the mortality rate remains high. Breast cancer is the main cause of cancer mortality in women aged 40±44 years old (Alwan et al. 2012; Khanjani, Noor &Rostami 2012). Although substantial improvement in survival has been reported in high-income countries, the risk continues to increase. The survival rates in middle- and low-income countries remain low (Alwan et al. 2012).
It is estimated that by 2030 the global burden of breast cancer will increase to over 2 million new case per year. Furthermore it is estimated that this increase in cases will be largely due to increasing incidence in developing regions of the world.
Ϯ
of breast cancer is increasing. This increase may be associated with greater urbanization and improved life expectancy.
About 5% -10 % (per ACS literature) of all breast cancers are thought to be related to genetic predisposition. Molecular tests are available to identify BRCA1 and BRCA2 genetic susceptibility, which is present in a small percentage of the population. BRCA1 and BRCA2 mutations are seen more often in women of Jewish ancestry. It has already been established that women with first-degree relatives who had breast cancer are at greater risk of getting it themselves. These women are encouraged to have screening tests earlier and sometimes more often than women without such a family history.
Risk is higher in women who have a personal or family history of breast cancer, biopsy-confirmed atypical hyperplasia, increased breast density, a long menstrual history (menstrual periods that started early and ended late in life), obesity after menopause, recent use of oral contraceptives or postmenopausal estrogens and progestin, who have never had children or had their first child after age 30, or who consume alcoholic beverages.
ϯ
Worldwide, breast cancer incidence rates appear to correlate with variations in diet, especially fat intake, although the specific dietary factors that affect breast cancer have not been firmly established. Vigorous physical activity and maintenance of a healthy body weight are associated with lower risk. Most data indicate tamoxifen decreases breast cancer risk and preliminary data suggest another selective estrogen-receptor modulator, raloxifene, does also.
Age at menarche is an important determinant of subsequent breast cancer risk. Estimates from a pooled analysis of the results of 21 studies shows that for each additional year age at menarche is postponed, premenopausal and postmenopausal breast cancer risk decreases by 9% and 4% respectively. The median age of menarche worldwide is 14 years with a range from 11-18 years and reported average later age of onset in Asian populations compared to the West. A study in South Indian women showed that the risk of both pre-menopausal and postmenopausal breast cancer decreased with delay of the onset of menarche.
Late menopause increases the risk of breast cancer. Women who have undergone the menopause have a lower risk of breast cancer than pre-menopausal women of the same age and childbearing pattern. Risk increases by almost 3% for each year older at menopause (natural or induced by surgery), so that a women who has the menopause at 55 rather than 45, has approximately 30% higher risk. The South Indian study showed an increased risk of breast cancer in woman who became menopausal after the age of 50.
ϰ
childbearing, the lower her risk of breast cancer. The relative risk of developing breast cancer is estimated to increase by 3% for each year of delay. Childbearing reduces the risk of breast cancer and the higher the number of full-term pregnancies, the greater the protection. The risk of breast cancer reduces by 7% with each full-term pregnancy, and overall women who have had children have a 30% lower risk than nulliparous women.
Women who breastfeed reduce their risk compared with women who do not breastfeed. The longer a woman breastfeeds, the greater the protection, the risk is reduced by 4% for every 12 months of breastfeeding. There is also evidence that the reduction in risk of breast cancer with childbirth, and higher risk with later age at first full-time birth, may be limited to oestrogen-receptor-positive tumours.
The earliest sign of breast cancer is an abnormality that shows up on a mammogram before it can be felt by the woman or her health care provider. When breast cancer has grown to the point where physical signs and symptoms exist, a breast lump, or tenderness; skin irritation or dimpling; and nipple discharge and/or pain, scaliness, ulceration, or retraction may be noticed. Breast pain is commonly due to benign conditions and is not usually the first symptom of breast cancer.
ϱ
preferably before the scheduled mammogram), and perform monthly breast self-examination. Women ages 20-39 should have a clinical breast examination by a health care professional every three years and should perform breast self-examination monthly.
In the west, majority of breast cancers (read more than 75%) present in stage 1 and 2, resulting in good survival; and there are an ever increasing numbers of patients presenting with mammography detected cancer, with no symptom. India needs to reach this achievement, and it is only with aggressive promotion of screening and awareness and proper treatment that India will achieve early detection, adequate treatment and better survival.
They are all pointing to one necessity- screening for breast cancer. Since the numbers of cases are rising, younger women are getting affected, most are presenting only after symptoms develop (so usually stage 2B and beyond, rarely earlier stage) and we cannot prevent this cancer, all we can do is to detect this cancer early. SCREENING is the way to go.
NEED FOR THE STUDY
ϲ
Breast cancer is the most common malignancy in women, accounting for 29% of all female cancers; it accounts for < 1% of all cancer cases in men. Breast cancer also is responsible for 15% of cancer deaths in women, making it the number-two cause of cancer death. An estimated 234,190 new breast cancer cases will be diagnosed in women and 2,350 new cases will be diagnosed in men in the United States in 2015, and 40,290 women and 440 men will die of this cancer. As of 2014, there were more than 2.8 million women breast cancer survivors in the United States.
In 2015, there will be an estimated 1,658,370 new cancer cases diagnosed and 589,430 cancer deaths in the US. In 2015, there will be an estimated 60,290 new cases of breast carcinoma in situ diagnosed, 83% of which will be ductal carcinoma in situ (DCIS) and 12% lobular carcinoma in situ (LCIS).
In India, the overall incidence of breast cancer is less as compared to the US. But a look at the actual number of cases shows that India is not far behind. In the year 2014, there were about 232,714 breast cancer cases reported in the US, whereas in India, 1,45,000 new cases were women affected seems less, the breast cancer burden in India has almost reached about 2/3rd of that of the US and is steadily rising .
ϳ
Breast cancer incidence rates within India display a 3- 4-fold variation across the country, with the highest rates observed in the Northeast and in major metropolitan cities such as Mumbai and New Delhi. Reason for this variation include differences in demographic (e.g.,education) reproductive (e.g., age at first child and number of children), anthropometric (e.g., adipodity) and lifestyle factors (e.g., tobacco smoking and alcohol use). The estimated number of breast cancer cases in India for the year 2010, 2015 and 2020 will be approximately 90,659; 106,124 and 123,634 respectively. So breast cancer is expected to cross the figure of 100,000 cases in year 2015.
By 2030 it is estimated that 1/5th RIWKHZRUOG¶VFDQFHUZLOOEHLQ,QGLD7KLV
means that breast cancer rates will also increase significantly. Every year there has been a rise in incidence of 0.5% across all increase of India. This trend is only expected to accelerate. Importantly, there will be a rise in breast cancer across all age groups but those under 45 years of age will be especially affected. The incidence of breast cancer will exceed 200,000 cases a year by 2035.
0 50000 100000 150000 200000 250000
2010 2015 2020 2025 2030 2035 2040
Predicted Incidence
Year
ϴ
With this increase in incidence, there will also be a corresponding increase in mortality. If no action is taken to reduce breast cancer in India and increase screening, mortality is predicted to reach almost 120,000 by 2035.
Breast cancer has overtaken cervical cancer to become the leading site of cancer in metro cities and is expected to double by 2015, experts said Wednesday. "Breast cancer has overtaken cervical cancer to become the leading site of cancer in Delhi, Bangalore, Mumbai, Chennai, Bhopal, Ahmedabad and Kolkata with the relative proportion ranging from 21.7 percent to 28.7 percent," said PK Julka, professor of Oncology, All India institute of Medical Sciences (AIIMS), New Delhi.
City or State Five-year survival rate
Bangalore 42.3%
Chennai 48%
Kerala 40%
New Delhi 55%
Lucknow 62%
India's five-year survival rate is shockingly low in comparison to the United States and China. Their five-year survival rates are 90% and 82% respectively. Even though more women are diagnosed with breast cancer in these two countries, women survive longer than their Indian counterparts and are less likely to die due to the disease.
ϵ
by women themselves. BSE benefits women in two ways: women become familiar with both the appearance and the feel of their breast and detect any changes in their breasts as early as possible. In the literature, it is stated that 90% of the times breast cancer is first noticed by the person herself. Also, several studies have shown that barriers to diagnosis and treatment can be addressed by increasing women's awareness of breast cancer.
Raising general public awareness on the breast cancer problem and the mechanisms to control as well as advocating for appropriate policies and programmes are key strategies of population based breast cancer control. Many low and middle income countries face now a double burden of breast and cervical cancer which represent top cancer killers in women over 30 years old. These countries need to implement combined strategies that address both public health problems in an effective and efficient way.
So far the only breast cancer screening method that has proved to be effective is mammography screening. There is a evidence that organized population based mammography screening programmes can reduce breast cancer mortality by around 20% in the screened group. There is no evidence on the effect of screening through breast self-examination (BSE). However, the practice of BSE has been seen to empower women, taking responsibility for their own health. Therefore, BSE is recommended for raising awareness among women at risk rather than as a screening method.
ϭϬ
advanced stage breast cancer is lower in the screened group compared to the unscreened group (Sankarnarayanan, 2011).
Researcher has observed in her personal experience has a staff nurse and supervisor in India and Abroad, that the screening for cancer breast is near nonexistent as compare to their counterparts in the developed countries. India have poor awareness and lack the will to spend resources like money and time for clinical breast examination and mammography.
Though there is no evidence on the effect of screening through breast self examination (BSE), However the practice of breast self examination (BSE) has been seen to empower women, taking responsibility for their own health , and early therefore, BSE is recommended for raising awareness among women at risk rather than as a screening method.
ϭϭ
STATEMENT OF THE PROBLEM:
³Effectiveness of multimedia education on levels of knowledge, attitude and
expressed practices regarding cancer breast and screening among women at selected urban area, Vellore´
OBJECTIVES:
1. To assess the pretest levels of knowledge, attitude and expressed practices regarding cancer breast among women.
2. To evaluate the effectiveness of multimedia education regarding cancer breast among women.
3. To associate the post-test levels of knowledge, attitude and expressed practices regarding cancer breast among women, with selected demographic variables. 4. To perform screening for cancer breast by clinical breast examination.
OPERATIONAL DEFINITIONS:
Effectiveness: The significant difference in knowledge, attitude and expressed practicesregarding cancer breast which is determined by comparing the pre and post test scores.
Multimedia Education: It refers to an instructional method adopted using multimedia consists of organized and sequential representation of information regarding cancer breast.
Knowledge: It refers to correct response given by women as measured by structured interview schedule on cancer breast.
Attitude: It refers to the way of thinking of the women regarding cancer breast as elicited through attitude scale.
ϭϮ
Screening: It refers to an examination to detect the early signs of cancer breast using breast self examination and clinical breast examination.
Cancer Breast: Uncontrolled growth of breast cells in the lobes or ducts which is malignant.
Women: Adult females who belong to the age of 30 ± 50 years.
HYPOTHESES:
H1-There are significant relationship between pretest and posttest levels of knowledge, attitude and expressed practices regarding cancer breast among women.
H2-There are significant association between posttest levels of knowledge, attitude and expressed practices regarding cancer breast among women and selected demographic variables.
LIMITATIONS:
The study is limited to women who
belong to the age group of 30-50 years.
are residing in Kaspa urban area, Vellore
ϭϯ
CONCEPTUAL FRAME WORK
The conceptual framework selected for this study is based upon the General systems theory developed by Ludwig Von Bertalanfly (1968).
According to the General systems theory, a system is a set of components or units interacting with each other within a boundary that filters the kinds and the rate of flow of inputs to and from the system.
System can be open or closed. Open systems are open for the exchanges of matter, energy and information with their environment from which the system receives input and gives back output in the form of matter, energy, and information.
Input is any type of information energy, and material that enters the systems from environment through its boundaries.
Throughput is a process that allows the inputs to be changed so, that it is useful to the system.
Output is any information, energy and material that leaves the system and enters the environment through the system boundaries.
Feedback is the environmental responses of the systems. Feedback may be positive, negative or neutral. Thus the functioning of open living system is cyclical which changes constantly.
Input:
ϭϰ
of women through structured interview schedule, likert attitude scale and checklist. This input is mentioned as pretest in this study.
Throughput:
Throughput is the activity phase, where multimedia education was given to the women by using breast model, LCD and Posters regarding cancer breast and breast self examination.
Output:
Output is the change in the levels of knowledge, attitude and expressed practices on cancer breast and breast self examination after multimedia education. It is evaluated by using the same structured interview schedule, likert attitude scale and checklist to the same samples after 7 days of multimedia education.
Feedback:
Feedback strengthens the input. Follow is essential for women who had moderately adequate or inadequate knowledge, favourable or unfavourable attitude and fair or poor expressed practices regarding cancer breast and breast self examination.
In this study before multimedia education programme, in pretest there was lack of knowledge unfavourable attitude and poor expressed practices regarding cancer breast and breast self examination. After the multimedia education, in posttest there was increased levels of knowledge, favourables attitude and good expressed practices were found.
F
IG
1:
G
E
NERAL SYSTEMS MODEL
±
LUD
WIG
VON BERTALANFFY (1968)
15 INP UT OUTP U T THROUG HPUT PRE TEST POST TEST MU L T IMED IA E D UCA T IO N & SCREENI N G De m ogra p hic Va ria ble
s of Wo
m e n x Age i n Years x Edu cation x Reli g ion x Occu p ation x Fa m il y Mo nth ly In co m e INR x Dietar y Hab its x Is th ere an y f am il y h istor y o f breast can cer x P reviou s kn o w led g e of breast can cer x
Age at Men
arc h e (Years) x Marital Status x
Age at Marriage (Years)
x P arity x Duration o f B reast f eeding f o r th e last chi ld x Histor y of oral co n tracep tiv e i n take x Have y o u attai n ed m en opause Ass es sm en t o f leve ls of k n o w led g e on can cer breast. Ass es sm en t o f L evel s of attit ude on can cer breast. Ass es sm en t o f leve ls of e x pressed practices o n can cer breast.
Multimedia Education on cancer breast b
y using b reast model, L C D, Poster, reg ardin g . x Risk factors. x Sig
ns and S
y mptoms x Diag nostic Ev aluation. x Pre v ention x B
reast self ex
ϭϲ
CHAPTER
±
II
REVIEW OF LITERATURE
A Literature review is a critical assessment of the relevant literature. A literature review discusses published information in a particular subject area within certain time period. A literature review can be just a simple summary of the sources. It might give a new interpretation of old material or combine new with old interpretations, or it might trace the intellectual progression of the field, including major debates. Depending on the situation, the literature review may evaluate the sources and advise the reader on the most pertinent or relevant matters.
An important aspect of research literature review is to make sure what is already done in relation to the problem of interest. Several studies which have been conducted in relation to intadialytic exercise which needs more focus for the development of future studies. The related literature has been organized under the following headings.
The review of literature in this study is organized as follows: Section A: Studies related to risk factors on cancer breast.
Section B: Studies related to knowledge, attitude and practices regarding cancer breast.
Section C: Studies related to breast self-examination.
ϭϳ
Section A: Studies related to risk factors on cancer breast:
Dr. Navneet Kaur.et.al, 2015 conducted a study on breast cancer risk factor profile in Indian women. This case-control study was conducted on 115 cases with diagnosed breast cancer and 127 controls. Socioeconomic, demographic, reproductive and other known risk factors were analyzed for their prevalence and odds ratio in the study population. There was a statistically significant increased risk with reproductive risk factors such as : early menarche (16 years, odds ratio (o.r) 4.36, 95% confidence interval (ci) 108-10.1, p6, o.r 2.5 ; 95% ci, 1.0-5.7; p=0.026), higher number of abortions (>2 or nil, o.r 4.5; 95% ci, 2.2-9.0; p = 10years, o.r 3.5 ; 95% ci 1.5-7.8; p = 0.006). Height (161, o.r 3.0; ci 1.0-9.9; p=0.039), history of breast biopsy (0 vs > 1, o.r 4.6; ci 1.2-16.9; p= 0.010). A higher mammographic density was found to be independent predictor of risk (75% vs 0%, o.r 5.9). This study suggests that many known reproductive risk factors have an association with increased risk for breast cancer though their prevalence is low in Indian population. Breast therapy and mammographic density are independent predictors of risk and may become useful tools in breast cancer risk assessment.
A.Gupta.et.al. 2015 conducted a structured literature search using combined keywords was undertaken on bibliographic databases including medline, cochrane database of systematic reviews, cumulative index to nursing and allied health (cinahl) and scopus. Searches were restricted to research published in english language peer-reviewed journals through December, 2014 in India. A total of 7066 women aged 15±
70 years showed varied levels of awareness on risk factors such as family history (13±
ϭϴ
reproductive history (21±90%) and obesity (34±6%). The review revealed low cancer literacy of breast cancer risk factors among Indian women, irrespective of their socio-economic and educational background. There is an urgent need for nation- and state-wide awareness programmes, engaging multiple stakeholders of society and the health system, to help improve cancer literacy in India.
P. Parameshwari. et.al. 2013 conducted a population based case control study on breast cancer and associated risk factors among 100 breast cancer cases in the Arpookara panchayat of Kottayam district in Kerala. Data were collected by interviewing the participants using a pre tested structured questionnaire. The study results revealed that age group of participants ranged from 32-70 years, early menarche < 13 years, being unmarried and single, family history of breast cancer, previous history of benign breast tumours, breast feeding less than 2 years were found to be the risk factors for the breast cancer and the birth of first child before 30 years was found to be a protective factor for breast cancer and 60% of cases belonged to lower socioeconomic status. Despite high literacy status, significantly lower awareness about symptoms of breast cancer and self-examination of the breast were noted.
ϭϵ
that generalized obesity is an important risk factor for postmenopausal breast cancer, but only among women who have never taken HRT. Lifetime weight gain is also a strong predictor of breast cancer.
Section B: Studies related to knowledge, attitude and practices regarding cancer breast:
Dorah U. Ramathuba. et.al 2014 conducted a study to assess the knowledge,
attitude and breast cancer screening practices amongst women aged 30±65 years
residing in a rural south African community. A quantitative, descriptive,
cross-sectional design was used and a systematic sampling technique was employed to
select 150 participants. The questionnaire was used to collect the data from the
participants and data analyzed descriptively using the predictive analytics software
program. The results revealed that the level of knowledge about breast cancer of
women in Makwarani community was relatively low. The attitude toward breast
cancer was negative and the majority of women had never performed breast cancer
diagnostic methods. The study concluded that health education on breast cancer
screening practices is lacking and the knowledge deficit can contribute negatively to
early detection of breast cancer. Based on the findings, community-based intervention
was recommended in order to bridge the knowledge gap.
Rabia Latif.et.al.2014 conducted a cross sectional study to assess the
knowledge and attitude of Saudi female students towards breast cancer in Saudi
Arabia. One hundred and fifty females from a university in Saudi Arabia completed a
questionnaire intended to provoke their sociodemographic information and
knowledge, attitude and practices towards breast cancer. The results revealed that
mean knowledge score was 16.6 out of 29. One hundred and six participants (70.7%)
ϮϬ
below 50% was rather less (44; 29.3%) and 50.7% participants admitted to carry out
the breast self-examination procedure. Only 13 study participants (8.7%) had clinical
breast examination and none of the participants had undergone mammography. This
study concluded that female university students have minimal knowledge of breast
cancer symptoms and management. They are also not clear about etiology and risk
factors associated with breast cancer, practice of clinical breast examination and
mammography was rare in the participants. There is a need to enhance their
knowledge regarding breast cancer and emphasize the need of breast cancer screening
programs.
Gangane , Sebastian MS 2013 a community-based cross sectional study was conducted in Wardha district, Maharashtra state in Central India in 2013 to assess the knowledge, attitude and practices about breast cancer. The sample included 1000 women (609 rural, 391 urban) aged 13-50 years, selected as representative from each of the eight development blocks in the district, using stratified cluster sampling. The
LQVWUXPHQWDOVRDVVHVVHGUHVSRQGHQWV¶NQRZOHGJHDbout breast cancer, its symptoms,
Ϯϭ
though the willingness to learn is high. Positive attitudes towards screening provide an opportunity to promote breast self-examination.
Azubuike and S.O. Okwuokei 2013 was conducted a study in Oredo municipal council of Benin City to investigate the level of breast cancer awareness, attitudes and practices towards early detection strategies. Purposive, stratified and simple random sampling were used to select 365 women from 9 health facilities in 6 wards of the municipality. Self-administered questionnaires were used. The results revealed that about 90.5% (314/347) knew about breast cancer, but only about 49.71% (172/347) knew up to 3 breast cancer risk factors. A total of 65.2% (226/347) could identify up to two breast cancer signs and symptoms. While about 56.5% (195/347) knew at least one early detection strategy, it was however only about 17.73% (61/347) that practiced regularly at least one of the early detective procedures. Practice of early detection strategies was significantly associated with knowledge (p = 0.01 respectively).
Kiguli-Malwaddeelsie. et.al 2010 conducted a study to assess the knowledge,
attitudes and practices of Ugandan women concerning breast cancer and
mammography. A descriptive cross-sectional study where 100 women were selected
by using consecutive sampling technique. They were interviewed using the
questionnaire. The results revealed that most of the women (71%) had no idea about
mammography, more than 50% did not know about risk factors for breast cancer and
ϮϮ
Section C: Studies related to breast self-examination:
Fon Peter.et.al.2015 conducted a study on knowledge, attitude and practice of breast self-examination among female undergraduate students in the university of Buea, Cameroon. The study comprised 166 female students of ages 17-30years (mean=22.8 ± 3) sampled randomly. Data was collected by a pretested self-administered questionnaire. The results revealed that only 9.0% knew how to perform BSE, only 13.9% knew what to look for while performing BSE, only 3% had performed BSE regularly. Furthermore, only 19.9% of the respondents have been to any health facility to have breast examination.
Elamurugan Sujindra.et.al.2015 conducted a study on knowledge, attitude, and practice of breast self-examination among female nursing students in IndiraGandhi medical college and research institute, Puducherry, India. A total of 254 female nursing students were included in the study and the questionnaire comprised of 21 questions (10 on knowledge, 5 on attitude, and 6 on the practice). The results revealed that response rate was 94.5%. Total mean knowledge score was 14.08 ± 3.42. 87.5% accepted that early detection can improve the chance of survival, 89.2% have heard of BSE and agreed that BSE can help in early detection of breast cancer, 93.3% felt it was necessary to do BSE and 87.5% have done BSE before, 5% of nursing students felt that doing BSE was embarrassing and only 33.3% performed BSE regularly in a year.
Ϯϯ
of 60 rural women of reproductive age group (18-45years), selected by non-probability convenient sampling method. Data was collected by administering structured knowledge questionnaire on breast self-examination prepared by the investigators. The results revealed that 1.66% of the women had very good knowledge, 3.33% women had good knowledge, 53.33% of women had average knowledge and 41.66% of women had poor knowledge.
Al-Naggar.et.al.2012 conducted a study on practice of breast self-examination among women in Malaysia. For this cross-sectional study, 250 women were selected by a simple random sampling technique. The questionnaire was consisted of three parts: socio-demographic characteristics, knowledge about BSE, and practice of BSE. About 32% of the participants reported that they have had family history of cancer and about 20% of the participants reported that they have had family history of breast cancer. The majority of the participants (88.8%) have heard about breast cancer and 78.4% of the participants have heard about BSE. Race, marital status, residency, regular exercise, awareness about breast cancer, belief that breast cancer can be detected early, belief that early detection improves the chance of survival, family history of cancer, family history of breast cancer, awareness about BSE, and belief that BSE is necessary, significantly influenced the practice of BSE among women. Practice of BSE on monthly basis was found to be 47.2% among the study participants.
Ϯϰ
Hyderabad. The study results revealed that the total mean knowledge score was 14.22 ± 8.04 (19.98 ± 3.68), the mean attitude score was 26.45 ± 5.97, for the practice the overall mean score was 12.64 ± 5.92. KAP scores upon correlation revealed a significant correlation between knowledge and attitude scores only (p<0.05). The study highlights the need for educational programs to create awareness regarding regular breast cancer screening behavior.
Section D: Studies related to effectiveness of education programme on cancer breast.
Girija Bhaskaran 2014 conducted a study to evaluate effectiveness of structured teaching programme on breast self-examination among industrial women workers between age group of 30-60 years in Chennai. 120 women were selected by non-probability sampling technique and the samples were interviewed by using self administered questionnaire. The results revealed that in pretest majority of the samples were having inadequate knowledge (88%) whereas in posttest majority of samples were gained adequate knowledge(81%), it shows that structured teaching programme was helpful for the women working in various industries in Chennai about breast self- examination.
Abduelmula R. Abduelkarem.et.al.2014 conducted a study to assess the knowledge of breast cancer among female students at the college of pharmacy at the University of Sharjah, UAE, to evaluate the impact of the intervention program
GHVLJQHG E\ WKH UHVHDUFKHUV RQ WKH VWXGHQW¶V NQRZOHGJH RQ WKH GLVHDVH ULVN IDFWRUV
Ϯϱ
the personal information and socio-demographic characteristics,general knowledge on breast cancer, knowledge of breast cancer risk factors, symptoms, and screening tests, perception of management and outcomes ofbreast cancer. The results revealed that a total of 120 pharmacy students from the 4th year (n = 70) and the5th year (n = 50) had completed the survey for the pre-intervention phase of the study. For the post intervention phase of the study, only 63 students from the 4th year and 48 students from the 5th year returned their completed questionnaire, giving a response rate of 90% and 96% respectively. Almost one quarter (59 (25.5)) of the students included in the study reported that they had a history of breast cancer in their family respectively. A high proportion (206 (89.2%)) of the students from both levels showed their interest in participating in activities to promote breast awareness, despite the fact that almost three quarters (161 (70%)) of the students reported that they had never been participated in any previous breast awareness programs. The awareness of students under investigation about self-examination was clearly improved at the end of the study period. Eighty (66.7%) of the students from both levels reported that the breast self-examination is recommended for female ³once a month´.
Ϯϲ
was found after health education. The percentage of students with poor knowledge was reduced from 43.16% to 18.47% following health education.
Sushmitha Karkada 2013 conducted a study to determine effectiveness of an informational leaflet on knowledge regarding breast cancer among women of reproductive age. The study adapted evaluative approach and the design was one group pretest posttest design. The study was carried among 100 women of reproductive age group (15-45 years) residing at Mattar village, Shirva panchayat, Udupi district, Karnataka, India. Knowledge was assessed using structured knowledge questionnaire on breast cancer. A significant difference between pretest and posttest knowledge scores was found (mean difference 8.58, t=25.83). The study concluded that imparting knowledge regarding breast cancer is useful to maintain healthy life style practices and also promotes one's own as well as others wellbeing.
Ϯϳ
Ϯϴ
CHAPTER
±
III
METHODOLOGY
Research methodology refers to the techniques used to structure a study to gather and analyze information in a systematic fashion.
Polit & Hungler, 2003.
This chapter deals with the research design, setting, population, sample size, criteria for selection of the sample, development and description of tool, pilot study, data collection and plan for data analysis.
RESEARCH APPROACH
The Research approach used for the study is Quantitative Research approach.
RESEARCH DESIGN
The research design used for the study is one group pretest - posttest pre experimental design. It is an empirical study used to estimate the impact of an intervention on its target population.
The research design is represented as follows
O1 X O2
O1 - Pretest to assess the levels of knowledge, attitude and expressed practices regarding cancer breast among women by using a structured interview schedule, likert scale and checklist.
X - Multimedia education on cancer breast
Ϯϵ
VARIABLES
Independent variable ± Multimedia education on cancer breast
Dependent variable ± levels of knowledge, attitude and expressed practices regarding Cancer breast
SETTING OF THE STUDY
The study was conducted in Kaspa urban area at Vellore district, TamilNadu. The selection of this setting for the present study is on the basis of geographical proximity, feasibility of the study and sample availability.
POPULATION
The population of this study includes women who are residing at Kaspa urban area, Vellore.
SAMPLE
The samples of the present study are women between the age group of 30-50 years who residing at Kaspa urban area, Vellore.
SAMPLING TECHNIQUE
Systematic sampling technique was used for the study.
SAMPLE SIZE
ϯϬ
CRITERIA FOR SAMPLE SELECTION
Inclusion CriteriaWomen who,
x are in the age group 30-50 years. x understand and/or speak Tamil.
x are available at the time of data collection x are willing to participate in the study.
Exclusion criteria Women who,
x has undergone screening within 6 months.
x are diagnosed with and treated for breast cancer.
x with visual and hearing impairment.
DEVELOPMENT OF THE TOOL
Structured interview schedule for knowledge, 5 point Likert Scale for attitude and checklist for expressed practices were developed and content validated by the experts.
DESCRIPTION OF TOOL
The tool for assessing the levels of knowledge, attitude and expressed practices regarding cancer breast among women is divided into four sections.
ϯϭ
SECTION B: It consists of 25 knowledge questions related to causes and risk factors, signs and symptoms, screening test, and prevention of cancer breast.
SECTION C: It consists of 12 items of attitude on cancer breast of which 5 items are positively and 7 items are negatively worded.
SECTION D: It consists of 10 items of expressed practices on cancer breast.
SCORE INTERPRETATION
x The awareness of breast cancer is measured in terms of knowledge score. Each
correct response is given a score of one and a wrong answer score of zero. The maximum score is 25, to interpret levels of knowledge the scores are distributed as follows,
<50% - Inadequate knowledge. 50-74.9% - Moderately adequate knowledge. 75% and above - Adequate knowledge.
x The attitude of cancer breast is measured by 5 point Likert scale and the levels of attitude scores are interpreted as follows.
<50% - unfavourable attitude. 50-74.9% - moderately favourable attitude. 75% and above ± favourable attitude.
x The Expressed practices of cancer breast are measured by checklist and the
scores are interpreted as follows.
<50% - poor expressed practices. 50-74.9% - fair expressed practices.
ϯϮ
VALIDITY AND RELIABILITY
To determine the content validity, the tool was submitted to the 5 experts. After obtaining valuable suggestions, necessary modifications were made accordingly. The reliability of the tool was established by test and retest method.
The reliability of knowledge scale r = 0.99. The reliability of attitude scale r = 0.99. The reliability of expressed practices scale r = 0.96.
PILOT STUDY
A pilot study was conducted to test the reliability, feasibility and practicability of the study. Pilot study was conducted in Kaspa urban health post. Six women who met the inclusion criteria were selected by using systematic sampling technique. A pretest was conducted followed by multimedia education was given by using breast model, LCD and posters on cancer breast. After 7 days posttest was conducted by using the same structured interview schedule, likert scale and checklist to the same samples and the results were analyzed. The pilot study revealed that the study was feasible for main study.
DATA COLLECTION PROCEDURE
ϯϯ
scale and checklist then multimedia education was given regarding cancer breast by using breast model, LCD and posters. After seven days posttest was conducted by using the same interview schedule, likert scale and checklist.
PLAN FOR DATA ANALYSIS
The collected data were coded, tabulated and analyzed by using descriptive and inferential statistics.
Descriptive statistics:
x Frequency and percentage distribution is used to analyze the selected demographic variables.
x Mean and standard deviation is used to assess the levels of knowledge, attitude and expressed practices regarding cancer breast.
Inferential statistics:
x 3DLUHGµW¶WHVWZDVXVHGWRDVVHVVWKHHIIHFWLYHQHVVRIPXOWLPHGLDHGXFDWLRQRQ
levels of knowledge, attitude, expressed practices and screening regarding cancer breast among women.
x µ&KL¶±Square was used to associate the posttest levels of knowledge, attitude
and expressed practices with selected demographic variables.
ϯϰ
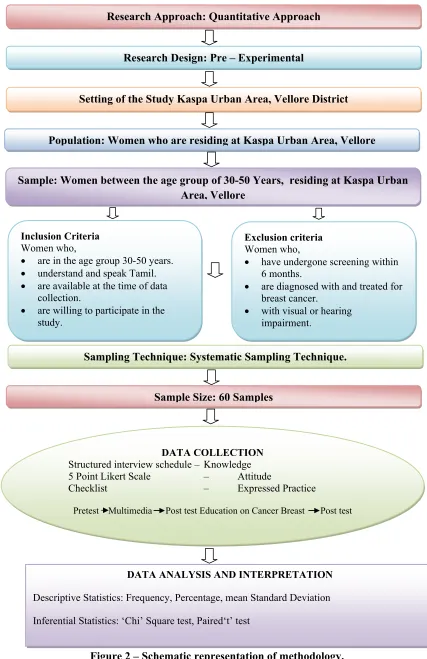
Figure 2 – Schematic representation of methodology. Research Approach: Quantitative Approach
Research Design: Pre – Experimental
Setting of the Study Kaspa Urban Area, Vellore District
Population: Women who are residing at Kaspa Urban Area, Vellore
Sample: Women between the age group of 30-50 Years, residing at Kaspa Urban Area, Vellore
Sampling Technique: Systematic Sampling Technique.
Sample Size: 60 Samples
DATA COLLECTION Structured interview schedule – Knowledge 5 Point Likert Scale – Attitude
Checklist – Expressed Practice
Pretest Multimedia Post test Education on Cancer Breast Post test
DATA ANALYSIS AND INTERPRETATION
Descriptive Statistics: Frequency, Percentage, mean Standard Deviation
Inferential Statistics: ‘Chi’ Square test, Paired‘t’ test Inclusion Criteria
Women who,
x are in the age group 30-50 years.
x understand and speak Tamil.
x are available at the time of data collection.
x are willing to participate in the study.
Exclusion criteria Women who,
x have undergone screening within 6 months.
x are diagnosed with and treated for breast cancer.
ϯϱ
CHAPTER IV
DATA ANALYSIS AND INTERPRETATION
This chapter deals with the analysis and interpretation of data collected from 60 samples to assess the knowledge, attitude and expressed practices on cancer breast among women in Kaspa urban area, Vellore.
Analysis and interpretation of the data were based on collection of the data through systemic sampling technique. Descriptive and inferential statistics were used for the analysis of the data.
As per the objectives of the study, the interpretation has been organized and tabulated as follows:
Section I: Frequency and percentage distribution of demographic variables
Section II: Data on pre and posttest levels of knowledge, attitude and expressed practices regarding cancer breast among women.
ϯϲ
SECTION I
[image:52.612.132.511.197.314.2]Frequency and percentage distribution of demographic variables
Table 1: Frequency and percentage distribution of women according to the age group.
n=60
AGE IN YEARS FREQUENCY PERCENTAGE (%)
30-35 36-40 41-45 46-50
09 31 17 03
15.0 51.7 28.3 5.0
Fig 3 - Frequency and percentage distribution of women according to the age group.
Table 1 and figure 3 represents that majority of the women 31 (51.7%) were in the age group of 36-40 years whereas 17 (28.31%) were in the age group of 41-45 years, 9 (15%) were in the age group of 30-35 years and only 3(5%) were in the group of 46 ± 50 years.
Ϭ ϭϬ ϮϬ ϯϬ ϰϬ ϱϬ ϲϬ
ϯϬͲϯϱ ϯϲͲϰϬ ϰϭͲϰϱ ϰϲͲϱϬ
ϯϳ
Table.2 Frequency and percentage distribution of women according to education n=60
EDUCATION FREQUENCY PERCENTAGE
(%) Illiterate
Primary High school Higher secondary Degree and above
25 22 13 - -
41.7 36.7 21.6 - -
Fig 4 - Frequency and percentage distribution of women according to education. Table 2 figure 4 depicts that many of the women 25 (41.7%) were illiterates, 22 (36.7%) studied upto primary education, 13(21.6%) studied up to high school education, none of them had Higher Secondary, Degree and above education.
Ϭ ϱ ϭϬ ϭϱ ϮϬ Ϯϱ ϯϬ ϯϱ ϰϬ ϰϱ
Ϯ͘ϭ͘/ůůŝƚĞƌĂƚĞ Ϯ͘ϮWƌŝŵĂƌLJ Ϯ͘ϯ,ŝŐŚƐĐŚŽŽů Ϯ͘ϰ,ŝŐŚĞƌ
ϯϴ
Table.3 Frequency and percentage distribution of women according to religion n=60
RELIGION FREQUENCY PERCENTAGE (%)
Hindu Muslim Christian others
27 33 - -
[image:54.612.127.501.281.528.2]45.0 55.0 - -
Fig 5 - Frequency and percentage distribution of women according to religion
Table 3 and figure 5 depicts that majority of the women 33 (55%) were Muslims, 27 (45%) were Hindus and nobody belong to Christian and other religions.
Ϭ ϭϬ ϮϬ ϯϬ ϰϬ ϱϬ ϲϬ
,ŝŶĚƵ DƵƐůŝŵ ŚƌŝƐƚŝĂŶ KƚŚĞƌƐ
ϯϵ
Table 4. Frequency and percentage distribution of women according to occupation
n=60
OCCUPATION FREQUENCY PERCENTAGE ( %)
Home maker Self- employed Skilled labour Unskilled labour Professionals Others
56 - - 4 - -
93.3 - - 6.7
[image:55.612.129.525.111.511.2]- -
Fig 6 - Frequency and percentage distribution of women according to occupation
Table 4 figure 6 shows that majority of the women 56 (93.3%) were home makers, only 4 (6.7%) were unskilled labours, no one belongs to skilled labour, self-employed, or professionals.
KĐĐƵƉĂƚŝŽŶ
ϰϬ
Table 5. Frequency and percentage distribution of women according to family monthly income.
n=60
FAMILY MONTHLY INCOME FREQUENCY PERCENTAGE(%) Up to 4,000/-
4,001± .6,000/- 6,001-8,000/- 8001-10,000/- Above 10,000/-
41 14 5
- -
68.4 23.3 8.3
- -
Fig 7 - Frequency and percentage distribution of women according to family monthly income.
Table 5 and figure 7 depicts that majority of the women 41 (68.4%) had the
monthly income upto 4000/-, 14(23.3%) had the monthly income of 4001-
6000/- and minimum number of women 5(8.3%) had the monthly income of 6001-
8000. None of them had the monthly income of above 8001.
hƉƚŽ
͕ʹZƐ͘ϲ͕ϬϬϬͬͲ
ďŽǀĞϭϬ͕ϬϬϬͬͲ
Ϭ ϭϬ ϮϬ ϯϬ ϰϬ ϱϬ ϲϬ ϳϬ ϴϬ
ϰϭ
Table 6. Frequency and percentage distribution of women according to dietary habits.
n=60 DIETARY HABITS FREQUENCY PERCENTAGE (%) Pure vegetarian
Non-vegetarian Ovo Vegetarian
- 59 01
- 98.3
[image:57.612.127.490.257.499.2]1.7
Fig 8 - Frequency and percentage distribution of women according to dietary habits.
Table 6 and Figure 8 represents that majority of the women 59(98.3%) were non -vegetarians and only one (1.7%) was a Ovo-vegetarian, no one were pure -vegetarians.
Ϭ ϭϬ ϮϬ ϯϬ ϰϬ ϱϬ ϲϬ ϳϬ ϴϬ ϵϬ ϭϬϬ
ϰϮ
Table 7. Frequency and percentage distribution of women according to family history of breast cancer.
n=60
FAMILY HISTORY OF BREAST CANCER
FREQUENCY PERCENTAGE ( %)
Yes No
01 59
[image:58.612.125.507.127.493.2]1.7 98.3
Fig 9- Frequency and percentage distribution of women according to family history of breast cancer.
Table 7 and figure 9 represents that majority 59 (98.3%) women were not having the family history of breast cancer, and only one (1.7%) had the family history of breast cancer. The grandmother of the sample had history of cancer breast at the age of 75 years.
Ϭ ϮϬ ϰϬ ϲϬ ϴϬ ϭϬϬ ϭϮϬ
zĞƐ EŽ
ϰϯ
Table 8. Frequency and percentage distribution of women according to previous knowledge of breast cancer.
n=60 PREVIOUS KNOWLEDGE OF
BREAST CANCER
FREQUENCY PERCENTAGE (%)
Yes No
25 35
[image:59.612.125.485.118.505.2]41.7 58.3
Fig 10 - Frequency and percentage distribution of women according to previous knowledge of breast cancer
Table 8 and figure 10 shows that majority of the women 35(58.3%) were not having the previous knowledge on breast cancer whereas 25(41.7%) had previous knowledge on breast cancer.
ϰϮй
ϱϴй
WƌĞǀŝŽƵƐŬŶŽǁůĞĚŐĞŽĨďƌĞĂƐƚĐĂŶĐĞƌ
ϰϰ
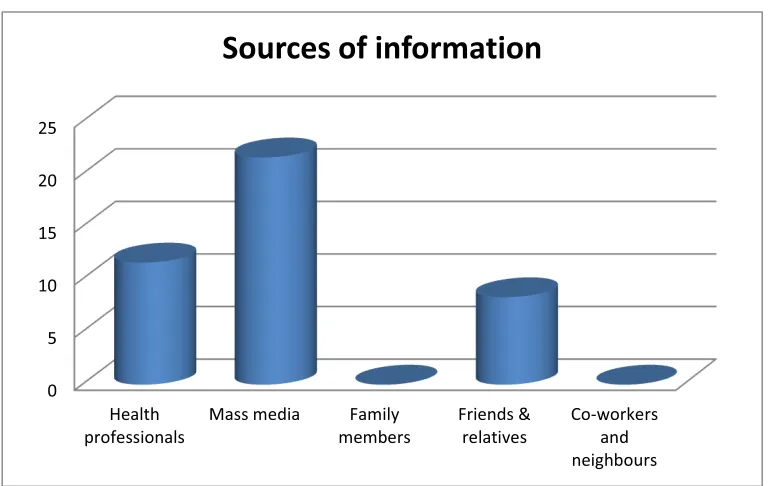
Table 8.1. Frequency and percentage distribution of women according to sources of information, on previous knowledge of breast cancer.
n=25 SOURCES OF INFORMATION
ON BREAST CANCER
FREQUENCY PERCENTAGE(%) Health professionals
Mass media Family members Friends & relatives Co-workers and neighbors
7 13
- 5
-
11.6 21.6 - 8.3
[image:60.612.128.514.268.511.2]-
Fig 11 - Frequency and percentage distribution of women according to sources of information, on previous knowledge of breast cancer.
Table 8.1and figure 11 depicts that majority of the women 13 (21.6%) received information regarding breast cancer through mass media whereas 7(11.6%) got information through health professionals and minimum of 5(8.3%) had information through friends and relatives. No one had previous information regarding breast cancer through family members, co-workers or neighbors.
Ϭ ϱ ϭϬ ϭϱ ϮϬ Ϯϱ
,ĞĂůƚŚ
ϰϱ
Table 9. Frequency and percentage distribution of women according to age at menarche
n=60 AGE AT MENARCHE FREQUENCY PERCENTAGE(%) Below 10
10-11 12-13 14-15 Above 15
- 8 40 10 2
[image:61.612.129.528.284.525.2]- 13.3 66.7 16.7 3.3
Fig 12 - Frequency and percentage distribution of women according to age at menarche
Table 9 and figure 12 represents that majority of the women 40(66.7%) attained menarche between the age of 12-13 years, 10(16.7%) attained menarche at the age of 14-15 years, 8(13.3%) attained menarche at the age of 10-11 years, minimum of 2(3.3%) attained menarche above 15 years, and no one attained menarche below 10 years.
Ϭ ϭϬ ϮϬ ϯϬ ϰϬ ϱϬ ϲϬ ϳϬ ϴϬ
ϰϲ
Table 10. Frequency and percentage distribution of women according to the marital status.
n=60
MARITAL STATUS FREQUENCY PERCENTAGE
(%) Unmarried
Married Widowed Divorced others
- 40 20 - -
- 66.7 33.3 - -
Fig 13 - Frequency and percentage distribution of women according to the marital status.
Table 10 and figure 13 depicts that majority of the women 40(66.7%) were married whereas 20 (33.3%) were widowed. None of them were unmarried or divorced.
DĂƌŝƚĂůƐƚĂƚƵƐ
ϰϳ
Table 11. Frequency and percentage distribution of women according to age at marriage.
n=60
AGE AT MARRIAGE FREQUENCY PERCENTAGE (%) Below 18
18-22 23-26 27-30 Above 30
18 32 10 - -
[image:63.612.128.496.226.519.2]30 53.3 16.7 - -
Fig 14 - Frequency and percentage distribution of women according to age at marriage
Table 11 and figure 14 represents that majority of the women 32(53.3%) were married at the age of 18-22 years whereas 18(30%) were married below 18 years, minimum of 10 (16.7%) were married at the age of 23-26 years, and none of the women were married above 26 years.
Ϭ ϭϬ ϮϬ ϯϬ ϰϬ ϱϬ ϲϬ
ĞůŽǁϭϴ ϭϴͲϮϮ ϮϯͲϮϲ ϮϳͲϯϬ ďŽǀĞϯϬ
ϰϴ
Table 12. Frequency and percentage distribution of women according to parity.
n=60
PARITY FREQUENCY PERCENTAGE (%)
Nulliparous One
Two
Three & above
5 - 13 42
[image:64.612.126.525.114.475.2]8.3 - 21.7 70.0
Fig 15 - Frequency and percentage distribution of women according to parity.
Table 12 and figure 15 depicts that majority of the women 42 (70%) had three or more children and 13(21.7%) women had 2 children, minimum of 5(8.3%) women were nulliparous and no one had one child.
Ϭ ϭϬ ϮϬ ϯϬ ϰϬ ϱϬ ϲϬ ϳϬ ϴϬ
EƵůůŝƉĂƌŽƵƐ KŶĞ dǁŽ dŚƌĞĞΘĂďŽǀĞ
ϰϵ
Table.13. Frequency and percentage distribution of women according to duration of breast feeding for the last child.
n=60 DURATION OF BREAST
FEEDING FOR THE LAST CHILD.
FREQUENCY PERCENTAGE (%)
No breast feeding Up to 6 months Up to 1 year More than 1 year
05 12 18 25
[image:65.612.127.527.281.535.2]8.3 20.0 30.0 41.7
Fig 16 - Frequency and percentage distribution of women according to duration of breast feeding for the last child
Table 13 and figure 16 represents that majority of the women 25(41.7%) breastfed their last child more than 1 year, 18 (30%) women breast fed their child up to 1year, 12 (20%) women breastfed their child up to 6 months, 5(8.3%) women were nulliparous and had no breastfeeding experience.
Ϭ ϱ ϭϬ ϭϱ ϮϬ Ϯϱ ϯϬ ϯϱ ϰϬ ϰϱ
ϱϬ
Table 14. Frequency and percentage distribution of women according to the history of oral contraceptive intake.
n=60 HISTORY OF ORAL
CONTRACEPTIVE INTAKE.
FREQUENCY PERCENTAGE (%)
Yes No
- 60
[image:66.612.125.528.174.480.2]- 100
Fig 17 - Frequency and percentage distribution of women according to the history of oral contraceptive intake.
Table 14 & figure 17 depicts that none of the women had the history of oral contraceptives intake.
Ϭ ϭϬ ϮϬ ϯϬ ϰϬ ϱϬ ϲϬ ϳϬ
zĞƐ EŽ
ϱϭ
Table.15. Frequency and percentage distribution of women according to the attainment of menopause.
n=60 ATTAINED MENOPAUSE FREQUENCY PERCENTAGE (%)
Yes No
18 42