City, University of London Institutional Repository
Citation
:
Falconieri, S. & Bennouri, M. (2015). Single versus multiple banking: lessons from initial public offerings. The European Journal of Finance, doi:10.1080/1351847X.2015.1053149
This is the accepted version of the paper.
This version of the publication may differ from the final published
version.
Permanent repository link:
http://openaccess.city.ac.uk/12005/Link to published version
:
http://dx.doi.org/10.1080/1351847X.2015.1053149Copyright and reuse:
City Research Online aims to make research
outputs of City, University of London available to a wider audience.
Copyright and Moral Rights remain with the author(s) and/or copyright
holders. URLs from City Research Online may be freely distributed and
linked to.
City Research Online: http://openaccess.city.ac.uk/ [email protected]
1
Single versus Multiple banking:
Lessons from Initial Public Offerings
Moez Bennouri* Sonia Falconieri** Maher Kooli***
Abstract
A vast research in banking addresses the question of the costs and benefits of multiple bank relationships versus a single bank relationship. Although no clear-cutting conclusion is reached, several contributions suggest that multiple bank relationships might lead to a sub-optimal level of monitoring, compared to a single bank relationship, as a result of free riding and coordination problems. We take a novel approach to tackle this research question, by looking at the role, if any, played by the number of lending relationships in initial public offerings (IPOs). We look at the short-term performances of IPOs as measured by underpricing and find that firms that go public with multiple bank relationships exhibit more underpricing than those that go public with a single bank relationship. This finding is independent of the number of bank relationships and/or whether any of the lending banks also acts as underwriter in the offering. We interpret our results as suggesting that the market attributes a weaker certification role to multiple bank relationships because of their less effective monitoring of IPO firms.
* Moez Bennouri, NEOMA Business School, Rouen campus, Boulevard André Siegfried, 76130 Mont-Saint-Aignan, France, phone: +33 (0)2 32 82 4736, email: [email protected];
** Sonia Falconieri (corresponding author), Cass Business School, 106 Bunhill Row, EC1Y 8TZ, London, United Kingdom, phone:+44 (0) 20 7040 8418, email: [email protected];
*** Maher Kooli, School of Management, Université du Québec à Montréal, Department of Finance, 315 Rue Sainte-Catherine Est, Montréal, Québec, CANADA H2X 3X2, Tel: 514.987.3000, ext. 2082, Fax: 514.987.0422, Email: [email protected].
2
1. Introduction
Firms often receive funding from more than one bank. Ongena and Smith (2000) document that
on a sample of firms spanning across 20 European countries less than 15% of the firms borrow
from a single bank. Although multiple banking seems to be more common among large firms due
to its high transactions costs, there is a large evidence documenting reliance on multiple lenders
also among small and medium businesses (Detragiache et al. (2000) for Italy; Farinha and Santos
(2002) for Portugal and Guiso and Minetti (2010) for US). The question of the advantages of
multiple bank relationships relative to a single bank relationship has attracted a lot of interest in
the banking literature and several explanations have been put forward.1
This paper contributes to this literature by looking at the impact, if any at all, of the number of
bank relationships on the short term performance of initial public offering (IPO) firms as measured
by underpricing. IPO firms are an interesting laboratory to investigate this question as they are
characterized by a high degree of ex-ante uncertainty and information asymmetry. The monitoring
by their relationship banks is very important and, indeed, several papers document that the
certification role of lending banks reduces the cost of going public for IPO firms (Slovin and
Young, 1990; James and Wier, 1990, Schenone, 2004). However none of the existing papers
investigates whether the benefits of bank lending on IPO performances depend on the number of
bank relationships developed prior to the IPO date.2
The reason why we believe the number of bank relationships could potentially matter for IPO
firms is that an extensive literature in banking, but not only, shows that when there are multiple
1 See Degryse, Kim and Ongena (2009) for a complete survey of the empirical contributions on multiple banking
relationships.
2We are here interested in the credit relationships developed by IPO firms with banks prior to the IPO date. Hence
3
principals monitoring an agent in environments characterized by asymmetric information,
coordination and free riding problems are likely to arise and adversely affect the level of
monitoring (Carletti et al. (2007), Khalil et al. (2007)).3 If this is the case then the certification role
of multiple bank relationships for IPO firms might be weakened and, consequently, have a smaller
beneficial impact on the IPO performance.
We test this hypothesis on a sample of 381 US IPOs between 1998 and 2008 and find that firms
that have multiple banking relationships at the IPO date are fundamentally different from those
with a single banking relationship. Specifically, we find that IPO firms with multiple bank
relationships are generally larger but not necessarily less profitable contrary to what predicted by
Carletti et al. (2007). More importantly, our results show that IPOs with multiple bank
relationships are significantly more underpriced than IPOs with a single bank relationship after
controlling for several factors that could explain the difference in the level of underpricing thereby
providing convincing support to our main hypothesis. However, we find that the impact on the
underpricing is not increasing in the number of banks or in the strength of the relationship. Finally,
we investigate whether the effect on underpricing of multiple banking relationships is influenced
by whether the firm decides to choose (at least) one of its relationship banks as its IPO underwriter,
but, contrary to Schenone (2004), we do not find any empirical evidence supporting this
hypothesis.
Our results suggest that the certification role of multiple bank relationships is perceived by the
market as weaker than that of a single bank relationship, thereby supporting the view that multiple
banks might be less effective at monitoring their companies.
3Similarly, in the venture capital literature a couple of recent papers (Chahine et al.(2012), Falconieri et al. (2013))
4
The remainder of the paper is organized as follows. The next section reviews the relevant
literature and presents our testable hypothesis. In Section 3 we discuss in details the construction
of our sample. The results of the empirical analysis are discussed in Section 4. The last Section
concludes.
2. Literature review and hypothesis development
According to Diamond (1984), banks are considered to facilitate the lender-borrower
relationship because they are able to monitor firms and, consequently, mitigate the asymmetric
information problems between lenders and borrowers. Hence, monitoring is acknowledged as a
key function of banks. However, the literature also acknowledges that the effectiveness of the
monitoring function and thus of the ability of banks to mitigate the asymmetric information
problems between lenders and borrowers might depend on the number of bank relationships a firm
establishes. It seems clear that multiple banking faces a trade-off between the benefits in term of
risk diversification and the costs in term of duplication of effort and free-riding problem which
can undermine the effectiveness of their monitoring (Diamond, 1984). On the other hand, single
banking exposes firms to the classical hold-up problem resulting from the informational monopoly
power of the single bank (Sharpe, 1990 and Rajan, 1992) and to inefficient liquidation and
constrained financing opportunities (Detragiache et al. (2000), Gopalan et al. (2011)).
More recent papers have attempted to theoretically analyze the single versus multiple bank
relationships trade-off by focusing on the efficiency of having multiple principals monitoring an
agent in the presence of asymmetric information. Carletti et al. (2007) develop a model where
banks are subject to a double moral hazard problem, vis-à-vis depositors and vis-à-vis firms, and
face limited diversification opportunities. In this context, the authors show that whether the
5
trade-off between the benefits from diversification associated with multiple banks and their cost
in term of duplication of efforts and free-riding problem. The empirical predictions that follow
from their model suggest that multiple banking should become more likely when firms have lower profitability, lower equity and face high monitoring costs. This seems to be consistent with the existing empirical evidence (Degryse and Ongena (2001), Guiso and Minetti (2010)). Khalil et al.
(2007) achieve similar conclusions to Carletti et al. (2007) in a more general set up that can be
applied to financial contracts with multiple financiers. They develop of a model of multiple
principals monitoring a common agent. Their focus is on the design of the contract as well as the
level of monitoring as a result of the degree of coordination among the principals. They show that
when coordination is difficult, which typically occurs when principals have conflicting objectives,
free riding results in sub-optimally poor level of monitoring.
The beneficial effect of bank lending for IPO firms has been widely documented in the IPO
literature. Slovin and Young (1990) provide evidence that the existence of bank debt and of credit
lines lowers the expected initial return (underpricing) associated with IPOs. The rationale for this
result lies in the certification role played by bank debt which becomes a signal to the market of the
firm’s value. Since, underpricing can be interpreted as a premium for ex-ante uncertainty about
the firm market value (Ritter (1984), Beatty and Ritter (1986)), the certification role played by
banks enables to reduce the ex-ante uncertainty surrounding the firm thereby leading to less
underpricing (James and Wier (1990)). The evidence has recently received further support by
Benzoni and Schenone (2010) who document that firms that have more leverage exhibit lower
underpricing. They focus on bank relationships with institutions that could potentially underwrite
the company’s stocks at the IPO. Their findings show, consistently with Schenone (2004), that the
6
firm chooses to go public with an underwriter other than its relationship bank. Specifically, using
a sample of US IPOs between 1998 and 2000, the authors find that having a relationship bank prior
to the IPO can decrease underpricing by up to 17%.
Overall, these results show that bank lending contributes to reduce information asymmetry
between IPO market participants.4 This occurs because of the certification effect associated with
the monitoring role played by lenders. Based on the banking literature, this monitoring efficiency
depends however on the structure of the lending relationship. Because of coordination issues
related to multiple banks (Khalil et al, (2007)) or costly duplicated monitoring, the impact of bank
lending on the degree of asymmetric information in IPO markets would be mitigated by the
structure of the lending relations of IPO firms. Thus, we hypothesize that multiple banks might
actually result in less effective monitoring which would weaken their certification role for IPO
firms and hence result in larger underpricing.
Based on the above discussion, we can formulate our central hypothesis as following:
H1: Firms that go public with a single bank relationship exhibit smaller IPO underpricing than
those that go public with multiple bank relationships.
This hypothesis is tested using a dummy variable for whether the firm has one or more than one
bank relationships. However, the literature on multiple banking previously surveyed suggests that
the drawbacks of multiple bank relationships might increase in the number of relationships. This
occurs because free-riding in monitoring as well as coordination between multiple bank
4 We should note that we focus in this paper on asymmetric information as an IPO underpricing determinant.
7
relationships worsen with the number of bank relationships. Consistently with this conjecture, we
then test the following second hypothesis.
H2: IPO underpricing increases with the number of bank relationships.
H2 aims at explicitly investigating whether the effect of multiple banking relationships on
underpricing is discrete or it monotonically increases in the number of banking relationships.
Schenone (2004) shows that firms using their relationship banking as their underwriter in the
IPO are less underpriced than those who do not. She argues that the certification role played by
underwriters is strengthened by the existence of lending relations between the firm and its
underwriter. Consistently with her argument, we investigate whether IPO firms with multiple
banking relationships benefit from using one or more of their relationship banks as their
underwriter relative to those who do not do so. This translates in testing the following hypothesis:
H3: Firms with multiple banking relationships that use one or more of their relationship banks as
their underwriter(s) in the IPO experience less underpricing than firms with multiple banking
relationships who do not do so.
Otherwise stated, the previous hypothesis investigates whether the use of a relationship bank as
IPO underwriter can mitigate the negative impact of multiple banking relationships on the IPO
performance as measured by the underpricing.
Our previous hypothesis assumes that all banking relationships are equally important which
justifies then to take the number of relationships as a proxy for the efficiency of monitoring.
However, while firms may borrow from more than one bank, these relationships might be
asymmetric to the extent that firms might develop closer ties with only a few of them from which
8
document that firms with multiple lending banks do borrow more from only some of them. For
instance they find that firms with three lenders would typically borrow around 65% from one bank
and they claim that similar patterns are documented in other countries as well. If this is the case,
we can expect that the largest lenders have stronger incentives to monitor the borrowing firm.
Consequently, it would be more appropriate in our analysis to consider the “strength” of the
lending relationship (or alternatively the concentration of borrowing) rather than the simple
number of relationships. In order to do this, we test the following hypothesis:
H4: For firms with multiple banking relationships, underpricing is negatively related to the
strength of the lending relationships.
We use several proxies for the strength of the lending relationships such as the average loan
value and the loan concentration using a Herfindhal Index.
3. Data
We collect a sample of IPOs using the Thomson Financial Securities Data Company U.S. New
Issues Database (SDC) for the period from January1998 to June 2008. Consistent with previous
researches, we remove depository shares, spin-offs, real estate investment trusts (REITs), reverse
leveraged buyouts, unit offers, financial institutions, savings and loans, closed-end funds, and IPOs
with offer prices less than five dollars. We collect from SDC database information about firms
(age, industry, etc.) and the characteristics of each issue (price, number of shares, underwriters,
prospectus price ranges, etc.).5 Some additional information about firms and issues like the
classification of companies as internet based and information about financial and operational
5 We correct some mistakes in the SDC database using information from Jay Ritter’s
9
performances of firms the year before going public are collected using Jay Ritter’s webpage and
COMPUSTAT. The final sample contains a total of 1661 issues.
This sample is then matched with Dealscan which provides information about loan deals
gathered mainly from SEC filings and contacts with the credit industry (Robert and Sufi, 2009).
For each company in our SDC sample, we search for information about loans and identify the
financial institutions that provided loans to the company up to five years prior to the IPO date.
Loans in Dealscan are presented as deals or packages. Each deal may contain many facilities
further split in different tranches. Each facility can be a sole lender loan or a syndicated loan. Since
we are interested in the number of bank relationships for IPO firms, we base our analysis on the
facility level in order to avoid information about potential relationships that can be ignored if we
use the deal level analysis. For sole lender facilities, we use the name of the single lender as bank
relation. For syndicated loans, we follow the procedure employed by Sufi (2007) to define the
nature of bank relationship. Indeed, we first use the variable LEAD-ARRANGER-CREDIT to
identify the lead arranger.6 If the information is not available then we use the banks identified with
“lead roles” in the variable LENDERS-ALL-LENDERS.7 Since our argument is centered on the
role of banks as monitors, we argue, in line with Bharat et al. (2011), that the leading banks in each
facility are those who play this monitoring role for syndicated loans.
We collect the following information about each facility: the identities of the financial
institutions with leading roles in the loan, whether the loan is syndicated, the total face value of
the loan, and, when available, the information about the share of each financial institution in the
loan. Our final sample consists of 381 IPO firms having a total of 850 loans reported in Dealscan.
6 "Lead Arranger Credit" takes value “Yes” or “No” for every bank participating in the syndicated loan.
7 Following Bharat et al. (2011), we identify the following roles: Lead Arranger, Arranger, Lead Manager, manager,
10
Based on the above information we construct the variable BANK capturing the number of bank
relationships as a dummy variable equal to 1 if the IPO firm has only one bank relation before
going public and zero if more than one bank are found to be facilities’ lead arrangers to the IPO
firm. During our sample period, the mergers and acquisitions market for financial institutions was
particularly active because of the repeal of the Glass-Steagall act. We control for acquisitions by
considering banks and their affiliated institutions as the same relationship for firms if the IPO date
is after the merger date. Our second proxy for the number of bank relationships is
NUMBER_BANKS defined as the actual number of bank relationships an IPO firm has at the IPO
date. We additionally control for whether the loan is syndicated or not as it can be argued that
syndicates are more prone to free riding problems in monitoring and hence exacerbate the negative
impact on IPO underpricing. For this purpose we construct a proxy SYND: a dummy variable equal
to one if at least one of the loans of the IPO firm was syndicated and 0 otherwise. Consistent with
our argument, we can expect that low efficient monitoring would be associated with syndicated
loans. Also, for each firm, we identify the names of lead underwriters and match them with the
names of the lending banks. We define a dummy variable DID equal to 1 if one of the lead
underwriter was also a relationship bank, and zero otherwise.
In order to test hypothesis 4, we define the following three proxies for bank relationships
strength:
1) AVERAGE_LOAN_VALUE: the sum of loan face values divided by the number of bank
relationships. The higher this measure, the more important are the links between relationship
banks and the IPO firm. This should be associated with more incentives for bank to
coordinate their effort to monitor the firm, leading to lower information asymmetry and
11
2) AVERAGE_NUMBER_LOANS: the total number of deals for each firm divided by the
number of bank relationships. Like for the AVERAGE_LOAN_VALUE, this should be
positively related to the strength of the relation between the IPO firm and its bank
relationships.
3) HERFINDAHL: For each loan, when the proportion lent by each bank is observable, the
Herfindahl index is equal to the sum of the squared values of these proportions. The variable
HERFINDAHL is equal to the average value of the Herfindahl indices for the different loans.
This measures the strength of the commitment of each bank with the IPO firm and may affect
the incentives of the different banks to monitor efficiently the firm. Note that this measure
needs information about the proportion lent by each bank, which is available for only 258
IPO firms in our sample.
Before becoming publicly traded, firms are less transparent and information about their bank
loans is not necessarily available on Dealscan. This may create several sampling biases we must
control for. First, because Dealscan does not necessarily report all loans in particular for private
firms, this may result in a misclassification of banks with multiple bank relations as single bank
relation. This bias would play against our hypothesis as it reduces the difference between single
and multiple bank relationships. Second, we find information about deals for only 23% of the
whole IPO sample in our study period (381 over 1661 IPO firms). Compared to the whole sample
(see Table 2), we can see that the average underpricing in our sample is 38.04% which is very
close to the 38.30% average underpricing in the original SDC sample we crossed with Dealscan.
12
than the average underpricing reported in Jay Ritter's website.8 We think that our subsample is not
distorted in this respect. In Table 1 we define all the variables that will be used in our analysis.
[Insert Table 1 here] 4. Results
4.1. Univariate results
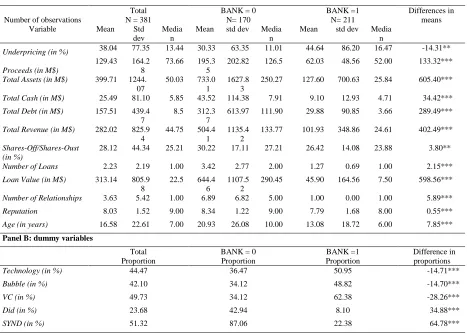
Table 2 reports the descriptive statistics of our sample of IPO firms and the differences between
IPO firms having a single bank relationships (BANK=1) and those with multiple bank relationships
(BANK =0). At first look, we observe a difference in the level of IPO underpricing between the
two groups: firms with multiple banks have a mean underpricing of 30.33% vs. 44.64% for firms
with one bank, and the difference is statistically significant at 5%. This observation is in
contradiction with our main hypothesis (H1). However, we note that firms with multiple bank
relationships are larger, in terms of asset value, with larger IPO proceeds and larger revenues. This
might explain some of the difference in underpricing since the IPO literature widely documents
that offer size and firm size do affect IPO underpricing. Consistently with the intuition, multiple
bank relationships firms exhibit larger debt than firms with one bank relationship and the
difference, like for size proxies, are all statistically significant at 1% level. Furthermore, firms with
single bank relationship tend to go public with less reputed underwriter and are on average
younger. Some of these observations are consistent with the banking literature about bank
relationships (Farinha and Santos (2002), Detragiache et al. (2000)). In terms of deals’
characteristics, the number of loans and the total value of loans for firms with multiple bank
relationships are significantly larger than for firms with single bank. For firms with multiple bank
8The average underpricing for the same period reported by Ritter is 35.86% as can be derived from information on
13
relationships, the average number of relations is 6.89 and more than 87% of loans are syndicated.
Overall, the univariate results suggest that there is fundamental differences between IPO firms
with a single bank relationship and those with multiple bank relationships which we will need to
take carefully into account in our analysis.
[Insert Table 2 here]
4.2.The determinants of the number of pre-IPO bank relationships
As discussed in the previous section, the descriptive statistics seems to suggest that firms with
a single lending relationship are fundamentally different from firms with multiple banks. Hence,
it seems relevant, as a first step in our analysis, to try and shed some light on what are the key
factors that affect the likelihood of having one rather than multiple bank relationships. This will
allow us to understand the determinants of the key variable in our analysis. We thus run a probit
model relating the likelihood for an IPO firm of having a single bank relationship to some of its
characteristics. Our analysis extends Gonzales and James (2007) who, on a sample of 673 IPO
firms between 1996 and 2000, investigate the determinants of the likelihood of having a pre-IPO
banking relationship. We run the following probit model:
𝐵𝐴𝑁𝐾𝑖,𝑡 = 𝛼0+ 𝛼𝑑𝑒𝑏𝑡𝐷𝑒𝑏𝑡 𝐶ℎ𝑎𝑟𝑎𝑐𝑡𝑒𝑟𝑠𝑖𝑡𝑖𝑐𝑠𝑖,𝑡+ 𝛼𝐹𝐼𝑅𝑀𝐹𝑖𝑟𝑚 𝐶ℎ𝑎𝑟𝑎𝑐𝑡𝑒𝑟𝑠𝑖𝑡𝑖𝑐𝑠𝑖,𝑡
+ 𝜀𝑖,𝑡
(1)
Debt Characteristics is a vector of variables including information about firm's loan contracts. We
consider leverage, the number of bank loans contracted by the firm and the total loan value. The
vector Firm characteristics includes size, age, cash, revenue, whether the firm is in the technology
sector, and whether it is financed by a VC. The results of the probit, reported in Table 3, are in line
14
having a single bank relationship. Furthermore, the size of the firm (measured by total assets), the
level of indebtedness (measured by the debt to assets ratio), and the ratio of total revenue to total
assets do not affect the likelihood for firms to be single bank relationship. This may be explained
by the fact that all these ratios do not necessarily reflect the size of the characteristics of the firm
at the time of deciding the structure of bank relationships. Also, the likelihood of a single bank
relationship appears to be independent of whether the company is a technology company or VC
backed. These findings are in line with Detriagiache et al. (2000) who find that the age of firms
and their ownership structure do not affect the likelihood of having single bank relationship.
However, firms with a larger ratio of cash to assets (which may be a proxy for the quality of the
IPO firm as a borrower) are more likely to have multiple bank relationship. Also, the total value
of loans and the number of loans affect significantly the likelihood of firms to be single bank
relationship. These results are consistent with Farinha and Santos (2002) who show that firms
switching from single to multiple banks are concerned by the hold-up costs related to single bank
relationship and to the willingness of banks to diversify their exposition to firm's risk when loan
values (and number) are larger.
[Insert Table 3 here] 4.3. Multivariate regression results
In this section, we examine the relationship between the structure of bank relationships and the
IPO underpricing for our sample of 381 IPOs in the US market between January 1998 and June
2008. To test our hypothesis H1, we consider the following regression:
𝑈𝑛𝑑𝑒𝑟𝑝𝑟𝑖𝑐𝑖𝑛𝑔𝑖,𝑡 = 𝛽0+ 𝛽1𝐵𝐴𝑁𝐾𝑖,𝑡+ 𝛽𝐹𝐼𝑅𝑀𝐹𝑖𝑟𝑚 𝐶ℎ𝑎𝑟𝑎𝑐𝑡𝑒𝑟𝑠𝑖𝑡𝑖𝑐𝑠𝑖,𝑡+
15
where Underpricing is the first day return,
O O
P P P )
( 1 with
1
P is the closing price on the first trading
day and P0is the offering price. Bank is our variable of interest as defined above. The firm characteristics are the following standard controls: Ln(TotalAssets) is a standard proxy for the size
of the company which is expected to be negatively correlated to the underpricing; Ln(1+Age)
measures the age of the firm as older companies have less ex-ante uncertainty and hence are less
underpriced (Loughran and Ritter (2004)). Following Schenone (2004), we also control for the
leverage and the amount of cash measured by the Ln(TotalDebt/TotalAssets) and
Ln(Cash/TotalAssets). Firms with more leverage and less cash tend to be less underpriced
consistent with the traditional argument that credit relationships certify the quality of the company.
The IPO Characteristics, is a vector containing the IPO proceeds (relative to the total assets) which
are expected to have a positive correlation with IPO underpricing (Beatty and Ritter, 1986), the
Bubble period as being characterized by unusually high level of underpricing, the reputation of the
underwriter and whether the firm is backed by a venture capitalist (VC). The results of our OLS
regression are reported in Table 4.
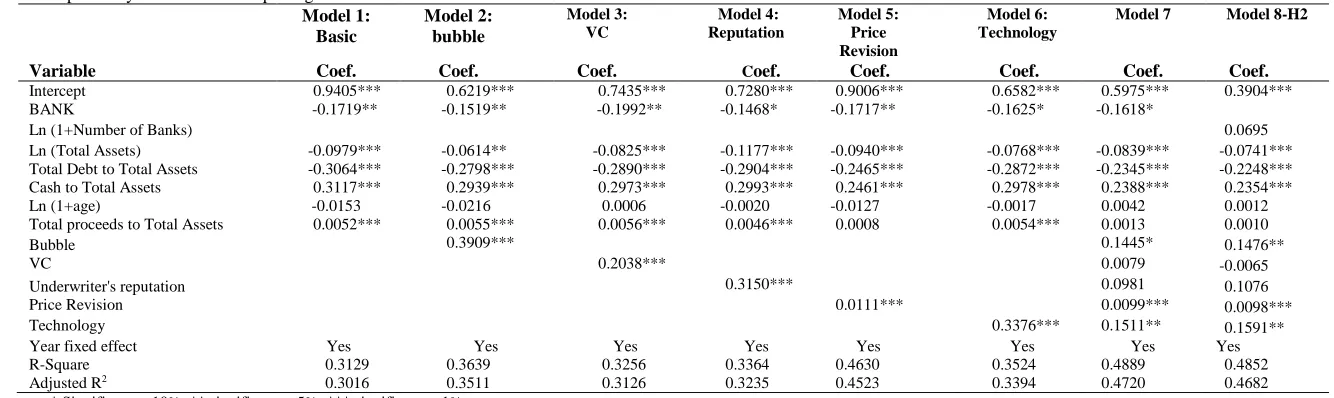
Model 1 (first column) represents our basic model. The results show that having one bank
relationship does significantly lower IPO underpricing: The coefficient on Bank is negative, and
statistically and economically significant. We also find that firms with higher Cash to Total Assets
ratios have significantly higher underpricing while more leveraged firms are less underpriced. As
expected, we find that smaller offerings are more underpriced than larger ones. In Model 2, we
control for the Internet bubble period and find that, as expected, IPOs exhibit higher underpricing
during this period. The coefficient of Bank is -0.1519, statistically significant. In model 3, we
include a dummy variable to control for whether the IPO is venture backed or not and find that
16
role associated to VC backing as documented in Megginson and Weiss (1991). However, like in
our case, Lee and Wahal (2004) find that VC backing is associated with higher underpricing
providing support to the grandstanding hypothesis according to which VCs tend to prematurely
rush their investee companies to an IPO in order to exit their investment.
In model 4, we include a dummy variable to control for whether the IPO is underwritten by a
prestigious underwriter or not and confirm that prestigious underwriter underprices more than
non-prestigious underwriter. Loughran and Ritter (2004) find a similar result and argue that
underwriters underprice IPOs strategically to have direct or indirect benefits from the higher
underpricing. In model 5, we include price revision measure to control for institutional investor’s
interest in the offering and find that the coefficient of the Price Revision is positive and statistically
significant. Thus the institutional interest in an IPO has a positive effect on underpricing. This
result is consistent with the "partial adjustment phenomenon" documented by Hanley (1993). In
model 6, we further control for technology firms and find that Technology IPO and more
underpriced than non-technology IPOs. This result corroborates previous finding. In model 7, we
include all firm and IPO characteristics, and confirm that the coefficient on Bank is negative and
statistically significant (βBank = - 0.1618). In other words, the underpricing for firms with one
banking relationship is about 16% lower than the underpricing of firms with multiple banking
relationships.
In model 8, we replace the dummy Bank with the actual number of bank relationships, for a
given IPO firm, log(1+Banks),9 in order to check whether the negative impact on the underpricing
is increasing in the number of banking relationships (H2). The results show that the coefficient of
our variable of interest while of the expected sign is not statistically significant indicating a discrete
17
relationship between the number of banking relationships and IPO underpricing. Results are robust
to testing for the non-linearity of the number of banking relationship by using a square term rather
than the logarithmic transformation. Generally, our results suggest that the crucial factor is having
a single banking relationship. This result is consistent with the monitoring loss of efficiency
associated with multiple banking. Indeed, as suggested by Carletti et al. (2007), the free riding
problem and the coordination problems increase with the number of bank relationships. However,
the marginal loss of monitoring efficiency is decreasing with the number of bank relationships.10
Our empirical results suggest that underpricing is affected only by the largest marginal loss of
efficiency captured by the difference between single and multiple bank relationships.
[Insert Table 4 here] 4.5. The strength of the lending relationship
From the above analysis, we find that IPO firms with a single bank relationship are less
underpriced than firms with multiple bank relationships. We argue that this occurs because
multiple banks are less efficient/effective in monitoring firms, which results in a weaker
certification role of multiple lenders that ultimately translates in more underpricing.
In the previous analysis our variable of interest does not distinguish whether the lending banks
are part of a syndicate or not. Intuitively, the likelihood of free riding in monitoring is exacerbated
in bank syndicates because, as suggested by Holmstrom and Tirole (1997), loans' leaders in
syndicated loans may provide sub-optimal monitoring effort because they have fewer stakes in the
loan. This is what Bharat et al. (2011) call "syndicate moral hazard". In order to test whether indeed
this loss of efficiency depends on whether loans are syndicated, we estimate Equation (2) by
10 In other words, the monitoring loss of efficiency is an increasing concave function of the number of bank
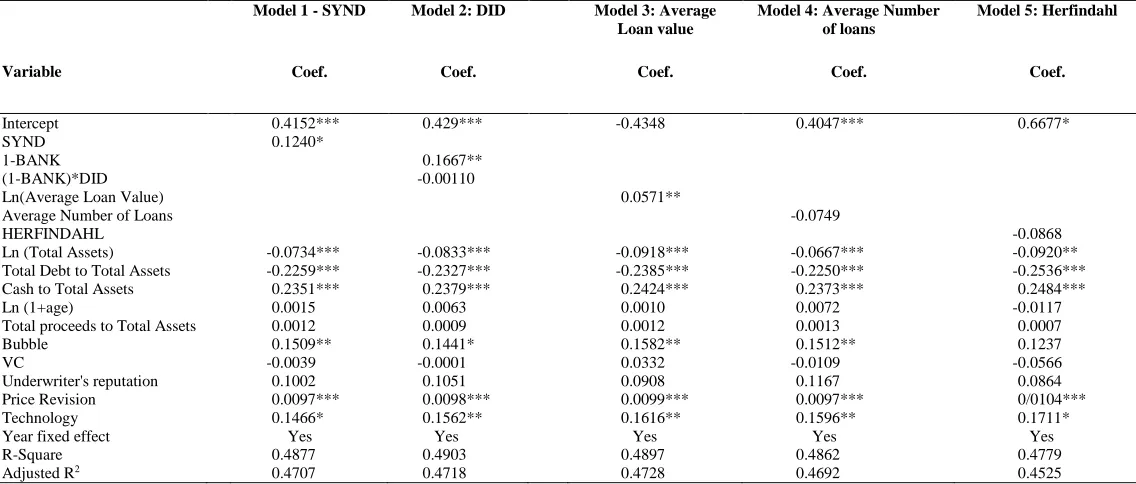
18
replacing the variable BANK by the dummy variable SYND, which takes value 1if the firm has at
least one syndicated loan. The results, reported in Colum 1 in Table 5, show that our variable of
interest SYND has a positive and statistically significant coefficient. This is consistent with the
syndicate moral hazard issue reported in Bharat et al. (2011).
As documented by Schenone (2004), IPO underpricing seems to be lower for firms that go
public with a bank lending relationship as an IPO underwriter. We are interested to see whether
using a relationship bank as IPO underwriter can partially mitigate the negative impact of having
multiple lending relationships. For this purpose we test the following equation:
𝑈𝑛𝑑𝑒𝑟𝑝𝑟𝑖𝑐𝑖𝑛𝑔𝑖,𝑡 = 𝛽0+ 𝛽1(1 − 𝐵𝐴𝑁𝐾𝑖,𝑡) + 𝛽2(1 − 𝐵𝐴𝑁𝐾𝑖,𝑡) ∗ 𝐷𝐼𝐷
+𝛽𝐹𝐼𝑅𝑀𝐹𝑖𝑟𝑚 𝐶ℎ𝑎𝑟𝑎𝑐𝑡𝑒𝑟𝑠𝑖𝑡𝑖𝑐𝑠𝑖,𝑡+ 𝛽𝐼𝑃𝑂𝐼𝑃𝑂 𝐶ℎ𝑎𝑟𝑎𝑐𝑡𝑒𝑟𝑖𝑠𝑡𝑖𝑐𝑠𝑖,𝑡+ 𝜀𝑖,𝑡 (3)
The variable DID is a dummy that takes value 1 if the firm has used one of its relationship bank
as underwriter in the IPO and 0 otherwise. The descriptive statistics reported in Table 2 show that
approximately 42% of firms with multiple bank relationships do use one of their lending banks as
acting underwriters, whereas this is far less common among firms with a single bank relationship
(only 8%). To capture the moderation effect of such a decision we interact the dummy DID with
the variable (1-BANK). We choose to look at (1-BANK) as the effect of going public with a
relationship bank is likely to be more beneficial, if at all, for firms with multiple banking
relationships. Results are reported in Table 5 (Column 2). The variable (1-Bank) has as expected
a positive coefficient estimate, which is also strongly statistically significant whereas the
19
Hence, we conclude that firms do not benefit from using their relationship banks as IPO
underwriter contrary to what documented by Schenone (2004).11
We turn now to H 4 that introduces other measures of bank relationship strength. We consider
three different measures of bank relationship strength. For each IPO firm, we compute the average
number of bank loans per bank relationship (AVERAGE_NUMBER_LOANS), the average loan
value per bank (AVERAGE_LOAN_VALUE) and the average concentration of the bank
participations in the different loans (HERFINDAHL).
The first two measures capture the extent to which a bank is involved in the firm’s financing.
We conjecture that a higher average number of bank loans per bank or/and a higher average loan
value per bank would increase the incentive for a bank to monitor the firm thereby reducing the
negative spillover of having multiple banks. In the regression, we present the results using the
natural logarithm of the average loan value. The Herfindhal Index measures whether firm loans
are more or less concentrated among few banks. The index would be equal to 1 if loans are highly
concentrated (i.e. are contracted by a single bank) and lower than one if they are dispersed among
many different lenders. Hence, it is a good measure of the strength of the banking relationship. It
is important here to note that we are able to calculate the H-index for only 258 firms in our sample.
The results of this last test are reported in columns 3-5 of Table 5. We note that the average number
of loans as well as the H-index have both the expected sign, negative, but appear to be statistically
11 Schenone (2004) distinguishes between lending bank relationships that could take firms public and those that could
20
insignificant. These results suggest that, at least from outside investors' perspective, what is
important is mainly the structure of lending relationships (captured in our model by the variable
BANK) rather than the strength of these relationships as measured by the average number of loans
per bank or the concentration of loans among banks.
However, contrary to our intuition, Table 5 (Column 3) reports that the average loan value has
a strongly statistically significant positive coefficient estimate. A possible explanation for this
might be the high correlation existing between the average loan value and total assets (Pearson
correlation equal to 0.7180) which suggests that the average loan value is not an adequate proxy
for the strength of the lending relationship.12
[Insert Table 5 here] 4.6 Robustness Tests: The Endogeneity of the Bank Dummy
Results from Table 4 suggest that one bank relationship has a negative and significant effect on
underpricing. This negative relation could be explained by the fact that banking relationships could
indeed contain private information about underpricing not reflected in the other explanatory
variables considered in our model. However, this observed negative relation could also be driven
by the endogeneity of our Bank variable. Results from Tables 2 and 3 show that firms with multiple
banking relationships are larger, have more debt, and less likely to be VC backed than firms with
one bank relationship. These factors also affect the IPO underpricing. Thus, the effect of banking
relationships on underpricing could reflect the endogenous nature of our variable Bank rather than
any private information about underpricing it might contain. In order to address this problem we
12It should be noticed that this result might also be affected by whether the loan is secured or not. Everything else
21
use the same Two-Stage Estimate approach designed and implemented by Aggarwal et al (2002).13
In the first stage, Bank is regressed on a vector of regressors that include also but not only those
used in the OLS estimate. As an instrument we use the number of deals for IPO firms. From Table
3, we know that the number of loans strongly affect the likelihood of having one rather than many
banking relationships. Furthermore, from the results presented in Table 5, the average number of
deals is not correlated with underpricing. We run a similar regression to Model 4 in Table 5 by
using the natural logarithm of the number of deals before the IPO and the results show that this
variable does not significantly affect underpricing. We argue that the number of deals is not
necessarily observable by investors during the IPO period since some of these deals do not
necessarily appear in the IPO firm prospectus since we gather data up to five years before the IPO
date. This suggests that the number of deals is a good candidate to be the instrument in our
regression. In the first equation we run Equation (1) by including ln(1+number of deals) as an
explanatory variable in order to avoid the count data bias.14 In the second stage, the fitted Bank
variable (from stage 1) is entered into Eq (2) instead of the Bank variable alongside with the term
(Bank –Fitted Bank) which captures the exogenous part of the variable Bank. We expect that after
controlling for the endogenous portion of the variable Bank, the exogenous portion measured by
the term (Bank –Fitted Bank) would still have a negative and statistically significant coefficient
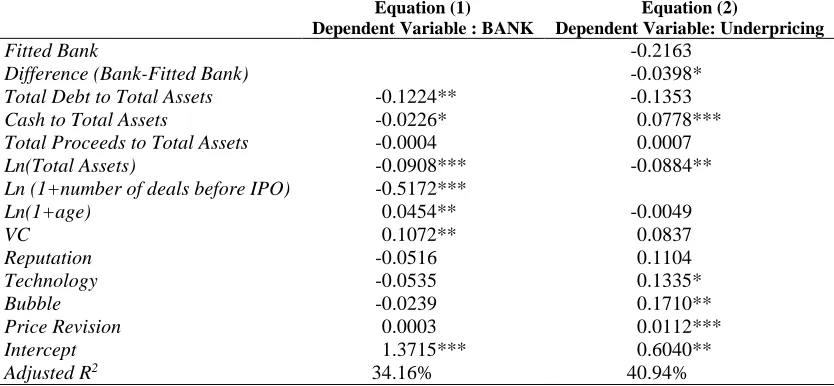
estimate.15 Table 6 reports the 2SLS estimates. The first column reports the first stage estimates of
the Bank equation (1). We find that the coefficients of Total Debt to Total Assets, Cash to Total
13 Their endogeneity problem is similar to ours and the technique considered by Aggarwal et al. (2002) is able to
disentangle the endogenous portion of our variable of interest and hence to test whether the exogenous portion still has an impact on the dependent variable.
14 We find qualitatively similar results by using the number of loans as an explanatory variable. Results are not reported
here but are available from the authors upon request.
15 Note that as highlighted by Aggarwal et al (2002) this additional term is an error term derived from the first stage
22
Assets, Ln(Total Assets), and Ln(1+number of deals before IPO) are negative and significant,
while the coefficient of Ln(1+age) and VC are positive and significant. The second column reports
the second stage estimates of the Underpricing equation. We find that the coefficient of Fitted
Bank is negative but not significant, suggesting that the endogenous portion of the bank
relationship variable is not related to underpricing. Further the coefficient of the variable (Bank –
Fitted Bank) is negative and significant, which confirms that Bank has indeed private information
about Underpricing not reflected in other variables.
5. Conclusions
This paper investigates the impact of the number of banking relationships on IPO underpricing.
While the IPO literature widely document the beneficial role of bank lending and more generally
of credit relationships on reducing ex-ante uncertainty for IPO firms (Slovin and Young, 1990;
James and Wier, 1990, Schenone, 2004), no paper has yet investigated whether this beneficial
impact is affected and, if so to what extent, by the exact number of banking relationships. This
paper is an attempt to fill this gap.
Our results suggest that IPO firms that go public with more than one banking relationships
exhibit larger underpricing than those that go public with more than one banking relationships and
that this remains true even after correcting for the potential endogeneity of our variable of interest.
We interpret our results by linking them to the literature on multiple banking. Specifically, our
findings provide some support to the theoretical arguments that show that multiple banking suffers
from internal agency conflicts that might lead to sub-optimal levels of monitoring (Carletti et al.,
2007; Khalil et al. 2007). This in turn would result in a weaker certification role of multiple
banking relationships as opposite to single banking relationships and hence in a larger underpricing
23
underpricing is binary and does not increase with the number of bank relationships. Thus, the key
factor seems to be having one banking relationships. Finally, we find that the strength of the
24
References
Aggarwal, R., N.R. Prabhala, and M. Puri, 2002, "Institutional Allocation in Initial Public Offerings:
Empirical Evidence", Journal of Finance 57, 1421-1442.
Benzoni, L. and C. Schenone, 2010, "Conflict of Interest and Certification in US IPO Market", Journal
of Financial Intermediation 19, 235-254.
Beatty, R., and J. Ritter, 1986, "Investment Banking, Reputation, and the Underpricing of Initial Public
Offerings." Journal of Financial Economics 15, 213-232.
Bharath, S. T., S. Dahiya, A. Saunders, and A. Srinivasan, 2011, "Lending relationships and loan contract
terms", The Review of Financial Studies 24, 1142–1203.
Carletti, E., V. Cerasi, and S. Daltung, 2007, "Multiple-Bank Lending: Diversification and Free-Riding
in Monitoring", Journal of Financial Intermediation 16, 425-451
Chahine, S., J. D. Arthurs, I. Filatotchev, and R. E. Hoskisson, 2012, "The Effects of Venture Capital
Syndicate Diversity on Earnings Management and Performance of IPOs in the US and UK: An
Institutional Perspective", Journal of Corporate Finance 18, 179-192.
Degryse, H., M. Kim and S. Ongena, 2009, "Microeconometrics of Banking", Oxford University press.
Degryse, H. and S. Ongena, 2001, "Bank Relationship and Firm Performances", Financial Management
30, 9-34.
Detragiache, E., P. Garella and L. Guiso, 2000, "Multiple vs Single banking Relationships: Theory and
Evidence", Journal of Finance 55, 1133-1161
Diamond, D., 1984, "Financial Intermediation and Delegated Monitoring", Review of Economic Studies
51, 393–414.
Falconieri, S., I. Filatotchev and M. Tastan, 2013, "Does Venture Capital Syndicate Size Matter?",
Working paper.
Farinha, L. A., and J. A. C. Santos, 2002, “Switching from Single to Multiple Bank Lending
Relationships: Determinants and Implications.” Journal of Financial Intermediation 11, 124–151.
Gonzalez, L. and James, C. 2007, "Banks and bubbles: How good are bankers at spotting winners?", Journal
of Financial Economics 86(1), 40-70.
Gopalan, R., G. Udell and V. Yerramili, 2011, "Why do firms form new banking relationships?", Journal
of Financial and Quantitative Analysis 46 (5), 1335-1365.
Guiso, L. and R. Minetti (2010) "The Structure of Multiple Credit Relationships: Evidence from US
25
Hanley, K., 1993, "The Underpricing of Initial Public Offerings and the Partial Adjustment Phenomenon",
Journal of Financial Economics 34, 231-250.
Holmstrom, B. and J. Tirole, 1997, "Financial Intermediation, Loanable Funds, and the Real Sector",
Quarterly Journal of Economics 112, 663-691.
James, C. and P. Wier, 1990, "Borrowing Relationships, Intermediation and the Cost of Issuing Public
Securities", Journal of Financial Economics 28, 149-171.
Khalil, F., D. Martimort and B. Parigi, 2007, "Monitoring a Common Agent: Implications for Financial
Contracting", Journal of Economic Theory 135, 35-67.
Lee, P.M., and S. Wahal, 2004, "Grandstanding, Certification, and the Underpricing of Venture Capital
Backed IPOs", Journal of Financial Economics 73, 375-407.
Ljungqvist, A. P., 2007, "IPO underpricing", in B.E. Eckbo, ed. Handbook of Corporate Finance:
Empirical Corporate Finance (Elsevier, Amsterdam).
Loughran, T., and J.R. Ritter, 2003, "Why Has IPO Underpricing Increased Over Time?", Financial
Management 33(3), 5-37.
Megginson, W. L., and K. H. Weiss, 1991, “Venture Capitalist Certification in Initial Public Offerings”,
Journal of Finance 46, 879-903.
Ongena, S. and D. C. Smith, 2000, "What Determines The Number of Bank Relationships? Cross-Country
Evidence", Journal of Financial Intermediation 9, 26-56.
Rajan, R., 1992, "Insiders and Outsiders: The Choice between Informed and Arm’s Length Debt", Journal
of Finance 47, 1367-1400
Ritter, J.R., 1984, "The `hot issue' market of 1980." Journal of Business 57, 215-240.
Roberts, M. and Sufi, A., 2009, "Renegotiation of financial contracts: Evidence from private credit
agreements", Journal of Financial Economics 93 (2), 159-184.
Schenone, C., 2004, "The Effect of Banking Relationships on the Firm's IPO Underpricing", Journal of
Finance 59, 2903-2958.
Sharpe, S, 1990, "Asymmetric information, bank lending and implicit contracts: A stylized model of
customer relationships", Journal of Finance 45, 1069–1087.
Slovin, M., and J. E. Young, 1990, "Bank lending and initial public offerings", Journal of Banking &
Finance 14, 729-740.
Sufi, A., 2007, "Information Asymmetry and Financing Arrangements: Evidence from Syndicated
26
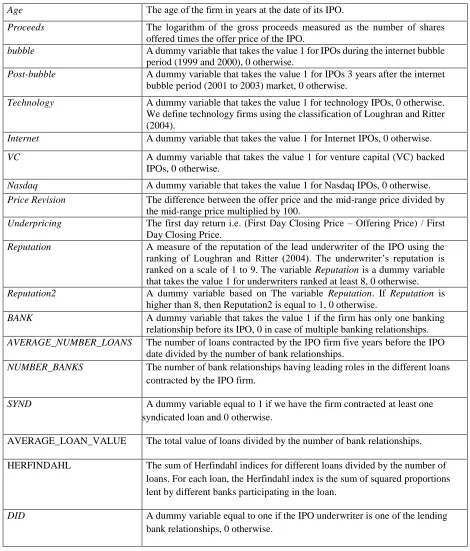
Table 1: Definition of variables
Age The age of the firm in years at the date of its IPO.
Proceeds The logarithm of the gross proceeds measured as the number of shares offered times the offer price of the IPO.
bubble A dummy variable that takes the value 1 for IPOs during the internet bubble period (1999 and 2000), 0 otherwise.
Post-bubble A dummy variable that takes the value 1 for IPOs 3 years after the internet bubble period (2001 to 2003) market, 0 otherwise.
Technology A dummy variable that takes the value 1 for technology IPOs, 0 otherwise. We define technology firms using the classification of Loughran and Ritter (2004).
Internet A dummy variable that takes the value 1 for Internet IPOs, 0 otherwise.
VC A dummy variable that takes the value 1 for venture capital (VC) backed
IPOs, 0 otherwise.
Nasdaq A dummy variable that takes the value 1 for Nasdaq IPOs, 0 otherwise.
Price Revision The difference between the offer price and the mid-range price divided by the mid-range price multiplied by 100.
Underpricing The first day return i.e. (First Day Closing Price – Offering Price) / First Day Closing Price.
Reputation A measure of the reputation of the lead underwriter of the IPO using the ranking of Loughran and Ritter (2004). The underwriter’s reputation is ranked on a scale of 1 to 9. The variable Reputation is a dummy variable that takes the value 1 for underwriters ranked at least 8, 0 otherwise. Reputation2 A dummy variable based on The variable Reputation. If Reputation is
higher than 8, then Reputation2 is equal to 1, 0 otherwise.
BANK A dummy variable that takes the value 1 if the firm has only one banking
relationship before its IPO, 0 in case of multiple banking relationships. AVERAGE_NUMBER_LOANS The number of loans contracted by the IPO firm five years before the IPO
date divided by the number of bank relationships.
NUMBER_BANKS The number of bank relationships having leading roles in the different loans contracted by the IPO firm.
SYND A dummy variable equal to 1 if we have the firm contracted at least one syndicated loan and 0 otherwise.
AVERAGE_LOAN_VALUE The total value of loans divided by the number of bank relationships.
HERFINDAHL The sum of Herfindahl indices for different loans divided by the number of loans. For each loan, the Herfindahl index is the sum of squared proportions lent by different banks participating in the loan.
DID A dummy variable equal to one if the IPO underwriter is one of the lending
27
Table 2: Descriptive Statistics
This table reports the descriptive statistics for a sample of 381 IPOs in the US market between January 1998 and June 2008. Our sample does not include depository shares, spin-offs, real estate investment trusts (REITs), reverse leveraged buyouts, unit offers, banks, savings and loans, closed-end funds, IPOs with offer prices less than five dollars and IPOs that have missing observations for any of the listed variables. We report the values for the whole sample and for the two subsamples of IPOs
with multiple bank relationships (BANK = 0) and IPOs with a single bank relationship (BANK = 1). Underpricing is defined
as the percentage first-day return from the offer price to the first-day closing price. Proceeds denotes the firm i's offering size
(in millions of dollars) defined as the total number of shares issued times the offering price. Shares-Off/Shares-Oust is the
ratio of shares offered in the IPO over the total number of outstanding shares. Number of Loans, Loan Value and the number
of relationships are defined as the number of loans, the total value of these loans and the number of banks with leading roles
in the loans contracted by the IPO firm up to five years before its IPO date. Reputation is the Loughran and Ritter (2004)
measure of underwriter's reputation and takes values between 1 and 9. Age is the number of years since the firm’s founding
date as of the IPO. Technology is a dummy variable that takes a value of one (zero otherwise) if the firm is in the technology
business. Bubble is dummy equal to one (zero otherwise) if the IPO occurred during 1999-2000.VC is a dummy variable that
indicates whether the firm is VC backed or not. Did is dummy variable equal to 1 if the IPO underwriter is a bank relationship,
and 0 otherwise. SYND is a dummy variable equal to 1 if at least one of the loans contracted by the IPO firm is syndicated.
* Significant at 10%; ** significant at 5%; *** significant at 1%.
Panel A: Continuous variables
Number of observations
Total N = 381
BANK = 0 N= 170
BANK =1 N= 211
Differences in means Variable Mean Std
dev
Media n
Mean std dev Media n
Mean std dev Media n
Underpricing (in %) 38.04 77.35 13.44 30.33 63.35 11.01 44.64 86.20 16.47 -14.31**
Proceeds (in M$)
129.43 164.2 8
73.66 195.3 5
202.82 126.5 62.03 48.56 52.00 133.32***
Total Assets (in M$) 399.71 1244.
07
50.03 733.0 1
1627.8 3
250.27 127.60 700.63 25.84 605.40***
Total Cash (in M$) 25.49 81.10 5.85 43.52 114.38 7.91 9.10 12.93 4.71 34.42***
Total Debt (in M$) 157.51 439.4
7
8.5 312.3 7
613.97 111.90 29.88 90.85 3.66 289.49***
Total Revenue (in M$) 282.02 825.9 4
44.75 504.4 1
1135.4 2
133.77 101.93 348.86 24.61 402.49***
Shares-Off/Shares-Oust (in %)
28.12 44.34 25.21 30.22 17.11 27.21 26.42 14.08 23.88 3.80**
Number of Loans 2.23 2.19 1.00 3.42 2.77 2.00 1.27 0.69 1.00 2.15***
Loan Value (in M$) 313.14 805.9
8
22.5 644.4 6
1107.5 2
290.45 45.90 164.56 7.50 598.56***
Number of Relationships 3.63 5.42 1.00 6.89 6.82 5.00 1.00 0.00 1.00 5.89***
Reputation 8.03 1.52 9.00 8.34 1.22 9.00 7.79 1.68 8.00 0.55***
Age (in years) 16.58 22.61 7.00 20.93 26.08 10.00 13.08 18.72 6.00 7.85***
Panel B: dummy variables
Total Proportion
BANK = 0 Proportion
BANK =1 Proportion
Difference in proportions
Technology (in %) 44.47 36.47 50.95 -14.71***
Bubble (in %) 42.10 34.12 48.82 -14.70***
VC (in %) 49.73 34.12 62.38 -28.26***
Did (in %) 23.68 42.94 8.10 34.88***
28
TABLE 3: The likelihood for IPO firms to be single bank relationship
This table reports the results of a probit model for the likelihood for firms to be single bank relationship firm. The sample contains 381 IPOs in the US market between January 1998 and June 2008. Our sample does not include depository shares, spin-offs, real estate investment trusts (REITs), reverse leveraged buyouts, unit offers, banks, savings and loans, closed-end funds, IPOs with offer prices less than five dollars and IPOs that have missing observations for any of the listed variables. The dependent variable is BANK, equal to 1 if the IPO firm has only one bank relationship up to five years before its IPO date, 0 otherwise. Log is defined as the natural logarithm. DebtToAssets, CashToAssets and RevenueToAssets are ratios using data about the IPO firm the year preceding the IPO year. Assets is the total value of assets the last year before the IPO. Number of Loans and TotalLoan Value are defined as the number of loans and the total value of these loans contracted by the IPO firm up to five years before its IPO date. Age is the number of years since the firm’s founding date as of the IPO. Technology is a dummy variable that takes a value of one (zero otherwise) if the firm is in the technology business. VC is a dummy variable that indicates whether the firm is VC backed or not.
Variable Coefficient. Std. Err. p-value
Log(DebtToAssets) -0.0027 0.0598 0.964
Log(CashToAssets) -0.1131 0.0448 0.012
Log(Assets) -0.1096 0.0802 0.172
Log(RevenueToAssets) -0.0312 0.0345 0.366
Log(1+Number of Loans) -1.8124 0.2804 0.000
Log (Total loan Value) -0.3005 0.0686 0.000
VC 0.0736 0.2042 0.718
Log(1+Age) 0.1151 0.0854 0.178
Technology -0.0895 0.1910 0.639
Cons 7.03871 1.0960 0.000
Log Likelihood -151.98604
LR Chi2(9) 217.41
Pseudo R-Square 41.70%
29
Table 4: OLS regression results
This table examines the relationship between the number of bank relationships and the IPO underpricing for our sample of 381 IPOs in the US market between January 1998 and June 2008. Our sample does not include depository shares, spin-offs, real estate investment trusts (REITs), reverse leveraged buyouts, unit offers, banks, savings and loans, closed-end funds, IPOs with offer prices less than five dollars and IPOs that have missing observations for any of the listed variables. We only consider loans of
$100,000 and above. Our candidate variable is BANK which is a dummy variable that takes the value 1 if the firm has one banking relationship before its IPO, 0 otherwise
(in case of multiple banking relationships). The control variables used are: Ln(Total Assets) which denotes the log of firm i's total assets the year before the IPO date (in
millions of dollars); Total Debt to Total Assets is the debt-to-assets ratio (at the IPO year); Cash to Total Assets is the cash-to-assets ratio (at the IPO year); Ln(1+age) is the
natural log of 1 plus the years since the firm’s founding date as of the IPO; Total Proceeds to Total Assets total proceeds-to-total assets ratio (at the IPO year). The Bubble
dummy takes a value of one (zero otherwise) if the IPO occurred during 1999-2000. VC is a dummy variable that indicates whether the firm is VC backed or not. Reputation
dummy takes a value of one if the lead underwriter has a ranking according to Carter and Manaster (1990) of 8 or more, and zero otherwise. Price Revision = [(Offer Price
− Mean Filing Price) /Mean Filing Price]; Technology is a dummy variable that takes a value of one (zero otherwise) if the firm is in the technology business. Model 1
represents our basic model. In model 2, we include the bubble variable to our basic model. In model 3, we add the VC variable to our basic model. In model 4, we add underwriter’s reputation variable to our basic model. In model 5, we add Price Revision measure to our basic model. In model 6, we add Technology variable to our basic model. In model 7, we include all our control variables to our basic model. Model 8 tests our Hypothesis 2 by including the logarithm of the number of banks as an explanatory variable instead of the BANK variable. Finally, Model 9 tests the non linearity relation by including the squared value of Ln (1+Number of Banks) as an explanatory variable of underpricing.
Model 1: Basic Model 2: bubble Model 3: VC Model 4: Reputation Model 5: Price Revision Model 6: Technology
Model 7 Model 8-H2
Variable Coef. Coef. Coef. Coef. Coef. Coef. Coef. Coef.
Intercept 0.9405*** 0.6219*** 0.7435*** 0.7280*** 0.9006*** 0.6582*** 0.5975*** 0.3904***
BANK -0.1719** -0.1519** -0.1992** -0.1468* -0.1717** -0.1625* -0.1618*
Ln (1+Number of Banks) 0.0695
Ln (Total Assets) -0.0979*** -0.0614** -0.0825*** -0.1177*** -0.0940*** -0.0768*** -0.0839*** -0.0741*** Total Debt to Total Assets -0.3064*** -0.2798*** -0.2890*** -0.2904*** -0.2465*** -0.2872*** -0.2345*** -0.2248***
Cash to Total Assets 0.3117*** 0.2939*** 0.2973*** 0.2993*** 0.2461*** 0.2978*** 0.2388*** 0.2354***
Ln (1+age) -0.0153 -0.0216 0.0006 -0.0020 -0.0127 -0.0017 0.0042 0.0012
Total proceeds to Total Assets 0.0052*** 0.0055*** 0.0056*** 0.0046*** 0.0008 0.0054*** 0.0013 0.0010
Bubble 0.3909*** 0.1445* 0.1476**
VC 0.2038*** 0.0079 -0.0065
Underwriter's reputation 0.3150*** 0.0981 0.1076
Price Revision 0.0111*** 0.0099*** 0.0098***
Technology 0.3376*** 0.1511** 0.1591**
Year fixed effect Yes Yes Yes Yes Yes Yes Yes Yes
R-Square 0.3129 0.3639 0.3256 0.3364 0.4630 0.3524 0.4889 0.4852
Adjusted R2 0.3016 0.3511 0.3126 0.3235 0.4523 0.3394 0.4720 0.4682
30
Table 5: The impact of different measures of bank relationship strength on IPO underpricing
This table examines the relationship between different measures of bank relationships strength and the IPO underpricing for our sample of 381 IPOs in the US
market between January 1998 and June 2008. We only consider loans of $100,000 and above. The control variables used are: Ln(Total Assets) which denotes
the log of firm i's total assets the year before the IPO date (in millions of dollars); Total Debt to Total Assets is the debt-to-assets ratio (at the IPO year); Cash to
Total Assets is the cash-to-assets ratio (at the IPO year); Ln(1+age) is the natural log of 1 plus the years since the firm’s founding date as of the IPO; Total Proceeds to Total Assets total proceeds-to-total assets ratio (at the IPO year). The Bubble dummy takes a value of one (zero otherwise) if the IPO occurred during
1999-2000. VC is a dummy variable that indicates whether the firm is VC backed or not. Reputation dummy takes a value of one if the lead underwriter has a
ranking according to Carter and Manaster (1990) of 8 or more, and zero otherwise. Price Revision = [(Offer Price − Mean Filing Price) /Mean Filing Price];
Technology is a dummy variable that takes a value of one (zero otherwise) if the firm is in the technology business. Model 1 tests the impact of syndicated loans on underpricing by using the variable SYND that is equal to 1 if at least one of the loans is syndicated and 0 otherwise. Model 2 tests the marginal impact on underpricing for firms going public with one of lending relationships. Did is equal to 1 if the firm's lead IPO underwriter is a bank relationship. We consider the variable (1-BANK) that is equal to 1 for firms with multiple banks and 0 otherwise. . Models 3, 4 and 5 test the impact on underpricing of other measures of bank relationship strength: Average Loan Value, Average number of Loans and Herfindahl index, respectively. We use the natural logarithm of Average Loan Value (in millions) which is the total value of loans divided by the number of relationships. Average number of Loans is the total number of Loans divided by the number of relationships. HERFINDAHL is the average Herfindahl index for the different loans. Data needed to calculate Herfindahl index is available only for only 258 firms in our sample.
Model 1 - SYND Model 2: DID Model 3: Average
Loan value
Model 4: Average Number of loans
Model 5: Herfindahl
Variable Coef. Coef. Coef. Coef. Coef.
Intercept 0.4152*** 0.429*** -0.4348 0.4047*** 0.6677*
SYND 0.1240*
1-BANK (1-BANK)*DID
0.1667** -0.00110
Ln(Average Loan Value) 0.0571**
Average Number of Loans -0.0749
HERFINDAHL -0.0868
Ln (Total Assets) -0.0734*** -0.0833*** -0.0918*** -0.0667*** -0.0920**
Total Debt to Total Assets -0.2259*** -0.2327*** -0.2385*** -0.2250*** -0.2536***
Cash to Total Assets 0.2351*** 0.2379*** 0.2424*** 0.2373*** 0.2484***
Ln (1+age) 0.0015 0.0063 0.0010 0.0072 -0.0117
Total proceeds to Total Assets 0.0012 0.0009 0.0012 0.0013 0.0007
Bubble 0.1509** 0.1441* 0.1582** 0.1512** 0.1237
VC -0.0039 -0.0001 0.0332 -0.0109 -0.0566
Underwriter's reputation 0.1002 0.1051 0.0908 0.1167 0.0864
Price Revision 0.0097*** 0.0098*** 0.0099*** 0.0097*** 0/0104***
Technology 0.1466* 0.1562** 0.1616** 0.1596** 0.1711*
Year fixed effect Yes Yes Yes Yes Yes
R-Square 0.4877 0.4903 0.4897 0.4862 0.4779
Adjusted R2 0.4707 0.4718 0.4728 0.4692 0.4525