Quantifying the Specificity of Near-Duplicate
Image Classification Functions
Richard Connor
1and Franco Alberto Cardillo
2 1Department of Computer and Information Sciences,University of Strathclyde, Glasgow, G1 1XH, Scotland
2Istituto di Scienza e Tecnologie dell’Informazione,
Consiglio Nazionale delle Ricerche, Pisa, Italy [email protected], [email protected]
Keywords: near-duplicate image detection, benchmark, image similarity function, specificity, forensic image detection
Abstract: There are many published methods for detecting similar and near-duplicate images. Here, we consider their use in the context of unsupervised duplicate detection, where the task is to find a (relatively small) near-duplicate intersection of two large candidate sets. Such scenarios are of particular importance in forensic near-duplicate detection. The essential properties of a such a function are: performance, sensitivity, and specificity. We show that, as collection sizes increase, then specificity becomes the most important of these, as without very high specificity huge numbers of false positive matches will be identified. This makes even very fast, highly sensitive methods completely useless. Until now, to our knowledge, no attempt has been made to measure the specificity of near-duplicate finders, or even to compare them with each other. Recently, a benchmark set of near-duplicate images has been established which allows such assessment by giving a near-duplicate ground truth over a large general image collection. Using this we establish a methodology for calculating specificity. A number of the most likely candidate functions are compared with each other and accurate measurement of sensitivity vs. specificity are given. We believe these are the first such figures be to calculated for any such function.
1 INTRODUCTION
In forensic image detection, it is commonly re-quired to determine if one large image collection con-tains images for which near-duplicates exist within another large collection. For example, the UK Na-tional Crime Agency has a collection of approxi-mately 107known child abuse images. A media
de-vice seized from a suspect may contain 106images,
but perhaps only 103of these would be of child abuse
and thus a subject for prosecution. A knowledgeable suspect will have performed minor visual editing of these images, making them detectable only by near-duplicate finding functions.
Finding images similar to one other, from within a huge collection, is nowadays a (relatively) solved problem, and has been shown to scale to up to col-lections of well over 1010 images. However almost
all such results are set in a human-guided search sce-nario, where a single image is presented to the system and a human is available to pick the best results from those returned. Here we examine quite a different
sce-nario, where two moderately large collections are the input, and the desired output is the set of images of which near-duplicates exist across the two collections. This causes new problems, due to the inherent squar-ing: if both collections contain a relatively modest 106
images, then there are 1012 pairs to consider, rather
more comparisons than required to compare a single image against Google’s indexed image collection.
The performance issues can be handled by various means, including using the obvious parallelisation in-herent in the problem. In this article we concentrate on a more subtle problem, that of the precision, or specificity, of the classification function. As there are a really huge number of pairs of images to consider, the specificity must be incredibly high to avoid very large numbers of false positives. For example, speci-ficity of 1 1
106 would, in most contexts, give excel-lent precision; but set in this example context would give 106false positives, impossible for any human to
Finding near-duplicate images in this context re-quires aclassificationfunction; that is, a boolean sim-ilarity functions which allows the detection of the near-duplicate intersection: from collectionsXandY, the near-duplicate intersection is defined as the set of pairs{x,y X,Y ,s(x,y)}. As similarity functions are generally numeric, a decision must be made for a threshold at which to apply the function, giving ac-ceptable tradeoffs for sensitivity and specificity.
Specificity however is very difficult to measure, requiring as it does a very large collection with a known ground truth. Such a collection has been es-tablished for images in one context, in (Connor et al., 2015; Connor, 2015), which gives a quantified esti-mate of the near-duplicate ground truth for a collec-tion of one million images. Using this colleccollec-tion, we show a methodology for quantifying the specificity of near-duplicate finders, and give results for some of the most likely candidate functions.
2 BACKGROUND
Finding a pair of images, one of which has been created by applying minor transformations to the other, is not an easy problem. Such transformations, available in off-the-shelf image processing software, include changes to contrast, brightness, colour, tex-ture, and sharpness. It is easy for the human brain to see that two such images are obviously the same mod-ulo such changes, but these are exactly the properties that most similarity functions rely on for a mecha-nised quantification of similarity.
Implicitly, the context of testing for similarity function performance is usually a human user search-ing a very large collection for images that are most similar to a given reference image. As such, efforts tend to be concentrated on the performance and recall of nearest-neighbour search, and success is generally measured in terms of how many correct results can be obtained from a huge collection within a short time.
Our context of interest is quite different however. Increasing pressure is being put on Internet Service Providers, social network and search engine providers to filter image and video content that is being used il-legally, for example the portrayal of child abuse or content which is subject to copyright. Such content is always subject to minor changes, for a number of rea-sons but increasingly including deliberate attempts to evade detection. Therefore near-duplicate rather than duplicate detection is increasingly required.
In these and other contexts, the requirement is to automatically search large numbers of images against a reference collection which is also large, for
[image:2.595.310.521.95.217.2]exam-Figure 1: Very similar images, as determined by edge his-tograms
Figure 2: Very similar images, as determined by colour his-tograms
ple 106 to 107 images or keyframes. When a
pos-sible near-duplicate is detected, the two images then require to be tested by human inspection. Efficiency and high-quality semantic matching are requirements, but false positive detection becomes a much bigger is-sue. As the number of comparisons required is huge, and the majority of candidates have no match, false positive detection must be an incredibly rare event.
Figures 1 and 2 show some perhaps surprising motivating examples where very small distances have been observed over very different images, as a result of a very low false positive probability being applied over a very large sample population. In both of these cases, the image pairs shown have very small dis-tances measured according to a particular similarity function: that is, distances that were smaller than the majority of true near-duplicate pairs. These examples were found in a collection of 1012image pairs: such
coincidental matches are quite likely to occur even if their probability is as low as 10 12.
[image:2.595.310.521.265.383.2]3 RELATED WORK
We are not aware of any other work which at-tempts to measure comparative sensitivity and speci-ficity for different image similarity functions. We be-lieve one reason for this is the lack of any large collec-tion of images with a known ground truth of similar-ity, a lack mentioned by various authors, for example: “We do not have access to ground-truth data for our experiments, since we are not aware of any large pub-lic corpus in which near duppub-licate images have been
annotated.”(Chum et al., 2007), and the same lack
is noted in (Jinda-Apiraksa et al., 2013). (Vonikakis et al., 2014) note“ Although the target application of this dataset is image retrieval, it was selected due to the lack of other appropriate datasets [. . .]”.
There is also only a little work which objectively compares different image similarity functions. Royo (Ventura Royo, 2010) gives a comparison of differ-ent MPEG-7 techniques for image search, however, in common with most published work in this domain, the notion of success is based on correct retrieval from a relatively small collection of known images. Inter-estingly, the author finds that MPEG-7 Colour Struc-ture gives the best performance in this context, while we find it by far the worst of those tested. The main point is that the issues addressed here are defined by the scale of the search, and comparative studies over small collections of images do not give useful results. Douze et al. (Won et al., 2002) compare the GIST (Oliva and Torralba, 2001) image characterisa-tion with a “bag-of-features” approach, and find it su-perior for near-duplicate images among other things. They test over significant sizes of image collection by adding their ground truth of ‘similar’ images to large ‘distractor’ sets, including MIR-Flickr. How-ever they generate near-duplicate images from a rela-tively small, chosen set, through programmed quality loss and cropping, and also apply strong transforma-tions which are not covered by our definition of near-duplicate. The use of generated near-duplicate images weakens the results, as for any known transformation it is relatively straightforward to predict which simi-larity functions will perform well.
Foo et al. (Foo et al., 2006) gave one of the ear-liest treatments of the issue of near-duplicate image finding as a subject in its own right, and defined two categories of near-duplicate images:INDandNIND. INDimages are “derived from the same digital source after applying some transformations”, andNIND im-ages “share the same scenes and objects”. Here we concentrate primarily on theINDcategory which is most appropriate for our defined problem domain.
Our measurement of image similarity functions
for this purpose is based over the MIR-Flickr collec-tion of one million images (Huiskes and Lew, 2008; Huiskes et al., 2010). This dataset consists of one mil-lion “interesting” images downloaded from the web-site flickr.com through its public API. The “interest-ingness” of the images represents a score attributed by the Flickr service by taking into account the com-ments and the clickthroughs on the images. Since the 1M images included in the dataset were not se-lected with a specific task or set of criteria in mind, they should represent a good benchmark for evalua-tion of near duplicate detecevalua-tion algorithms on large image datasets.
Using this collection, the Mir-Flickr Near Dupli-cate (MFND) classification (Connor et al., 2015; Con-nor, 2015) identifies three sets of clusters which occur within the original set of one million images: dupli-cate clusters,INDnear-duplicate clusters, andNIND near-duplicate clusters. TheINDcollection comprises 1,958 clusters containing a total of 4,071 images, the majority of clusters containing only two elements. Using population statistics, the authors have shown that these are almost all of the IND pairs that exist within the whole set. Based on three relatively inde-pendent near-duplicate finding functions, an estimate is made of the total number which exist, including those not found. Furthermore, the standard error of this estimate has also been established at under 0.02. Therefore if an image is chosen randomly from out-side these three clusters, there is a very low probabil-ity that a near-duplicate will exist within the rest of the collection. We have used this property in order to establish the specificity measurements given in this article.
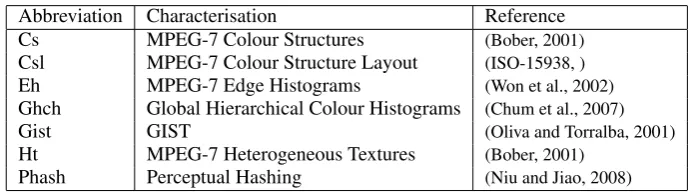
There are many image similarity functions de-scribed in the literature. In general, these can be clas-sified into those relying on global, and local, features. Here we report only the class of global feature func-tions, as we believe that these are most likely to be suitable for our specific problem domain. This is a questionable assumption that we are investigating fur-ther, although backed up by results in (Won et al., 2002) and (Chum et al., 2007). Table 1 summarises the different characterisations studied.
In many cases a particular distance metric is spec-ified as a part of the published mechanism. For exam-ple (Won et al., 2002) prescribes the use ofL1
(Man-hattan) distance, and most assume thatL2(Euclidean)
distance is the best measure of distance between char-acterisations. However we have found these presump-tions are most often wrong, certainly in this context, and we have tested all characterisations over a number of different metrics.
bun-Table 1: Image characterisations used
Abbreviation Characterisation Reference Cs MPEG-7 Colour Structures (Bober, 2001)
Csl MPEG-7 Colour Structure Layout (ISO-15938, )
Eh MPEG-7 Edge Histograms (Won et al., 2002)
Ghch Global Hierarchical Colour Histograms (Chum et al., 2007)
Gist GIST (Oliva and Torralba, 2001)
Ht MPEG-7 Heterogeneous Textures (Bober, 2001)
Phash Perceptual Hashing (Niu and Jiao, 2008)
dled with the extraction description, for example (Niu and Jiao, 2008) extracts a bitmap for comparison with Hamming distance, and (Chum et al., 2007) uses locality-sensitive hashing techniques over the ex-tracted representations. Rather than do this we main-tain the original representations and apply general metrics over them; optimisation techniques are best treated separately.
Finally, three of these characterisations rely upon the image colour palette; Csvery strongly, and Csl andGhch much less so, as despite their names the most significant information in these is extracted ac-cording to pixel intensity rather than colour. How-ever, results forCs are very bad, and based on this observation we repeated tests onCslandGhchusing only intensity, rather than colours. As they were in all cases better, we report only these variants here. From observation, manyINDnear-duplicate images in our reference set have been produced by making changes to the colour palette, which explains this observation.
4 DEFINITIONS AND CONTEXT
We assume that any near-duplicate finder is based on a positive numeric functionDover any two im-ages. NormallyDwill be a proper distance metric to allow scaling of the search, but this is not an essential semantic property.
To run an unsupervised search, it is necessary to useD as a classification function. To achieve this, a distance thresholdt must be chosen to be used in conjunction withDto form a predicate functionDt
over image pairs, such thatDt(x,y) =D(x,y)t.
The problem domain can then be characterised as the requirement to find the near-duplicate intersection of two image setsX andY, based on a concepual near-duplicate relationND, where this is defined as the set of pairsX\NDY where(x,y)2X\NDY ()
ND(x,y).
Normal definitions of sensitivity and specificity for a threshold functionDtcan now be defined as
con-ditional probabilities:
sensDt =
P
(Dt(x,y)),given(x,y)2X\NDY specDt =P
((x,y)2/X\NDY),given¬Dt(x,y) In general, as the search thresholdt is increased, the sensitivity increases and the specificity decreases. As the collections become larger, the specificity becomes increasingly important. After execution of the unsupervised process, the number of true positive matches found will besensDt· |X\NDY| and the number of false positives will be
(1 specDt)· |X| · |Y|
To put this into a realistic context, a typical situ-ation for the detection of child abuse images from a seized hard drive is
|X|=105,|Y|=107,|X\NDY|=103
so apparently excellent figures of, for example, sensDt =0.999,specDt =0.999
leads to the detection of almost all the 103true
posi-tives, but these will be impossible to find among 109
false positives. In fact, in this scenario, the specificity requires to be as high as 1 10 9before only around
half of the detected pairs will be true positives. To investigate such probabilities requires analy-sis over large image sets with known ground truths, where the combination of very rare events and very large populations can be quantified.
5 METHODOLOGY
[image:4.595.124.471.107.203.2]we have run the tests reported here using both IND and NIND sets and the outcomes are quantitatively indistinguishable.
To measure the sensitivity of a given metric across a range of thresholds, a set of pairs comprising the first two images from each cluster was used, giving a set of 1,958 pairs of IND images. A histogram of the distances is constructed, and a cumulative probability density function constructed from this to give sensi-tivity for eachDtacross the range of differenttvalues
for each similarity functionD.
To measure specificity of a given metric, a set of 5,000 images was randomly selected, ensuring that none of these were in any of the IND, NIND, or du-plicate clusters defined by the benchmark collection. It is thus a safe assumption that none of these im-ages have a near-duplicate match within the collec-tion. For each of these images, itsnearest neighbour from within the 1M collection, along with the distance to this, was determined. Note that in principle this requires 5⇥109distance calculations, and metric
in-dexing techniques were used to achieve tractability. As nearest neighbours are calculated, the small-est of the nearsmall-est-neighbour distances is therefore the smallest of approximately 5⇥109distances measured
across the two sets. As this distance relates two images which are not near-duplicates, this gives the specificity of the functionDt, wheret is this
small-est distance, as 1 (2⇥10 10)for these two sets of images.
In measuring specificity we make the simplifying assumption that, at least for the smallest few nearest neighbours measured from the set, these distances are the smallest from the whole set of potential distances; that is, not allowing for a single image to have a sec-ond neighbour which is a smaller absolute distance than another’s nearest neighbour. This is likely to be the case, but more importantly it also captures a more useful figure for use in unsupervised detection sce-narios, where a threshold-limited nearest neighbour search will be conducted.
We calculate results in terms of a cumulative prob-ability density function, therefore a threshold which admits the five smallest nearest-neighbour distances, i.e. a cumulative density of 0.001 over the 5,000 test distances, corresponds to a specificity of 1 10 9.
The cdf value of 0.01 corresponds to a specificity of 1 10 8which as explained earlier is around the
smallest useful threshold for our problem context: when comparing 105images against 107, around 104
false positives would result, this number varying with the product of the two collection sizes.
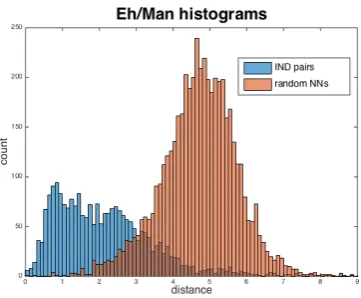
[image:5.595.335.516.92.241.2]To give an example of this analysis, Figure 3 shows simple histograms giving the outcome of using
Figure 3: Eh/Man Histograms
Manhattan distance over MPEG-7 edge histograms (Won et al., 2002). The histograms show the distribu-tion of distances over (1) known INDnear-duplicate image pairs, and (2) 5,000 randomly selected images and their nearest neighbours from within the set of 1M images – this latter of course is shifted a long way to the left of a histogram showing the distribution of dis-tances of randomly selected image pairs.
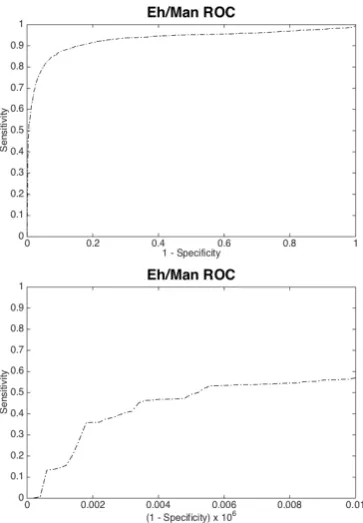
As can be seen, there is significant overlap be-tween the histograms. Figure 4 shows the same data displayed as the deduced cumulative probability den-sity functions. From these, it can be seen that using this function with a threshold of around 2 will give a specificity of around 1 (10 8)and a sensitivity of around 0.5, but to achieve an order of magnitude im-provement in specificity would allow a sensitivity of only around 0.1.
In order to allow comparisons of the different characterisation and metrics tested, these results are shown plotted in ROC curves, to show the essen-tial tradeoff between sensitivity and specificity as the search threshold is increased. Figure 5 shows the same data again plotted as ROC graphs, which is the form we will use from now on to present results of the different functions tested.
6 MEASUREMENTS
For each different characterisation shown in Table 1, we have applied the following proper distance met-rics: Manhattan distance, Euclidean distance, Cosine distance1 and, where possible, Structural Entropic
Distance (SED). There are of course many other po-tential metrics which could be tested.
1the angle between the vectors rather than the
Figure 4: Eh/Man Cumulative Probability Density (the lower graph is a magnification at the origin)
SED is the distance metric defined in (Connor et al., 2011) and refined in (Connor and Moss, 2012) for use in general vector spaces. It is defined over probability distributions, and as such can only be ap-plied to characterisations all of whose output val-ues are positive - notably not including those defined by discrete cosine transform, namelyCslandPhash. For all characterisations comprising only positive nu-meric values, they are normalised to sum to 1 for this purpose. SED gives the same ranking of outcomes as the better-known Jensen-Shannon distance (Lin, 1991), but is used here as it has better efficiency prop-erties for querying metric spaces in this context (Con-nor and Moss, 2012); the qualitative results shown here would be exactly the same for both metrics.
[image:6.595.323.505.92.354.2]Finally it is important to stress that we have exam-ined only the semantic properties of each image sim-ilarity function, rather than their relative search effi-ciency which varies very widely, as does their extrac-tion time. As menextrac-tioned earlier, there are many ways of optimising both of these and an objective compari-son of performance is not useful in simple terms.
Figure 5: Eh/Man ROC graphs. The lower graph is the ex-treme left-hand part of the upper, as required for this con-text.
7 RESULTS
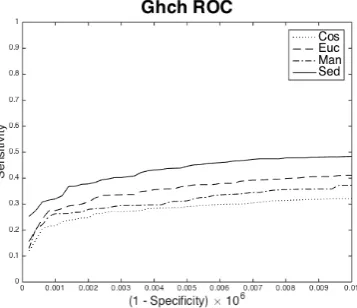
Figures 6 to 11 show results over the same axes for six of the seven characterisations tested. In each case the specificity range is restricted from 1 to 1 10 8
as previously explained. As can be extrapolated from these graphs, at this point the sensitivity improvement given by a decrease in specificity becomes marginal.
The missing characterisation, MPEG-7 Colour Structures, performs so badly it is not shown, achiev-ing a sensitivity in this range of less than 0.02 with any metric. The importance of measuring these over very large collections is emphasised by the finding by other authors that this is the best of the MPEG-7 char-acterisations over small test collections.
The result of these tests is clear from inspect-ing the graphs: of the 22 methods tested for near-duplicate classification, the best compromise between sensitivity and specificity is the use of Structural Entropic Distance/Jensen-Shannon Distance over the GIST image representations, which gives a sensitivity of around 0.8 for a specificity as high as 1 10 9.
Applying this in the context of a scenario with two collections each of 106 images, with a
near-duplicate intersection of 103images, then querying at
[image:6.595.98.282.93.393.2]Figure 6: Csl ROC graph for three metrics
Figure 7: Eh ROC graph for four metrics
Figure 8: Ghch ROC graph for four metrics
[image:7.595.88.272.95.250.2]By comparison, for example, using perceptual hash-ing with Euclidean distance will return 5,000 false positive pairs for every 500 true pairs.
[image:7.595.90.270.290.446.2]Figure 9: Gist ROC graph for four metrics
Figure 10: Ht ROC graph for four metrics
Figure 11: Phash ROC graph for three metrics
8 CONCLUSIONS
[image:7.595.321.503.453.616.2] [image:7.595.90.269.486.640.2]large collection of “naturally” selected images which happen to contain near-duplicates, rather than a con-structed set. The resulting ground truth should not therefore be biassed towards any particular function.
Validation of the results however is a further chal-lenge, at least until such time as another large image set with a near-duplicate ground truth is identified. We are currently working with theCoPHiR collec-tion (Bolettieri et al., 2009) (108images) to establish
whether the figures produced here are consistent. The variation among the different distance metrics is a novel observation. Characterisations are normally used with either L1 or L2 distance, whereas in the
majority of cases either Cosine orSED/JSDperforms best. These metrics give a closer match according to the correlation of values within the characterisations, rather than differences in their absolute magnitude. However the differences among all the characterisa-tions do not seem to suggest any general rules about the best metric to use in different contexts, which re-quires further investigation.
ACKNOWLEDGEMENTS
We would like to thank Richard Martin and Karina Kubiak-Ossowska of the University of Strathclyde for help with access to the ARCHIE-WeSt HPC facilities necessary to achieve some of the analysis.
Franco Alberto Cardillo was supported by the Na-tional Research Council of Italy (CNR) for a Short-term Mobility Fellowship (STM), which funded a stay at the University of Strathclyde in Glasgow (UK) where part of this work was done.
Richard Connor was supported by a symmet-ric National Research Council of Italy (CNR) for a Short-term Mobility Fellowship (STM), no. 33313, 13/05/2015, which funded a stay at the Consiglio Nazionale delle Ricerche, Pisa, where the work was further progressed.
REFERENCES
Bober, M. (2001). Mpeg-7 visual shape descriptors. IEEE Transactions on circuits and systems for video tech-nology, 11(6):716–719.
Bolettieri, P., Esuli, A., Falchi, F., Lucchese, C., Perego, R., Piccioli, T., and Rabitti, F. (2009). Cophir: a test collection for content-based image retrieval. CoRR, abs/0905.4627.
Chum, O., Philbin, J., Isard, M., and Zisserman, A. (2007). Scalable near identical image and shot detection. In Proceedings of the 6th ACM international conference on Image and video retrieval, pages 549–556. ACM.
Connor, R. (2015). Mir-flickr near-duplicate data.
mir-flickr-near-duplicates.appspot.com. Connor, R., Cardillo, F., MacKenzie-Leigh, S., and Moss,
R. (2015). Identification of mir-flickr near-duplicate images. In 10th International Conference on Com-puter Vision Theory and Applications.
Connor, R. and Moss, R. (2012). A multivariate correla-tion distance for vector spaces. In Navarro, G. and Pestov, V., editors, Similarity Search and Applica-tions, volume 7404 ofLecture Notes in Computer Sci-ence, pages 209–225. Springer Berlin Heidelberg. Connor, R., Simeoni, F., Iakovos, M., and Moss, R. (2011).
A bounded distance metric for comparing tree struc-ture.Inf. Syst., 36(4):748–764.
Foo, J., Sinha, R., and Zobel, J. (2006). Discovery of image versions in large collections. In Cham, T.-J., Cai, J., Dorai, C., Rajan, D., Chua, T.-S., and Chia, L.-T., edi-tors,Advances in Multimedia Modeling, volume 4352 of Lecture Notes in Computer Science, pages 433– 442. Springer Berlin Heidelberg.
Huiskes, M. J. and Lew, M. S. (2008). The MIR Flickr retrieval evaluation. InMIR ’08: Proceedings of the 2008 ACM International Conference on Multimedia Information Retrieval, New York, NY, USA. ACM. Huiskes, M. J., Thomee, B., and Lew, M. S. (2010). New
trends and ideas in visual concept detection: The MIR Flickr retrieval evaluation initiative. InMIR ’10: Pro-ceedings of the 2010 ACM International Conference on Multimedia Information Retrieval, pages 527–536, New York, NY, USA. ACM.
ISO-15938. Mpeg-7 multimedia content description inter-face.
Jinda-Apiraksa, A., Vonikakis, V., and Winkler, S. (2013). California-nd: An annotated dataset for near-duplicate detection in personal photo collections. InQuality of Multimedia Experience (QoMEX), 2013 Fifth Interna-tional Workshop on, pages 142–147. IEEE.
Lin, J. (1991). Divergence measures based on the shannon entropy. Information Theory, IEEE Transactions on, 37(1):145–151.
Niu, X.-m. and Jiao, Y.-h. (2008). An overview of percep-tual hashing. Acta Electronica Sinica, 36(7):1405– 1411.
Oliva, A. and Torralba, A. (2001). Modeling the shape of the scene: A holistic representation of the spatial envelope. International Journal of Computer Vision, 42(3):145–175.
Ventura Royo, C. (2010). Image-based query by example using mpeg-7 visual descriptors.