Rochester Institute of Technology
RIT Scholar Works
Theses Thesis/Dissertation Collections
2010
Time delay and its effect in a virtual lab created
using cloud computing
Juan Nunez
Follow this and additional works at:http://scholarworks.rit.edu/theses
This Thesis is brought to you for free and open access by the Thesis/Dissertation Collections at RIT Scholar Works. It has been accepted for inclusion in Theses by an authorized administrator of RIT Scholar Works. For more information, please [email protected].
Recommended Citation
Time Delay and its Effect in a Virtual Lab
Created using Cloud Computing
By
Juan Nunez
Thesis submitted in partial fulfillment of the requirements for the
degree of Master of Science in
Networking and Systems Administration
Rochester Institute of Technology
B. Thomas Golisano College
of
Computing and Information Sciences
Rochester Institute of Technology
B. Thomas Golisano College
of
Computing and Information Sciences
Master of Science in
Networking and Systems Administration
Thesis Approval Form
Student Name:
Juan Nunez
Thesis Title:
Time Delay and its Effect in a Virtual La
b
Created using Cloud Computing
Thesis Committee
Name Signature
Date
Prof. Charles Border
Chair
Prof. Yin Pan
Committee Member
Thesis Reproduction Permission Form
Rochester Institute of Technology
B. Thomas Golisano College
of
Computing and Information Sciences
Master of Science in
Networking and Systems Administration
Time Delay and its Effect in a Virtual Lab
Created using Cloud Computing
I, Juan Nunez, hereby grant permission to the Wallace Library of the Rochester Institute of Technology to reproduce my thesis in whole or in part. Any
reproduction must not be for commercial use or profit.
i
Abstract
The emergence of Cloud Computing, as a model of virtualized physical resources and
virtualized infrastructure, offers the opportunity of outsourcing the implementation of a
Virtual Lab Manager. Virtual Lab Management has come to be considered the Holy Grail
in the deployment and administration of Labs created in a Virtual Environment. With the
advent of Cloud Computing new opportunities are developing that promise to cover much
of the future in Virtual Labs. Designing network and information labs with real
equipment and tools does not make sense from a cost benefit standpoint, as hardware gets
obsolete in a short gap of time, therefore replacing real labs with labs in a Virtual
environment this days is a must for teaching in information, security and network classes.
Choosing an adequate Virtual Lab Environment solves the problem of creating an
adequate academic environment where teachers can serve as effective guides for students
which will have a lot of freedom and first hand on experience in the learning subject
under consideration. A Virtual Lab Manager in a Cloud Computing environment
reduces cost even further, but creates some doubts about the time delays inherent in such
a technology. After choosing to use the one created by VMLogix for Amazonaws ec2, it
was decided to answer a question in this paper: being Virtual Labs a real time application,
how it is affected by time delays and bandwidth when accessed from remote places? The
same criteria used for video on demand, voice-over-IP or on line business system as used
in networks are going to be applied in the presented work although the much interactivity
in a Virtual Lab of any kind .
Categories and Subject Descriptors
General Terms: Management, Monitoring
ii
Table of Contents
1. Introduction ... 1
2. Problem Statement ... 4
3. Literature Review... 5
4. Methodology ... 9
5.1 Subjective Variable………..……… 12
5. Tools used... 13
6. Experiences with VMLogix Lab Manager for Amazonaws ec2 ... 14
7. Experiments ... 17
7.1 Experiment 1. Network Control Experiment: QoS control………...20
7.2 Experiment 2. Test Machine Experiments: detailed controls……….22
7.2.1 Experiment 2a. Test Machine Experiment: time delay control ... 26
7.2.2 Experiment 2b Test Machine Experiment: Fixed upload control (95%)... 28
7.2.3 Experiment 2c. Test Machine Experiment: Using test.net ... 28
7.2.4 Experiment 2d Fixed bandwidth control, variable time delay. ... 29
7.2.5 Experiment 2e Changing QoS values in test machine ... 30
7.3 Experiment 3 QoS and time delay control………30
7.3.1 Experiment 3a QoS Control: 40% bandwidt h control ... 31
7.3.2 Experiment 3b QoS Control: 60% bandwidth control ... 32
7.3.3 Experiment 3c QoS Control: 50% bandwidth control... 32
7.4 Experiment 4 Controlling the controller………33
7.4.1 Experiment 4a Bandwidth Control ... 34
7.4.2 Experiment 4b 40% bandwidth and time delay control ... 34
7.4.3 Experiment 4c 60% bandwidth and time delay control ... 35
7.4.4 Experiment 4d Time delay control... 36
7.5 Experiment 5 Numeric tools control……….36
iii
7.5.2 Experiment 5b Time delay and bandwidth Control ... 39
8. Analysis and Results ... 40
9 Summary ... 42
10 References ... 43
11 Appendices ... 46
11.1 Accessing Cloud computing: image gallery………46
11.2 Scripts……….50
iv
Table of Figures
1 Working Environment……….……….. 10
2 Using Cloud Computing………... 16
3 Communication between virtual machines……….………. 17
4 Using QoS control in Untangle………... 18
5 Measuring Ping Time……….………. 19
6 Bandwidth versus s-value……… 22
7 Test and Filter Machine………...………... 23
8 Using the traceroute command……….. 24
9 The Filter Machine………... 25
10 Effect of delay in ping time.……… 27
11 Discomfort versus delay time………... 29
12 Discomfort versus ping time delay 40% bandwidth………. 32
13 S-values versus ping time for experiment 4b………... 35
14 Numeric Tools Experiment 37
15 Experiment 5a: discomfort versus time delay………..……. 39
16 Time delay in test machine……….. 41
17 Authenticating for Linux Machine……….. 46
18 Deploying a Linux Machine... 47
v
List of Tables
1 Bandwidth control for a network……… 21
2 Measuring time delay control………. 27
3 Measuring time delay: details……… 56
4 Measuring time delay: changing bandwidth fixed upload……. 57
5 QoS Control for test machine fixed upload………. 58
6 Measuring time delays (60%/95% bandwidth)……….. 59
7 Fixed QoS Control for test machine (60%/95% bandwidth)….. 59
8 Measuring time delay in QoS Control……… 60
9 Round trip values in QoS Control for test machine……… 61
10 Measuring time delays (40% bandwidth)……….. 61
11 Fixed QoS Control for test machine (40% bandwidth)………. 63
12 Measuring time delays (60% bandwidth)………... 64
13 Fixed QoS Control for test machine (60% bandwidth)………. 65
14 Measuring time delays (50% bandwidth)………. 66
15 Fixed QoS Control for test machine (50% bandwidth)………. 67
16 Time delay Control for test machine……….. 68
17 Ping time Control for test machine………. 69
18 Ping time Control for test machine………. 70
19 Time delay Control for test machine……….. 71
20 Time delay Control for test machine for Fixed Bandwidth…… 72
21 Time delay Control for test machine for Fixed Bandwidth…… 74
22 Time delay Control for test machine for Fixed Bandwidth…… 76
23 Time delay Control for test machine……….. 77
24 Time delay changes in outgoing packets……… 78
25 Ping time measurement for route 1……… 79
26 Ping time measurement for route 2……… 79
27 Round trip delay measurement in control machine……… 81
vi
Lists of Lists
Scripts
1 exe_ping.sh: Capturing round trip delay data………... 49
2 dat_proc.rb: Processing round trip delay data……….. 50
3 tc_ini.sh Initializing a queue discipline……… 51
4 tc_delay.sh: inducing delay in a queue discipline……….. 52
5 tc_bw.sh: inducing bandwidth change in a queue discipline……… 53
6 tc_both.sh: inducing bandwidth and time delay change in a qdisc 54
7 tc_destroy.sh: Eliminating a queue discipline………. 55
1 Using the route command……….….... 24
2 Time delay control in test machine (2a) .…...………... 26
3 Time delay control in test machine (2b) .….…………. 56
4 Fixed QoS with time delay control …………..……… 58
5 QoS and time delay control (40% bandwidth)………... 61
6 QoS and time delay control (60% bandwidth)………... 63
7 QoS and time delay control (50% bandwidth)………... 65
8 Time delay control……….…… 70
9 Time delay and bandwidth control……….……. 73
10 Time delay control……… 75
11 Induced time delay changes for 256 kbs bandwidth.… 78
12 Time delay and bandwidth changes……….…… 80
1
1. Introduction
The existence and use of Virtual Machines can be traced back as far as 1960 when
IBM began to use virtual machines in its mainframes. But explosion in the use of this tool
in the last years is not only explained by the fact that they “maximize hardware
utilization, decrease hardware costs, reduce power consumption and simplify system
management and security“ (Virtuautopia), and although each one of these advantages
could by themselves justify the need to use Virtual Machines, the explosion in use is
really explained by the vast amount of applications that have emerged around this
technology
One such application is the Virtual Lab. Such term is understood as an environment
created in a distributed network space to access virtual machines and its applications and
managed centrally as differentiated by a more general concept that accept as such any
results given by electronic means in a different way that those obtained from real physical
labs (UNESCO). Virtual Machines technologies allow the virtualization of hardware
interfaces to run different guest Virtual Environment in a physical box, providing at the
same time security and stability no matter how demanding the applications may be. The
use of these technologies for educational purposes is, thus, very promising.
Having personally observed and experienced in other more advanced university how
this tool could transform the way people gain access to modern technologies (Border),
some of my colleagues and myself took the decision to implement or use a Virtual Lab,
as above defined, to be used in courses related to network design, information security
and database management and in this process take some observations, design experiments
and make conclusions as a thesis that could be used as guide in future developments.
Beginning to use Virtual Machines as an educational tool is not an easy task, but the
clear advantages they represent when used in applications as virtual labs, far surpasses all
other considerations. To design, develop and implement a virtual lab starting from a null
experience requires dedicating a lot of time deciding how to get virtual machines working
at the lower possible cost using all available resources at the PUCMM. Once this problem
2
Another problem related with developing Virtual Labs is the decision about
management. Rigby and Dark could give some inspiring thoughts when it comes to
choose a Virtual Lab. Whether to use outsourcing, because in this case the institution
concentrates on lab design and less on maintenance, or building remote lab environment
“in-house” piggy backing on existing resources and management. Using in this way the
existing network and authentication facilities is a possibility in this last mentioned
approach.
The final aspect to consider is what Virtual Machine Manager to use. This choice
conditions in a great deal the lab manager to select. VMWare is the dominating solution
existing today in the market, and was a first choice, but it was found out that installation
and management of this product is not the best solution for a first try.
The emergence of the computing cloud in the academic environment came as a fast
solution and removes many uncertainties in the development of the Virtual Lab. Getting
in contact with Amazon EC2 cloud computing and VMLogix Lab Manager was another
great surprise as these products represent a solution that outsources the construction and
the management of the Virtual Lab.
To understand the concept of Cloud Computing a definition from Vaquero comes very
handy: “Clouds are a large pool of easily usable and accessible virtualized resources
(such as hardware, development platforms and/or services). These resources can be
dynamically reconfigured to adjust to a variable load (scale), allowing also for an
optimum resource utilization". Cloud computing means a lot of computing resources but
there are a lot of new problems to explore.
One of the problems encountered with cloud computing is getting instances to start.
Lagar et al. put it this way: “Instantiating new VMs is a slow operation (typically taking
“minutes” [EC2])". This slow start is a factor to be considered when using these labs.
Besides the moment the machine starts it is unaware of any running application state.
Can these delays be acceptable in the long run? It was decided to treat virtual labs in
3
such consider the effect of overall time delay in the acceptability of this working
environment.
The work to be presented can be summarized with this question: is there any way to
measure time delays and bandwidth limits while working in a virtual lab constructed in a
cloud computing environment that would make, beyond those limits, impossible to
develop normal work ?. Up to what point can be considered time delay and bandwidth
limit as user friendly when accessing a virtual lab constructed in the clouds?
One element of this time delay is network delay. Network delay, as a known fact, is
composed of propagation, serialization, and queuing delays. Of these components the one
that affect most a Virtual Lab is queuing delay, the one depending on network congestion
and routers queue length, and it can be reasonably accepted that propagation and
serialization speeds are sufficiently large as not to affect access to Virtual labs. Another
element to consider, not related to the network delay, is the processing delay giving
mainly by the virtual machine performance.
To better study and understand the viability of this work it was decided to analyze how
the time delay could affect access in real time the virtual machines. Much effort was
concentrated in evaluating real time access to the virtual machines considering as
independent variables the existing network delay and the bandwidth to access the virtual
lab. It was not taken into consideration other factors, such as “system load, real operating
system overhead, real scheduling” (M. D. Canon) and it was concentrated in testing real
4
2. Problem Statement
The presence of virtual machines has brought many advantages in educational
environments like flexibility, cost reduction and ubiquity, especially if there is access to a
Virtual Lab, because by eliminating the distance barrier, it has created a very special real
time application in the educational field. But as in all real time applications the
uncertainty exists of what QoS (quality of service) will be offered in a network that relies
in TCP protocol. But other factors are equally important in the QoS required: bandwidth,
load on the servers working on the virtual machines, packet losses, jitter, routing changes,
and, very specially, time delay.
Using Virtual Machines in a Cloud Computing environment for educational purposes
should not only be seen as a valuable tool, but should also be considered confronted, by
its own nature, with different constraints.
As a consequence of bandwidth, virtual machine performance or queue congestion,
virtual machine deployment as any real time application can be affected. The aim of this
work is to evaluate Quality of Service in virtual machine lab in a Cloud Computing
environment, as a function of time delay and bandwidth variations.
When students access such a virtual lab in different places and time of day, under
unfavorable conditions, they will be working under different environments and their
ability to complete the task at hand could be impaired. An observable fact is that people
using internet at different time of the day, or different days in the weak have different
level of bandwidth and therefore experiment different levels of time delay.
It was decided to do some research on the effect that this changing environment, will
have on satisfaction using Virtual Machines. Time delay was measured in a quantitative
way using known monitoring tools in a machine that was to be used as filter between the
virtual machines and the machines accessing the latter. Additionally, the bandwidth was
5
A result of this research is to predict and answer the question: what is the maximum
level of time delay and the minimum bandwidth that users would accept to access the
virtual lab without any disturbing consequences?
And the practical importance of the answer is given by the fact that any user can
determine with simple and easy tools if any disturbance can affect the performance of the
virtual lab.
3. Literature Review
Much study has being done on issues related to network delay. Another story is finding
papers relating network delay with level of satisfaction in the use Virtual Lab. Needless to
say there is no literature to find in issues related to delays in accessing Cloud
Computing, except when describing the known and accepted fact that deploying virtual
machines takes a great deal of time.
Eli Brosh et al. did some research about the delay performance of TCP because of “the
gap between the perceived shortcomings of TCP and its wide adoption in real-world
implementations“. They considered in their work the two real-time media applications
most used in internet: VOIP and video streaming, but they assert that like any other real
time application, as Virtual Lab, that works under TCP should be, most of the time delay
friendly as those two pinpointed applications. What Eli Brosh et alt consider with respect
with VOIP and video streaming can be also be applied to Virtual Labs as application
limited – the sending rate is giving by the application and assuming that the underlying
network do not have a greedy flow.
Closely related to performance or time delays is the subject of bottlenecks in
networks. While bottlenecks are reduced to management and performance overhead the
other subject are more general especially when virtualization is involved. In their work
Huang, Liu, Abali and Panda take note of these problems and decided to reduce
virtualization overhead to get a performance close to the one in the real machine (“A Case
for High Performance Computing with Virtual Machines”). The problem with network
6
integrated in the I/O virtualization overhead. They suggest however that using VM to
work in a static computing environment do not affect management efficiency. As Virtual
Labs are normally created in a static environment it is going to be assumed that few
dynamic changes, coming from within virtual labs, are going to affect any measurements
made.
No matter how many virtual machines form part of a virtual lab it is expected that
bottlenecks are not going to be created by their interactions. Wolinsky et al. discuss the
construction of isolated network inside a wide area Overlays of virtual Workstations to
reduce overlay in management of wide area distributed computing. This is possible due to
the advances in “virtual computing and the revelation that compute-intensive tasks run
well on system virtual machines (VMs), the ability to develop, deploy, and manage
distributed systems has been ameliorated“(“On the Design of Virtual Machine
Sandboxes”). Low administrative overheads, and, therefore, high performance, with very
low execution time overhead allows the development of such isolated networks. It will
not yet be considered the distribution of computing load between virtual machines. But
the idea could be of interest in future development.
Armitage et al. being concerned with the design of Virtual labs to be used in courses of
Network Design and while worried by management tasks in Virtual Environment which
they solved by the design of simple scripts and solved the problem of connectivity
recurring to light weight free software applications (“Remotely Accessible Sandboxed
Environment”). In this work the manageability of task in virtual machines is solved by
the Lab Manager, but using simple scripts to measure the variables in the experiments to
be made and the importance of free software tools is vital in simulating different
situations
The idea of connectivity as exposed by Armitage could be of some importance in this
work. If the tools to be used in connecting to the virtual machines do not represent any
disturbing factor in the bandwidth, then the only other consideration to take into account
7
The erratic behavior of some applications is just a case more to consider the importance
of having tools to measure efficiency of applications. Mennon et al. consider the need of
developing tools to measure performance within Virtual machines using virtual
connections. Their research is concentrated in network applications within a Virtual
Machine environment. In their studies they even considered “unforeseen interactions
between an application and the VMM and the strange performance anomalies that can
happen (“Diagnosing Performance Overheads in the Xen Virtual Machine
Environment”).
Soror et al. Studied and worked on the configuration of the VM considering how to
allocate physical resources to the VM. Through the physical allocation of resources the
system will be having a better degree of efficiency as whole and applications will not be
longer competing against each other for those resources (“Automatic Virtual Machine
Configuration for Database Workloads”) .But when the resources is just bandwidth, how
will applications compete against each other ? How will the users of the VM stand
against the use of the applications of the available bandwidth?
The impact of performance of a VMM working with multiple guests each one with
different and concurrent applications and with special intensive processor requirements as
well as bandwidth intensive and latency sensitive requirements was considered by Diego
Ongaro et al. In a study where they examined those different applications for different
VM scheduling they limited their research on the impact of I/O scheduling on the overall
performance (“Scheduling I/O in Virtual Machine Monitors”).
Aravind Menon et al. state the fact that there few tools to debug performance problems
in VM environment. In their work they found situations not easily explained, in particular
when the applications under observation were related to network use (“Diagnosing
Performance Overheads in the Xen Virtual Machine Environment”). In all cases the
interaction with the Virtual Machine Monitor helps explain all the odd behaviors.
Dong-Jae Kang et al. observed the relation between Virtual Machines operated
8
machine is treated in the same way as the I/O of a process of a normal system is a
guarantee that proper I/O bandwidth will not be allocated. The overall improvement on
average utilization of I/O resources is no guarantee that these same resources are granted
in fair way (“Proportional Disk I/O Bandwidth Management for Server Virtualization
Environment”). The same reasoning can be brought about network allocation.
The study of high performance network virtualization is analyzed by Guangdeng Liao et
al. The advantages of isolation, manageability and resources ownership are weighed
against degradation of performance of network intensive applications. They pay special
attention to the overhead of network I/O virtualization, the extra driver domain to process
I/O requests and the extra scheduler in the virtual machine monitor (MVM) for
scheduling domains as they affect performance of network intensive applications
(“Software techniques to improve virtualized I/O performance”).
The problems related with manageability are also considered by Wei Huang et al.,
especially for large scale systems, a problem not worth much attention before. Among the
manageability efforts maintenance, reconfiguration, fault tolerance, and administration
should be included (“Virtual machine aware communication libraries”). The importance
of manageability has to be considered as an important requirement necessary to achieve
high performance as well as high productivity.
To improve network traffic and, therefore, services qualitatively and quantitatively Qiang
Li1 et al. propose to that a monitoring and analysis of it as a requisite when it is desirable
no to under-utilize services. They consider that each service in a network has different
computational needs and the workload assigned to it will vary and while one service with
a peak workload in a given moment may be causing that another service may be sitting
idle, but worst there may be no capacity to transfer resources when a service needs them
(“VM-based Architecture for Network Monitoring and Analysis”).
Irfan Ahmad et alt in analyzing Vmware ESX Server found some amazing
discoveries in regard of I/O storage subsystem performance for an architecture, in the host
9
arrays and a storage area network (SAN), they found that the behavior of the VM
machines closely matches that of the host server very nearly: higher throughput in the
host server shows higher throughput in the virtual machines (“An Analysis of Disk
Performance in VMware ESX Server Virtual Machines”).
4. Methodology
As the goal of this thesis is to establish what values in time delay and bandwidth
measured when accessing a virtual lab constructed using the VMLogix Lab Manager are
to be considered acceptable from the users viewpoint, creating adequate labs, to be used
in experiments in a controlled environment, lead our main effort in the work that is been
presented.
Five distinct experiments were designed with the idea to measure, under controlled
environment, the independent variables of the work at hand: time delay and bandwidth.
During the development of the experiments many type of tools were used. Most of
them have in common their simplicity and their open source origin. Tools are needed to
create the controlled environment needed in the experiments, to measure time delay and
bandwidth and to process the captured data. In this latter case some of the tools will be
simple ruby or shell scripts to process data.
The experiments all needed the use of a special machine that is going to be called the
filter or control machine -usually situated close to a router- where accessing the Virtual
Lab is affected by manipulating the independent variables to be measured. They all
needed one or more test machines from where access to the Virtual Lab was started. Most
of the experiments measured the independent variables, time and delay and bandwidth,
starting from one or more of the machines.
In the first four experiments the filter machine was an Untangle Machine as this Linux
distribution has an easy way to access the tools to be used.
In the first experiment group of five (5) students were the participants, and were chosen
10
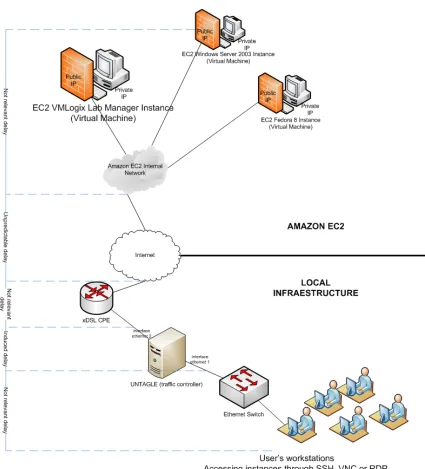
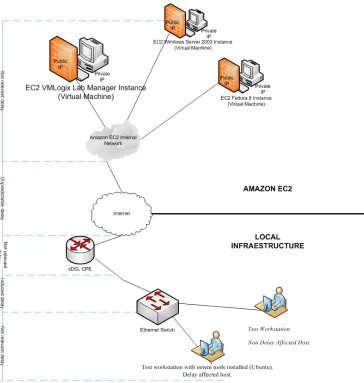
[image:20.612.111.536.125.594.2]same time period while in the filter machine the dependent variables were manipulated.
Fig 1 Working Environment
In a second experiment real machines and virtual machines were connected to the filter
machine. The reason for choosing those machines was due to the fact that the interaction
11
experiment. The disturbing factors encountered in the first experiment were diverse as
discovering virae in some of the machines used as not controlling other users in the same
network. It was decided to continue using only virtual machines from the third
experiment which was otherwise similar to the second experiment as bandwidth and time
delay were made to affect the test machines.
Another aspect considered was the time delay imposed in the packets going through
the filter machine. But in this case some discrete values in a wide range were used. The
recommendations from the International Telecommunication Union (ITU) for network
delays in voice applications were the starting point for any considerations (Varshney,
Snow, McGivern and Howard).
The levels of time delays used in the experiments were classified as low, medium and
high level time delays. Values up to 200 ms were considered as low level time delays.
From 200 ms up to 500 ms were medium time delays. And values from 500ms were
considered in the high level range.
In the fourth experiment the Untangle machine was no longer directly connected to the
router, but was directly connected to the real machine where time delay was controlled.
The Untangle machine was limited to control the test machines bandwidths, while time
delay was setup in the router machine.
In the first four experiments the filter machine was always the Untangle Machine.
With this machine different level of bandwidth were established for the machines
accessing the virtual labs. All the allowed bandwidths were measured as a fraction of the
maximum bandwidth of the router.
In the fifth experiment the Untangle machine was no longer used and an Ubuntu
machine was taken as test machine and another linux machines was used as controlling
machine in the measurements made.
To measure the time delay for the connection from the user's machines to the Virtual Lab
12
intervals the time delay being set up.
Characteristic of this experiment was the use of scripts that started and changed
parameters for the tc command to better control time delay and bandwidth using
pre-established values.
Controlled and measurable bandwidths were used during the experiments, from the
maximum available in the experiments to lower values, like the ones used in a dialog
connection, in a discrete range of values to be considered. While both time delays and
bandwidth were used in experiments to observe the effect of both variables.
To guarantee that graphical and text consoles will be accessed and to be tested, an
application lab having at least one Window and one Linux machines was chosen. Access
to the Windows graphical environment was tested as well as the access to the console of
the Linux machine.
5.1 Subjective Variable
The applications chosen were run in all the experiments created, using real networks
and virtual local networks, the surveys conducted and measurement taken during the
whole experiment were done using those chosen applications. The surveys and the values
measures produced qualitative results that provided us feedback of a qualitative kind.
The qualitative feedback was the basis for a subjective and most important variable:
the degree of discomfort that users felt under the experiments. The qualitative aspect is
defined the moment it is noticed some slowness in access to the virtual machines in the
clouds. But, how much slow must the access be to confirm that one or more test persons
do not feel at ease working with the labs in all or some of the experiments?
As the first experiment was the only one where some test persons participated, and all
of them had previous experience using VM, and their individual perception was a good
measure of the discomfort felt when bandwidth and/or time delay were not what they
13
was the main line of action followed to get a picture of the relation between the
independent variables and the subjective discomfort value.
A range of values, going from 1 to 10, were established to associate discomfort with a
quantitative measure. Values 1 to 5 were associated with fast to less fast, but normal,
access to the virtual machines in the clouds. The value 6 and up were mapped to
slowness, or impossibility of browsing, or doing any work any work in the virtual
machines.
The value 8 was given when one or more test persons felt discomfort using the
keyboard in a Windows or Linux Console. Never, it was felt or was not reproduced the
environment, the value 10 was used to mark impossibility of using the virtual lab.
An important characteristic of this s-delay variable is related to the fact that it is not
related to just one human sense alone, like auditory or visual sense, but the value that the
participants can give is also determined by the use of electro-mechanical tools such as the
computer keyboard or the mouse. As such the participants can use objective criteria to
establish the degree of discomfort they felt.
A weakness in the last four experiments was given not only by the small number of
participants, that never were more than three individuals, and besides these were more
than professional using the VMLogix Lab Manager when it was time for the last
experiment, but also experts in anticipating changes in the environment, although there
was not, in no one of the experiment, an established period of time to determine when
time delay, or bandwidth was going to be affected.
5. Tools used
To have some quantitative analysis as part of the research, monitoring tools were used to
measured time delays and bandwidth. And to make changes in these variables some
controlling tools were taken into use.
One simple tool used to check the measured values of both variables time delay and
14
mainly in the controlling machine, but sometimes was also used in the test machines too.
Round-trip time delays were measured using the old and reliable ping tool. To that
end a script was created to “ping” a machine in the route to the virtual lab machine, as the
virtual machines themselves could not be reached by the icmp protocol. The script
“pings” the target machine a fixed amount of time during a time period to be established
when the script is called. This script will be run in some test machines and always in the
controlling machine.
To establish which one is the target machine to be “pinged” the traceroute command was
used having as a parameter the fixed ip address of the Lab Manager.
As mentioned in the description of the experiments, in some cases an Untagle Machine
was used as filter node to the router to change bandwidth, in a graphical way, and
establish time delays for the test machines
The tool tc (traffic control), an essential part of the iproute2 package of Linux, was
essential to configure qdiscs (queue disciplines) and configure packet classifications into
qdiscs. This valuable tool is forming part of the later Linux Kernels and can, therefore be
found on any Linux distribution. netem ( network emulator), another tool, is a parameter of tc, was used to establish specific quantitative time delays in one or more machines that
communicate using the controlling machine. htb will be the classful qdisc used to control
bandwidth. Used together with netem it was possible to control both time delay and
bandwidth.
The last tool to be mentioned is the iperf tool which was also used to measure delay and
bandwidth between two machines. Iperf is developed by the National Laboratory for
Applied Network Research (NLANR). Iperf can also be used to report on jitter and
datagram loss.
6. Experiences with VMLogix Lab Manager for Amazonaws ec2
Using Amazonaws together with VMLogix LabManager for the first time was not a
15
setbacks were experienced. The core of using Amazonaws can be reduced to managing
existing templates, importing available ones or creating images to be used as templates.
With templates configurations are created and these serve as virtual labs.
VMLogix Lab Manager facilitates the tasks of managing the resources, but other tools
can be used such as the “AWS Management Console” and the ec2-tools. These tools
should work in a coordinated way, but sometimes some surprises are to be expected.
Images created with any of the tools were not ready to be imported and used in
configurations. That was, and still is, one of the odd behaviors to be learned about.
The other big surprise came when it was discovered that while the concept of IPZones
is used in VMLogix Lab Manager its Cloud Edition cannot use it as AWS uses the
concept of EC2 Security Groups, and, therefore, creating isolated virtual machines to be
used in security labs is still a task at hand. But creating otherwise complex tasks such as
Virtual PBX Stations has shown to be simple routine with the tools at hand.
To do the work at hand, labs were designed to be used by students at PUCMM academic
center. To that end users were added to be managed by VMLogix_LM and some normal
16
FIGURE 2USING CLOUD COMPUTING
(Time delay is an issue when doing work labs in the cloud. It starts the moment any
configuration or image is deployed. )
Two of these labs were used in this proof of concept in more than one experiment. In
common they had the integration of two machines: one Linux Machine and one Windows
Machine. The former will be the reference when measuring delay friendliness in a
17
should be pointed out that the virtual machines were not isolated one from another,
pinging between them could proved it, but they did not form an unique internal network
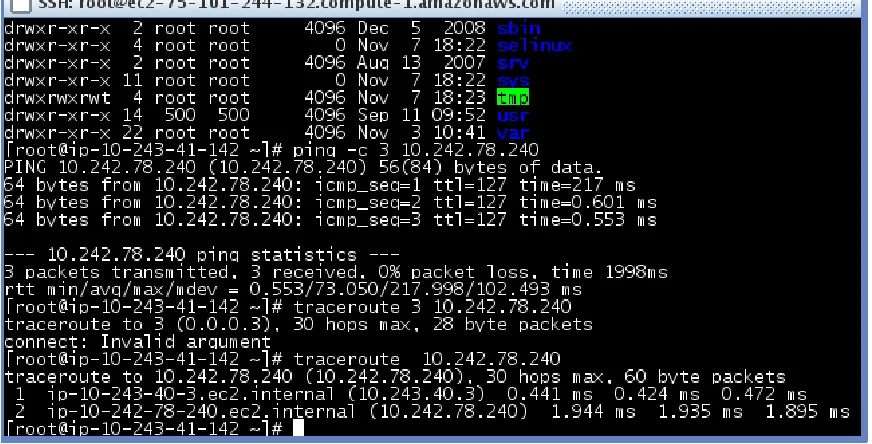
as figure 2 shows while tracing the network route. Each machine belongs to network and
[image:27.612.109.545.202.424.2]is attached to a router, but the routers can reach each other.
Figure 3 Communication between virtual machines
In other works it can be assumed that there is no difference in delays worth naming in
accessing any of the machines in a lab that uses more than one machine.
7. Experiments
It should be pointed out that deploying a configuration is a time consuming task, it can
take from 6 to 15 minutes. But there is nothing that can be done about it. Furthermore, the
labs that were deployed had a time limit of 3 hours, and it did happen that some of the
experiments were interrupted at the end of time interval
To prove the thesis under discussion several kind of tests, five in all, were conducted. All
18
selective changes in bandwidth and time delay affecting all other machines were
conducted. The other machines in experiments are going to be called source or test
machines. The Virtual Lab was accessed from all the machines but measures were taking
in some of them.
As already mentioned, bandwidth and time delays were affected in a controlled manner.
In some machines test to measure packet delays to a chosen external machine was
conducted in a similar manner to the test done in the control machine to compare the
values measured.
In the first experiment a selected group of 5 students which already have conducted a lab
were brought together to a facility at the PUCMM campus. They were to work at the
same time with the same lab, using the same network, and were connected through an
Untangle machine that was to be used to regulate the QoS for all the participants in
random manner. This was the Network Control Experiment.
19
At the same time www.speedtest.net was used to measure the effective bandwidth to
the router as well the ping connection time to the same.
The second experiment was concentrated on creating controlled delay time between the
machine accessing the lab and the virtual machines. To that end a single machine was
connected to an Untangle Machine where QOS was controlled and controlled delays were
set up. The delays were established using tools presented in all Linux distributions: tc
(traffic control) and netem (Network Emulator)
20
The third experiment was similar to the second one, but in this case only one machine
was a “real” one, the other ones were virtual machines. The test machines were two
Window machines and one Ubuntu distribution. The real machine was a Fedora 12
machine. Time delays were set on the test machines under stable and fixed bandwidth.
Once again www.speedtest.net was used. Untangle was the controlling machine. And tc
with netem was used to control time delay.
In the fourth experiment a network of virtual machines was created to be controlled by
a single Untangle machine that was connected to the real machine. In this way the control
machine served as router to the other machines in the experiment, and at the same time
could be verified that the delays affecting the test machines was not affecting the control
machine. All the experiments done so far were recreated in this test.
In the fifth and last experiment only two test machines were used, and they were two
Linux machines. The control machine was a real Fedora 12 machine. In this experiment
no Untangle machine was used as the independent variables, time delay and bandwidth,
were going to be controlled using tc together with netem and htb as a classful qdisc. And
this tool was used in one of the two linux machines.
In this last experiment was easier to have “blind” machines as part of the
methodology used. A blind machine was no affected by any induced disturbance while
the participant did not have any knowledge about this reality.
All experiments were designed creating an environment as stable as it could be
arranged so that results measured could be compared between them and, at the same time,
check if the results are independent of the environment created by the experiment in itself.
7.1 Experiment 1. Network Control Experiment: QoS control
In this first experiment where a selected group of students work in a
heterogeneous data center using a common router and a filter machine, an Untangle
21
After working for more than one hour and without their knowledge some restrictions
were imposed on the participants. Every fifteen minutes at first and later every ten
minutes the % of bandwidth was gradually reduced tills the subject started to feel some
discomfort. The results are summarized in table 1. This unique experiment was a
democratic one as only after all participants, being in part unaware of the bandwidth
manipulation, started to complain when the working conditions were unacceptable.
TABLE 1-BANDWIDTH CONTROL FOR A NETWORK
10/24/09
% Bw Bandwidth % Bw Bandwidth ping time
download download upload upload s-value
Mbs Mbs ms
90 0.33 90 0.08 229 5
80 0.19 80 0.07 234 6
70 0.13 70 0.07 222 7
60 0.12 60 0.03 245 7
40 0.07 40 0.03 213 8
[image:31.612.102.421.233.405.2]22
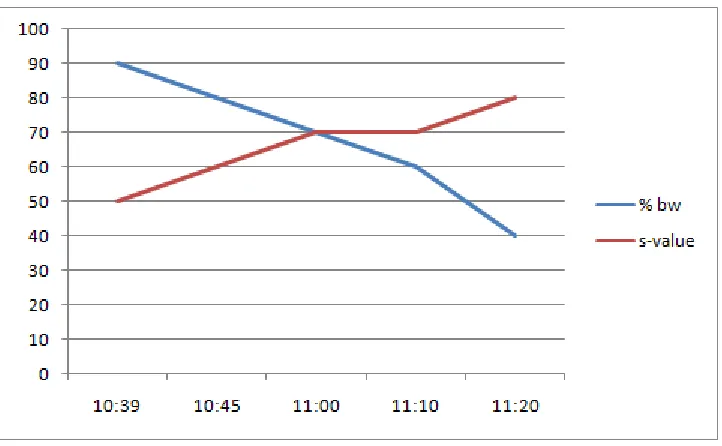
Figure 6 Bandwidth versus s-value
All the participants expressed their discomfort when bandwidth was reduced to 60% of
the original bandwidth: 512/128 kbps. S-values (subjective values) of 7 and up express
the discomfort felt by the participants when they noticed that they should pay more
attention to operations as the access was getting slower.
7.2 Experiment 2. Test Machine Experiments: detailed controls
To continue with the experiments and data recollection it was decided to use just one
test machine and one control, or filter, machine, which was, once again an Untangle
machine. This was the Test Machine Experiment and was divided into five parts:
Time Delay control experiment (experiment 2a)
QoS control experiment (experiment 2b)
Using test.net (experiment 2c)
23
Changing QoS values in test machine (experiment 2e)
The test machine has ip address: 10.0.10.40/24 and gateway 10.0.10.55 in the filter.
The interface is eth1. The test machine was a Fedora 12 machine.
FIGURE7.TESTANDFILTERMACHINE
The filter had two ip addresses: 10.0.10.55/24 with interface eth1 and 10.0.0.55/24 with
24
going to experience delay. The command route -n is self-explaining.
List 1 Using the route command
route -n
Kernel IP routing table
Destination Gateway Genmask Flags Metric Ref Use Iface
10.0.0.0 0.0.0.0 255.255.255. 0 U 1 0 0 eth1
10.0.10.0 0.0.0.0 255.255.255.0 U 0 0 0 eth3
192.168.122.0 0.0.0.0 255.255.255.0 U 0 0 0 virbr0
A shell script (script 1) was created to be used in the filter machine and in the source
machine to control and measure the difference in time between ping action to a machine
close to the Virtual manager. The machine chosen was determined by a traceroute
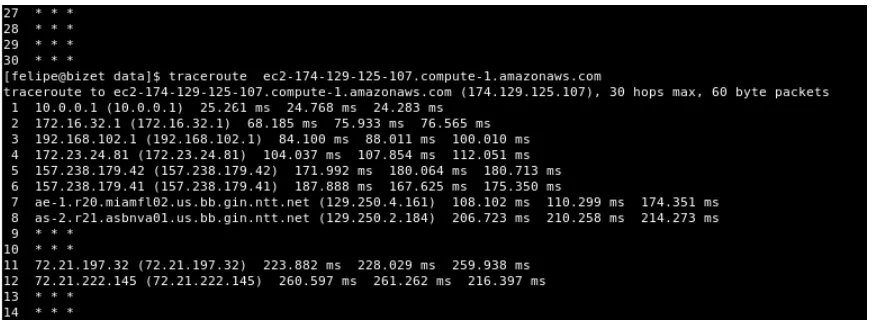
[image:34.612.109.545.425.588.2]command
Figure 8 Using the Traceroute command
As for the icmp protocol for machines in Amazonaws clouds were blocked the closest
machine ip to the target machine was selected as a common reference point for source
25 chosen.
It was assumed in these experiments that a constant route between source machine
and target virtual machine during any given session always exists, or better yet, it will be
assumed that the machine close to the target was, during the working session, always the
same. Both assertions showed not to hold all the time, but it does not change the validity
of the experiment.
26
The commands nt and netem were used every certain time period in the filter machine, increasing the delay every time. The time and command used were stored in a text file
7.2.1 Experiment 2a. Test Machine Experiment: time delay control
The goal of this experiment was to establish time delays over the packets going out of
the test machine. Time delays were set up over a time period of half an hour and values
included were100, 250 and 500 ms. To that end the tc command was the tool to make the
changes and time was registered together with the command and delay parameters. List 3
shows what was done.
List 2 Time delay control for test machine (2a)
Sat Nov 7 11:50:18 AST 2009 tc qdisc add dev eth1 root handle 1: netem delay 100ms
Sat Nov 7 12:07:00 AST 2009 tc qdisc change dev eth1 root handle 1: netem delay 250ms
Sat Nov 7 12:17:43 AST 2009 tc qdisc change dev eth1 root handle 1: netem delay 500ms
Sat Nov 7 12:22:13 AST 2009 tc qdisc del dev eth1 root handle 1:
At the same time the script exe_ping.sh was used to capture round trip delays in the
test and the filter machine, and table 2 was constructed with the data captured. The media
for the values captured is the product of the script dat_proc.rb. Although the expected
round trip delay time for the source (or test) machine did not increase the expected values
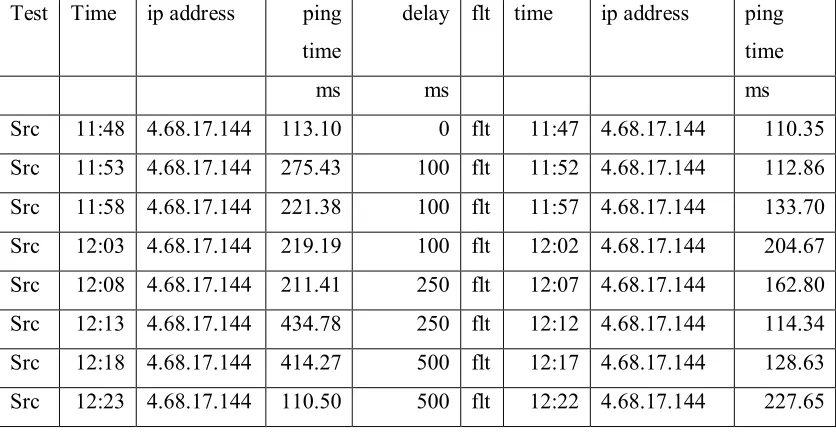
27
Table 2 Measuring time delay control
Test Time ip address ping
time
delay flt time ip address ping
time
ms ms ms
Src 11:48 4.68.17.144 113.10 0 flt 11:47 4.68.17.144 110.35
Src 11:53 4.68.17.144 275.43 100 flt 11:52 4.68.17.144 112.86
Src 11:58 4.68.17.144 221.38 100 flt 11:57 4.68.17.144 133.70
Src 12:03 4.68.17.144 219.19 100 flt 12:02 4.68.17.144 204.67
Src 12:08 4.68.17.144 211.41 250 flt 12:07 4.68.17.144 162.80
Src 12:13 4.68.17.144 434.78 250 flt 12:12 4.68.17.144 114.34
Src 12:18 4.68.17.144 414.27 500 flt 12:17 4.68.17.144 128.63
Src 12:23 4.68.17.144 110.50 500 flt 12:22 4.68.17.144 227.65
After the 250ms delay it was noticeable the effect in graphical interfaces and with the
greater delay value (500 ms) the effect was noticeable in text consoles.
[image:37.612.115.471.457.674.2]28
7.2.2 Experiment 2b Test Machine Experiment: Fixed upload control (95%)
This second test in the second experiment is similar to the first one as the same tools
there, especially tc and netem were used to induce time delays changing from 100 ms up
to 750 ms under almost an hour time period. The time delays induced for the test machine
are detailed in list 4. And like in test 1 in this experiment with two machines time delays
were recorder in table 3 and processed under the same time period using the same tools.
7.2.3 Experiment 2c. Test Machine Experiment: Using test.net
This third test is similar to the first experiment especially as the tool test.net found
inhttp://ww.speedtest.net was used, but this time we have only Untangle as the filter – or
control -machine and the test machine. Additionally capture and processing of round trip
delays in both machines using the scripts exe_ping.sh and dat_proc.rb. Table 4 was thus
produced under a ninety time period. And table 5 was constructed with the data produced
by test.net under the same time period.
Mixing the tables 4 and 5 the figure 11 is produced to show the linear relation between
discomfort values (s-values) and the delays measured in the test machine. A scale value
of 20 was used represent the almost linear relation between discomfort and delay. It is
worth mentioning that the bandwidth in the router is only 1500/384 Kbps, a little less than
29
Figure 11 Discomfort versus delay time
7.2.4 Experiment 2d Fixed bandwidth control, variable time delay.
But when there was an equal control imposed on both download and upload bandwidth,
there were some differences when accessing the virtual lab. First a fixed bandwidth
limitation to 60% download and 95% upload time delays in a range from 20ms to 500ms
were set up. The list of tc and parameters used is reflected in list 5.
To table 6 constructed with round trip delay data was added the time delay induced. The
effect in round trip delay for the test machine is noticeable but does not follow a clear
linear relation as expected in a disturb free environment.
Once again with the data produced by test.net under the same time period table 7 was
constructed. It was observed, this time, that discomfort was felt after an induced 200 ms
30
7.2.5 Experiment 2e Changing QoS values in test machine
In this test no changes were made in time delays for the test machine. The test was
limited to changing bandwidth. Table 8 present time delays captured and processed under
an eighty minutes time period. And table 9 is the data captured using test.net
Discomfort were noticed for any bandwidth, both in graphical interfaces and text
consoles, after bandwidth was reduced in 70% or more in upload and download equally.
But those differences could be explained by network own congestion at some of the
moments during the time this experiment was taking place. There was a little difference
of less than 7 ms between ping time obtained for test and filter machine
7.3 Experiment 3 QoS and time delay control
This phase in the experiments is a continuation of experiment 2 and consisted in
taking fixed values for QoS in each test and using tc and netem tools to change time
delays for the test machine.
The experiment was divided in four parts.
Fixed 40% QoS (test 3a)
Fixed 60% QoS (test 3b)
Fixed 50% QoS (test 3c)
In the first test bandwidth was fixed in 40% of the download bandwidth and 40%
for upload bandwidth. The first of the experiments suggested that 60% of the download
bandwidth was a critical value as was observed in the first part of the experiment. Delay
31
In the second test bandwidth was fixed in 60% of the download bandwidth and the same
percentage for both download and download bandwidth. Delay times changed in the filter
machine from 50 ms to 700 ms.
In the third test bandwidth was fixed in 50% of the download bandwidth and the same
percentage for both download and download bandwidth. Delay times changed in the filter
machine from 100 ms to 800 ms.
7.3.1 Experiment 3a QoS Control: 40% bandwidth control
Time delay was controlled using the tools tc and netem. The time table of their used was registered and notes were taken whenever some change in access to the virtual
machines was noticeable. Once again from 200ms and up some discomfort was
noticeable, and from 500ms the effect in text consoles was equally important.
In this first test a fixed bandwidth limitation to 40% download and 40% upload time
delays in a range from 50ms to 700ms were used as reflected in list 6. With the bash shell
script comparative round trip delays were taken from both the test machine and the filter
machine every 5 minutes and for every time delay. (Table 10)
For 100 ms time delays and up set up in the filter machine noticeable discomfort was
affecting work in the Virtual Machines ( especially when graphical environment was
present).Using www.speedtest.netTable 11 was created and the discomfort is associated
here with a bandwidth of 0.17 MBps.
For a scale factor of 1000 for the s-value figure 12 was drawn to illustrate the relation,
32
Figure 12 Discomfort versus ping time delay 40% bandwidth
But this ping time delay is a function of the delay time induced in the test machine.
7.3.2 Experiment 3b QoS Control: 60% bandwidth control
In a second experiment a fixed bandwidth limitation to 60% download and 60% upload
time delays in a range from 100ms to 700ms were set up as reflected in list 7.
Once again using the bash shell script comparative round trip delays were taken from
both the test machine and the filter machine every 5 minutes and for every time delay and
Table 12 was thus generated. Table 13 takes in to account results from www.speedtest.net
and the delay times from table 12. Discomfort can be felt for time delay of 200ms and up,
and for minimum bandwidth of 0.47MBps.
7.3.3 Experiment 3c QoS Control: 50% bandwidth control
In a third experiment a fixed bandwidth limitation to 50% download and 50% upload time
delays in a range from 50ms to 700ms were set up. Using the same tools were created
similar tables. List 8 is made with the time delay variations made under an hour time
33
Under the same time interval time delays were measured and the results are shown in
table 14. And finally the test.net was used to construct table 15 with the values measured.
Discomfort can be felt for time delay of 100ms and up, and for minimum bandwidth of
0.49MBps.
7.4 Experiment 4 Controlling the controller
The experiments in this period were conducted using , once again a network, but this time
of virtual machines, and one real machine, and its aim was to establish the same filters
used in the first experiments. The Untangle machine, the filter machine, was the one to
control bandwidth, but this time was not directly connected to the router, but was
connected instead to the real machine. The Untangle machine was controlled in time
delays by the real machine, acting as simple router, and with it all other virtual machines.
The experiment was divided in three parts:
i. bandwidth control
ii. 40% bandwidth and time delay control
iii. 60% bandwidth and time delay control
iv. time delay control
In the first part, where the only variable affected was bandwidth, using the filter
machine for the machines “behind” it bandwidth was reduced from a 100% value to a
minimum of 10% of the incoming and outgoing data under a two hours period.
In the second test, the router machine was used to establish delays for packets coming
in and out of the test machine in the network while a 40% of the bandwidth was
established for it. Time delays ranging from 50 ms up to 700 ms were used.
In the third test the router machine was used to establish delays for packets coming in
34
for it. Time delays ranging from 50 ms up to 700 ms were used.
In the fourth test with no changes in bandwidth access was established under changing
time delay conditions spanning values from 100 ms up to 800 ms.
7.4.1 Experiment 4a Bandwidth Control
With the help of www.speedtest.net table 16 with values measured in the routing
machine was constructed while access test were made. Although no major changes were
noticed in the table, except, for the bandwidth changes made in the filter machine, the
discomfort noticed was also written down.
When bandwidth for the tested machines was 60% of the original 0.5 Mbps, or below
that value some discomfort could be clearly felt. Time delay was measured and the result
is what table 17 shows.
7.4.2 Experiment 4b 40% bandwidth and time delay control
Under an hour time period changes were made in the real machine, using tc and netem
from a minimum time delay of 50 ms to a maximum of 700 ms having bandwidth
operating at 40% of the router bandwidth. The commands used to induce time delay
changes are reported in list 9.
The result from measuring external bandwidth and time delays is exposed in table 18,
where it can be observed that ping time changed from the normal 165ms to a value
increased with the double of the delay imposed. While data obtained from test.net was
used to construct table 19.
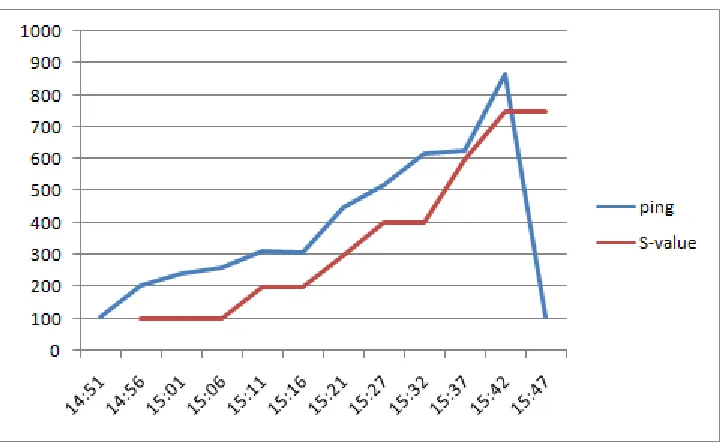
All the experiment result can be summarized in figure 13 where discomfort (s-value
with a scale value of 110 was used.
35
Figure 13 S-values versus ping time for experiment 4b
This part of the experiment was repeated as discomfort accessing the virtual machines
was felt as soon values greater than 100 ms were used to delay of packets send to and
from the test machines.
7.4.3 Experiment 4c 60% bandwidth and time delay control
In this part of the experiment a bandwidth constraint of 60% of the router access was
imposed in the test machines (05 mbp/0.375mbp) with time delays variations from 0 to
800 ms as reported in table 20.
Using tc at chosen time point, time delays were imposed in incoming and outgoing
packets as is reported in list 10, while table 21 reports measurements made in round trip
delay. There was no change in results obtained as compared with the other first parts of
36
7.4.4 Experiment 4d Time delay control
In this test using the same network configuration, no changes were made in
bandwidth, but just in time delays that went from 100 ms up to 600 ms. A simple
command was executed at variables time points under some 80 minutes time interval to
make changes in delay times. A table with the commands used and the time when they
were executed is presented in list 11.
With no bandwidth restrictions, once again could be verified, in table 22, that ping time
increased with the double of the value of the delay imposed. Table 23 was the result of
measuring ping time using test.net under the test.
The level of discomfort measured was the same felt when delays over 100 ms were
created. The moment 300 ms time delay was imposed there was some discomfort when
accessing Windows and Linux consoles.
7.5 Experiment 5 Numeric tools control.
The last of the experiments executed was a variation of the other ones, but this time use
of simple scripts that create the environment in the execution of netem is the fundamental
part and there was no recourse to Untangle machine.
Five scripts were created to initialize, to induce change in time delay, to induce change
in bandwidth, to induce change in both time delay and bandwidth and to destroy a queue
discipline.
The fundamental script was the one that initialized, and created the root for the queue
discipline and established interface to use, initial delay and bandwidth to use: tc_ini.sh
(script 3). The second script was the one to allow change in time delay for packets in a
queue discipline: tc_delay.sh (script 4). The third script was created to change bandwidth
37
changes in both time delay and bandwidth: tc_both.sh (script 6). And finally was the
[image:47.612.113.477.152.535.2]script that eliminated any of the queue disciplines created: tc_destroy.sh (script 7).
38
This experiment was developed in two stages. In the first part only changes in time
delays were considered. In the second part changes in time delays and bandwidths were
affected
7.5.1 Experiment 5a Time delay Control
As one done in other experiments with values collected by executing
www.speedtest.net table 24 was build to present changes in time delays obtained when
there were changes in in/out network traffic.
Twice under the experiment changes in the target machine for the delay imposed were
made, as external congestion changes in network were reflected in route changes, and this
is reflected in list 12 of commands used. As list 12 shows, time delays were changed from
100 ms up to 700 ms under almost an hour time period. Bandwidth for packets going out
from the test machine was constant.
As in all other experiments the media in time delays given by the ping command
executed every 5 minutes were collected in the source and the filter machine (table 25 and
table 26).
Using a scale value of 20 for s-values figure 14 was drawn from the s-values taken from
39
Figure 15 Experiment 5a: discomfort versus time delay
In this experiment discomfort was experienced the moment the access to the virtual
machines is subjected to an additional 100 ms time delay, but some time during the
practice it felt better to work under a time delay of 500 ms rather than with a time delay
of 400 ms especially when there changes in the network path. Network congestion could
be the source of this anomaly.
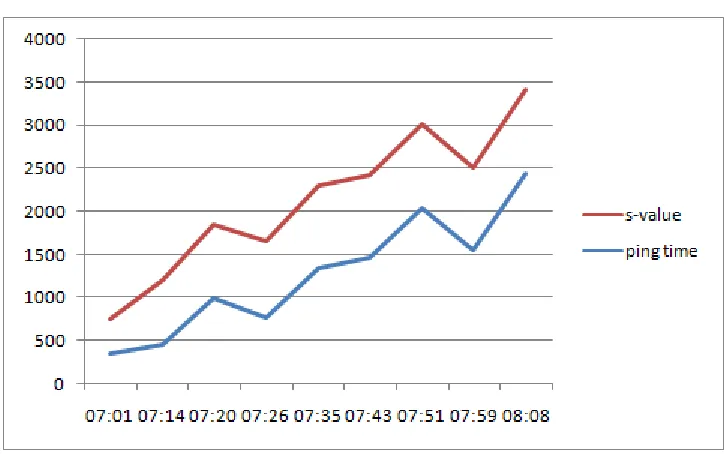
7.5.2 Experiment 5b Time delay and bandwidth Control
As a result of this two hours experiment the usual list (list 13) for collecting time
delays was created taking into consideration the time delay input as well as then
bandwidth caused by executing different scripts. In the other case changes were made to
affect the test machine. The initial command was: sh script/tc_ini.sh eth1 100 256
"10.0.10.65". Table 27 reports round trip delays measured, while, how and when the
40
In one case changes were made in the filter machine. And was usual in the other
experiments the ping tool was executed in both machines every five minutes to measure
the round trip time delay between the target machine, close the lab manager machine, and
either of the before mentioned machines (table 28)
8. Analysis and Results
As stated from the beginning, the work presented in this report is about how a real time
application in classical internet architecture does not secure that it “will receive the QoS
required in order to function properly” (Erol Gelenbe). Nevertheless the fact that the
increase in real time applications goes on, it is left for users of such services to understand
and know the limitations that can affect the use of the new technologies and what level of
time delay and bandwidth can be acceptable when using the new tools.
In all the experiments executed there were objective quantitative and qualitative data to
consider as well as subjective discomfort and its relation to the former values. In an ideal
experiment none of the values to be measured should have being affected for other factor
than the ones we were introducing in the experiments. But such was not, always, the case.
Although it is known the “effect on network performance due to degradation of traffic
variability and as a result of routing changes (Himabindu Pucha), it was decided to ignore
those effects as they were not affecting in a permanent and consistent way our hypothesis
and measurements.
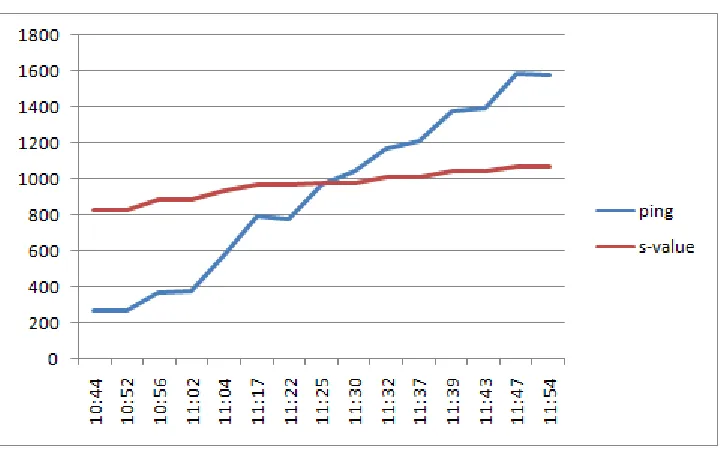
Taking for example table 19 in experiment 4a where time delays were induced in a test
machine from values ranging from 50 ms to 700 ms, the effect on the measured ping time
41
FIGURE 16TIME DELAY IN TEST MACHINE
What in the report is called pinging time, round-trip time, was produced from two distinct
sources: from http://www.speedtest.net and from the shell script (script 1). An though the
values thus obtained, when not affected by induced time delays, as was always the case
with the filter machine, should be close to each other, there were some differences that
can be explained not only by network congestion but by the methodologies used. The
shell script was used to produce results every 5 minutes with only 5 samples taken.
When time delay was an independent variable in any of the experiments executed
values produced by the tool tc (traffic control) of 200 ms (d1) and up always produced
some (subjective) discomfort when working in graphical environment. Values from 500
ms (d2) and up produced discomfort when working in a text console environment.
As pinging time, from the router to a machine close to the Lab Manager, was observed
to change from 105ms (p1) to 280ms (p2), it can be stated that a one way delay time of
372ms (t1) to the Lab Manager will produce discomfort in a graphical environment , and
672 ms (t2) will produce discomfort in a text console environment. The values (t1, t2)