Structure and kinetics in colloidal films with competing interactions
Mark D. Haw*
Department of Chemical and Process Engineering, University of Strathclyde, James Weir Building, 75 Montrose Street, Glasgow G1 1XJ, United Kingdom
(Received 20 November 2018; published 7 January 2019)
Using computer simulation we explore how two-dimensional systems of colloids with a combination of short-range attractive and long-short-range repulsive interactions generate complex structures and kinetics. Cooperative effects mean the attractive potential, despite being very short-ranged compared to the repulsion, can have significant effects on large-scale structure. By considering the number of particles occupying a notional “repulsion zone” defined by the repulsion length scale, we classify different characteristic structural regimes in which the combination of attraction and repulsion leads to different structural and kinetic outcomes, such as compact clustering, chain labyrinths, and coexisting clusters and chains. In some regimes small changes in repulsion range and/or area fraction can change timescales of structural evolution by many orders of magnitude.
DOI:10.1103/PhysRevE.99.012603
I. INTRODUCTION
Even simple interactions between colloidal particles can create surprisingly complex structures and kinetics, which is one reason for colloids’ ubiquity and versatility in applica-tions and their importance in generating new fundamental scientific insight, for example, in the physics of biological sys-tems [1]. Colloidal structures and how they evolve over time are key to functionality in products such as foods, cosmetics, paints, coatings, lubricants, porous media, membranes, and filters. Structure and heterogeneity also determine materials’ response to external forces in flow or under mechanical stress such as gravity. Hence such basic features of a product as the “shelf life” of a processed food or paint or the capture effi-ciency and selectivity of a porous filter are controlled funda-mentally by the interaction potential between the constituent particles. Moreover while the equilibrium state is related to the interaction potential through thermodynamics, many useful systems are not at equilibrium, for example, metastable mixtures of oils and water in foods and personal care products: thus the structures created on the system’s “journey” toward equilibrium, often different to those found at equilibrium, and how that journey can be interrupted, sometimes on very long timescales, i.e., the kinetics of structural change, are important factors. These kinetic aspects are even less straightforward to predict from the interaction potential.
It is well established that colloidal particles with purely attractive interactions can, depending on particle concentra-tion, attraction strength, and attraction range, follow a range of “routes to equilibrium” involving liquid-gas phase sepa-ration, growth of compact clusters, and formation of fractal aggregates and space-filling gels [2,3]. In many practical examples of colloidal systems there is a more complex par-ticle interaction composed of both attractive and repulsive contributions, at different length scales, and it remains less
clear how this combination of interactions controls structure and the kinetics of transit to equilibrium [4–10]. Generally, potentials featuring two length scales lead to complex mi-crophase (equilibrium) separation and structural “crossovers” (see Ref. [11] for a recent study and related references). For two-dimensional (2D) systems, much previous simulation and theoretical work has shown how short-range attraction com-bined with longer-range repulsion, and even pure repulsion exhibiting multiscale features such as a “shoulder” at short length scale, can generate a complex plethora of structures in and out of equilibrium, including stripes, chains, clusters, and ordered crystals [12–14]. Similar patterns are seen in experimental systems such as magnetic particles and biolog-ical membranes [6,15–17] and have been discussed in the general context of geometrically frustrated materials [18]. 2D systems are particularly interesting for applications such as structured membranes, filters, films, coatings, and biological materials.
MARK D. HAW PHYSICAL REVIEW E99, 012603 (2019)
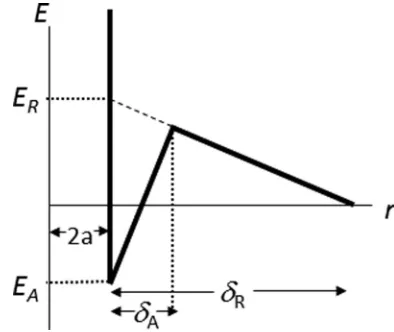
FIG. 1. Particle interaction potential as a function of the sepa-ration between particle centers,r, showing attraction and repulsion energiesEAandER, respectively, and hardcore repulsion at center
separationr=2awhereais the particle radius. Attraction rangeδA
and repulsion rangeδRare measured from the surface of the particle
so that two particles begin to repel when their center separation is
r=δR+2a.
and attraction between particles to change the structural path followed toward minimum energy.
II. METHODS
We use Monte Carlo simulations where a fixed area frac-tion of monodisperse circular disk particles of radius a, interacting through a potential U(r) (where r is the inter-particle center separation), diffuse in a square 2D box with periodic boundary conditions. For versatility of understanding the roles of attraction and repulsion, we employ a triangular piecewise potential. The particles have a hard-core repulsion forr <2ato prevent overlap, a triangular attractive potential with range δA and depth EA (EA is the potential at center separation r =2a), and a longer-range triangular repulsive potential with rangeδR. For convenience in the description of parameters here, we quantify the repulsion strengthER using what would be its effective value atr=2ain the absence of attraction, as shown in Fig.1. Random-walk particle moves are selected from Gaussian distributions in dimensions x
andy and accepted with probabilityP =exp(−E) where E is the change in potential energy of the particle due to interactions with its neighbors associated with the proposed move. Particles therefore execute Brownian random walks within the interaction potential of their neighbors. We have checked that structures observed are insensitive to the mean step length used as long as this step length is a small fraction of the shortest range interaction (the attraction, in this case). Simulations are started from “fluid” configurations that are equilibrated by running the simulation with only hard-core repulsion (equivalent to high temperature) for a large number of steps until the measured pair correlation functiong(r) has reached a steady state, and thereafter immediately quenched to the required values of the energy parameters. In most data presented, the number of particles isN=1000 although we have checked for finite size effects usingN =4000 in some
cases, finding no change in results. The system box size in units of particle radius is determined by the required area frac-tion. Hereafter, for conciseness all parameters and results are quoted in appropriate reduced units: lengths (including interaction potential length scales) are given in units of the particle radiusa, and energies are given in units of the thermal energy scalekBT wherekBis Boltzmann’s constant andT the temperature. SincekBT is the typical scale of thermal fluctua-tion of a particle’s kinetic energy, scaling interacfluctua-tion energies in this way allows a sense of how thermal fluctuation, which drives transit to equilibrium, competes with the interparticle interactions. Setting the interaction energy scale is thus equiv-alent to setting the inverse temperature. The mean step length of the particles’ Brownian walk determines the timescale: for the value used here and a total run time of 107 time steps
(attempted moves per particle), for example, particles diffuse a distance (in units of a) similar to that which an isolated 1μm diameter colloid in water at room temperature would diffuse in 1 s, equivalent to a small multiple of the particle radiusa. While particles therefore do not diffuse far over the reported run times, the area fractions and interaction ranges considered here mean that characteristic structures are formed quickly, i.e., without substantial particle diffusion. This has implications for whether systems reach thermodynamic equi-librium: as results will show and as discussed below, most systems are trapped by the strong cooperative interactions in nonequilibrium structures that evolve very slowly.
III. RESULTS
In the present work, we focus on the roles ofδR,, and
EA, maintaining a constant attraction rangeδA=0.05 and a constant repulsion energy (at zero separation)ER =45. Thus we focus here on strongly repulsive systems, although as we shall see the attractive part of the interaction turns out to have significant effects despite its short length scale. When repulsive interactions are dominant, we expect particles to disperse individually so as to minimize global repulsion. But this is possible only as long as the combination of area fraction and repulsion rangeδRgives space enough for all individual particles to separate beyondδR. The boundary of this single-particle dispersed phase, in terms of repulsion range and area fraction, can be estimated by assuming that repulsion drives the suspension to separate into groups of particles occupying “repulsion zones” of radius 1+δR/2 (in units of particle radius). At area fraction , the average number of particles contained in each such zone isnb=(1+δR/2)2. Fornb 1 there is space for monomers to minimize repulsion by occupying separate zones, remaining individually dispersed. Atnb>1 repulsion zones must contain multiple particles and the configuration of particles that would minimize free energy (in equilibrium) or indeed nonequilibrium configurations that may appear and evolve as the system journeys toward equil-brium are less clear. As we will seenbis a useful parameter to categorize and contrast structure and the kinetics of evolution toward equilibrium under different conditions.
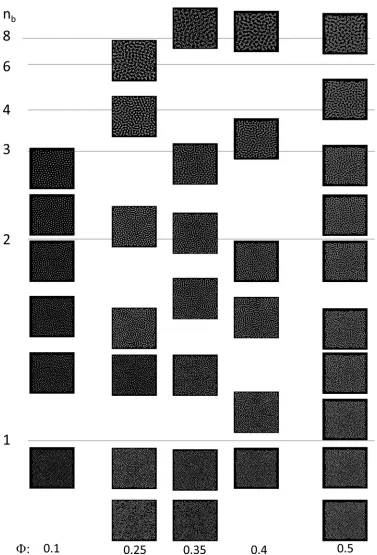
In Fig. 2we plot snapshots of the particle configurations in a “phase diagram” of nb versus at a fixed value of
FIG. 2. Simulation snapshots att=106 time steps andE
A= −7 showing dependence of structure on area fractionand number of
particles per “repulsion zone,”nb(see text). Particles are plotted as disks with radiusa.
can be seen the boundary nb 1 predicts reasonably well the limit of the single-particle dispersed phase: typically, just below nb=1, snapshots show systems mostly dispersed as single particles, with a small population of dimers and trimers. Oncenb is somewhat larger than 1, particles can no longer minimize repulsion by individually separating to interparticle distances greater thanδRand must “choose” another structural strategy. For example, some particles might group closer to
MARK D. HAW PHYSICAL REVIEW E99, 012603 (2019)
FIG. 3. (a) Pair correlation functiong(r) (withr scaled by the particle radiusa) for example simulations att=106time steps, with =0.35, EA= −7 and a range ofδrvalues. (b)g(r) vs the particle surfaceseparationr−2ascaled byδR. Dashed lines show data for
nb1. Systems withnb1 feature a strong peak at (r−2a)/δR=
1 (dotted vertical line).
of the systems.) Plotting the pair correlation function g(r) versus the particle surface separation (r−2) scaled by δR [Fig.3(b)] produces a strong peak at (r−2)/δR=1 for all cases above nb 1. Hence for nb1 the repulsion range
δR sets the dominant “interstructural” length scale, i.e., the separation between chains, groups, etc., while for nb<1 particles have enough space to separate at distances greater than the repulsion range, so thatδR is less of a determining scale.
In fact, such order characterized by δR occurs with or without short-range attraction (at this high value of ER at least), showing that ordered structures such as chains, groups, and stripes do not require an attractive interaction and are simply driven by repulsion [13]. The repulsive interaction drives separation into characteristic structural units separated by length scale δR. The strong repulsive interactions mean that individual groups are relatively stable, i.e., there is only slow “swapping” of particles between groups (see below for further examination of the role of thermal aging). We shall see, however, that the attractive part of the interaction can have significant effects on the structural details at both long and short length scales and on the time evolution of the system.
As demonstrated by Fig. 2 the type of structural unit formed depends on how many particles must occupy the repulsion zone, i.e., nb. First, we discuss behavior at large
[image:4.608.312.557.69.440.2]nb1. Structures here are typified by groups of particles, groups being dispersed and roughly ordered on theδR length scale (Fig.4). One can think of this as an effective rescaling: instead of dispersed, ordered single particles at nb 1, at largenbfree energy is minimized by separation into dispersed, ordered larger groups of particles. Locally, particles within each group repel each other, but globally the separation from neighboring groups means an overall reduction in free energy. Being short-ranged, the attractive part of the potential does not affect the intergroup length scale, but it does change the local group structure, the way the groups “connect” to each other, and the kinetics of structural evolution (compare the different attraction strength examples in Fig.4). Strong attraction [Figs.4(a)and4(b)] leads to more disordered group shapes and, at early enough times, more chainlike structure,
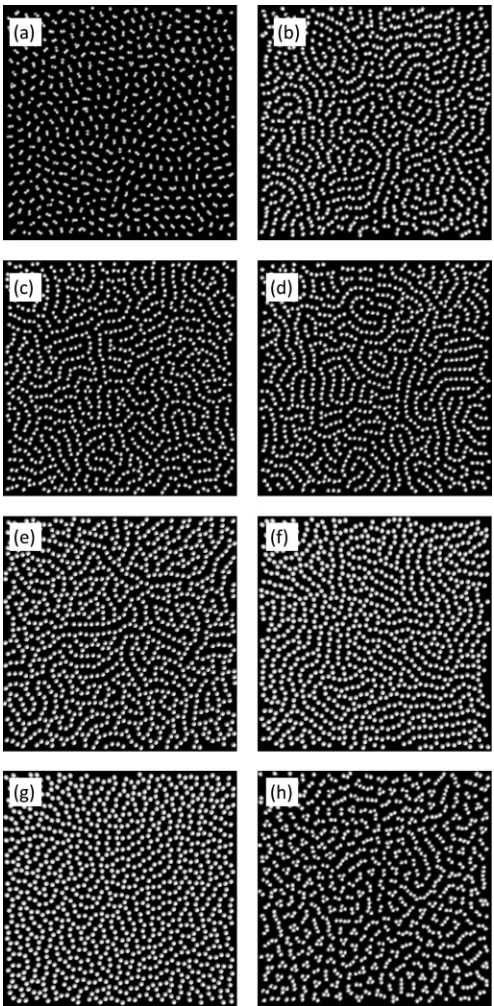
FIG. 4. Snapshots from simulations for=0.35 andδR=8.0,
for t=106 (left column) and t=107 (right column) time steps, contrasting the role of attraction energy EA: (a, b)EA= −7; (c,
d) EA=41; (e, f)EA=45, i.e.,EA=ER implying no attractive
“well” in the interparticle potential.
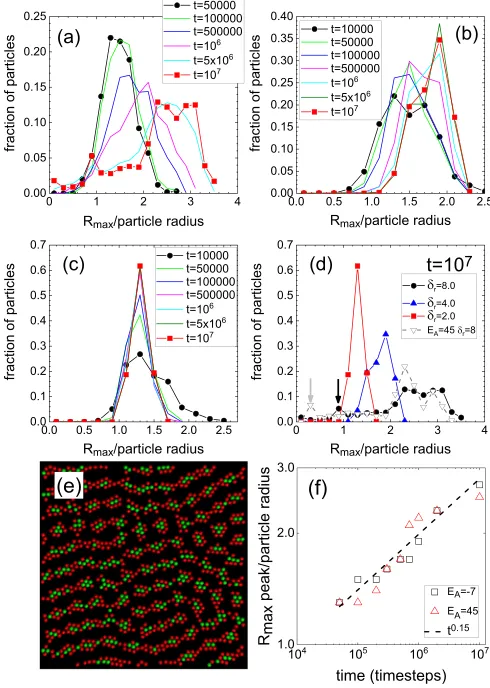
[image:4.608.50.299.70.204.2]FIG. 5. Distributions of the distance to the most distant point in a particle’s Voronoi cell,Rmax, from simulations with=0.35, EA= −7 at (a)δR=8.0 (nb =8.75); (b)δR=4.0 (nb=3.15); (c)δR=
2.0 (nb=1.4); (d) late-time (t=107 time steps) distributions at
differentδR, and, for comparison, the distribution forδR=8.0 and
EA=45; (e) example simulation snapshot (δR=8.0,EA=45,t=
107) with particles withR
max<1.5 in green,Rmax1.5 in red; (f)
time dependence of the length scale indicated by the large-distance peak in theRmax distribution forδR=8.0, for bothEA= −7 and
EA=45. The dashed line illustrates a power law with exponent of
0.15.
distribution at a given size indicate significant populations of voids of that size. The presence of multiple peaks indicates that there is more than one characteristic “environment” for particles in the system, in other words there are regions with different local void geometries and interparticle structures, such as particles inside and particles at the surface of groups.
At nb 1 [e.g., δR =8, =0.35 giving nb =8.75; Fig.5(a)] an early-time broad peak in theRmax distribution transforms into a peak traveling to largerRmax, demonstrating the growth of large intergroup voids of a characteristic size, and a small peak at low Rmax, corresponding to particles inside compact groups. Plotting the position of the largeRmax peak over time for different values ofEA[Fig.5(f)] reveals power law kinetics of group separation (void growth) with an exponent (∼=0.15) independent ofEA. In other words atnb 1 the structure evolves toward a state of quasiordered groups at all EA, driven by growth of voids whose characteristic
FIG. 6. (a–c) Simulation snapshots for =0.35 and δR=
4.0 (nb=3.15) at t=107 time steps. Particles withRmax < RM
are plotted in green, particles withRmaxRM in red, whereRM is
selected to divide theRmaxdistributions (see panel d) into two halves.
(a) EA= −7, RM=1.7; (b) EA=41, RM =1.7; (c) EA=45,
RM=1.4. (d) Late-time (t=107time steps)Rmax distributions at
the differentEAcorresponding to the snapshots in panels (a) to (c).
size obeys anEA-independent growth law. At largenb phase separation into voids and clusters is therefore dominated and driven by repulsion (at least at the relatively strong repulsion studied,ER =45). Nevertheless the details of theRmax distri-bution and hence the finer details of structure do still depend onEA. Interestingly, the low-Rmaxpeak at late time [arrows in Fig.5(d)] is at significantly smaller length scale forEA=45 compared to EA= −7. At first sight this implies, perhaps surprisingly, that local structure inside groups of particles seems more compact at weaker attraction. Further study of the detailed local structure will be reported elsewhere, but for now we point out that increased regularity, rather than compactivity, of the local structure inside a group will tend to reduceRmax, while particle aggregation at stronger attraction will tend to produce a more irregular structure with larger spaces and hence largerRmax, since stronger attraction makes local restructuring more difficult.
[image:5.608.47.292.75.419.2]MARK D. HAW PHYSICAL REVIEW E99, 012603 (2019)
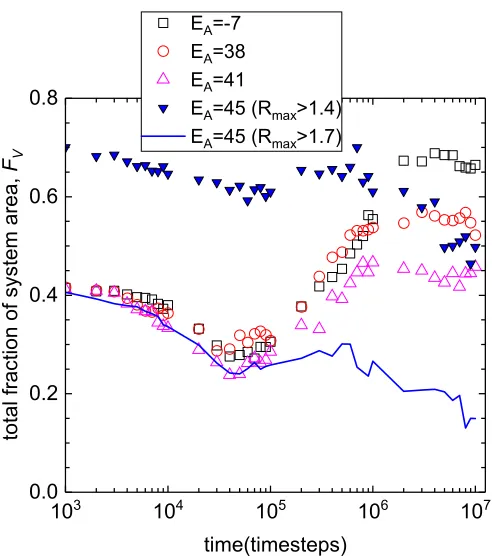
FIG. 7. Time dependence ofFV, the fraction of the system area
occupied by particles adjacent to “large” voids, i.e., particles with
RmaxRM, for=0.35 andδR=4.0 (nb =3.15) at variousEA.
For EA= −7,38 and 41 we use RM =1.7, while for EA=45,
RM=1.4, corresponding to the snapshots in Fig.6. ForEA=45
we also showRM=1.7 (the solid line) for comparison.
particles in the still disordered and short aligned chain part of the system have higherRmaxas shown by the different colors in Fig.6. When the number of particles that must be fitted into the local repulsion zone nb≈3, the possible structural responses are evidently more complex.
The kinetics of structural evolution in such a coarsening system can be tracked over time by computingFV, the fraction of system area occupied by particles in the largeRmaxregions i.e., particles with values ofRmaxabove a characteristic value
RM distinguishing the two coexisting regions. We compute
FV simply by adding the Voronoi cell areas of particles with
Rmax RM (Fig.7). RM is chosen to split theRmax distri-bution approximately evenly and most clearly separate the system into different characteristic structures above and below
RM, as demonstrated by the snapshots in Fig. 6. As shown for one example in Fig.7changingRM shifts theFV data in absolute terms but does not change the form of the temporal dependence. For allEAthe total area of the disordered large void phaseFV initially decreases before, at similar time for all
EA, beginning to rise. However, without attraction (EA=45)
FV subsequently decreases again and is still decreasing at the longest run times we reach: the area occupied by crystallites of lamellae-arranged ordered units, associated with lowRmax, continues to fill an increasing fraction of the system over time. In contrast, with increased attraction strength, after the initial decreaseFV continues to increase to a maximum at an
EA-dependent value: largeRmax (void) regions form and fill an increasing fraction of the system up to a limit that depends
on the strength of attraction. Having reached this limit the void regions persist, the structure showing no evidence of approaching back to the no-attraction case. At intermediate
nb it seems therefore that attraction enables generation and freezing of larger voids into the system, leaving a long-lasting structure different from the no-attraction case. Even a weak attraction ofEA=41 (i.e.,ER−EA=4kBT) is enough both to significantly change the structure and to maintain this change against thermal restructuring [Fig.6(b)].
Given that the attractive interaction is very short-ranged compared to the scale of voids it is surprising that it should have such large-scale effects. We propose that this is due to a cooperative effect of repulsion and attraction that evidently becomes important for intermediate nb. Repulsion, being long-ranged, drives the separation of the system, generating largeRmax voids. However during this process, the particles bordering these voids form chains. These chains, and thus the large void regions, are stabilized by the combination of repulsion (chains aligning approximately parallel to minimize repulsion) and attraction (holding neighbors in the chains to-gether against local fluctuations that would otherwise convert short chains to small compact units) [14]. The result is a coexistence of zones of short aligned chains and zones of small compact groups as seen in Figs.6(a)and6(b). At zero attraction (EA=ER), however, chains are not maintained by attraction between neighbors, and thus there is no interchain repulsion to stabilise the large-void fraction of the system. At intermediatenb, therefore, competition between different structural processes leads to complex long-lasting structural differences at different attraction strength.
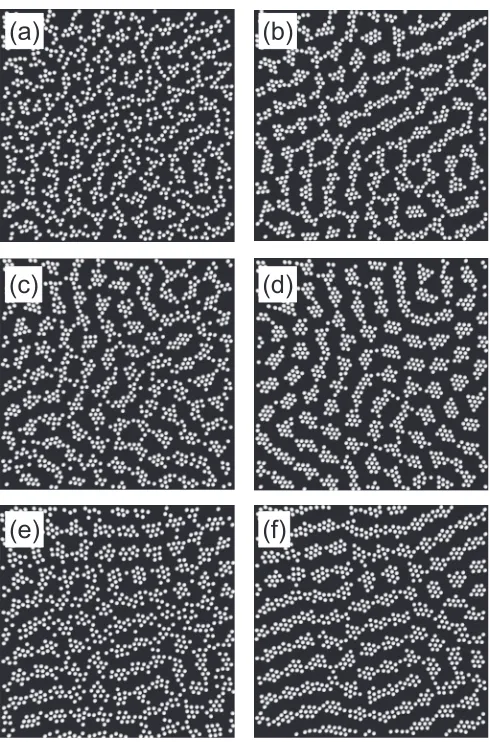
For 1.0< nb2.0 a distinctly different characteris-tic structure is observed, the so-called “chain labyrinth” (Fig.8). Here theRmax distribution is sharply single-peaked [Fig.5(c)]: almost all particles are in tightly intertwined cor-related chains and hence at the edge of large voids. Figure8(a) shows that effective “labyrinths” still form even at low particle concentration: the chains of the labyrinth are shorter, even reduced to dimers and trimers, but their mutual repulsion still leads to an interwoven labyrinthine arrangement. Fornb between 1 and 2, 2 particles occupy a typical repulsion zone and by definition will form a dimer with a defined axis. When repulsion is long-ranged enough, a particle approaching such an existing dimer feels minimum repulsion approaching along the axis of the chain compared to perpendicular, so that any growth will tend to promote chains. Meanwhile mini-mization of repulsion between different neighboring chains will encourage local parallel alignment of growing chains. Hence free energy will be reduced by the formation of chains [14].
FIG. 8. Simulation snapshots showing chain labyrinth structure att=106 time steps (a–d) andt=5×10⁶ time steps (e–h) for a range of and energy parameters as follows: (a) =0.1,
EA= −7, δR=6.0 (nb=1.6); (b) =0.25, EA= −7, δR=
3.0 (nb=1.56); (c) =0.35, EA= −7, δR=2.5 (nb=1.77);
(d)=0.4, EA= −7, δR=2.0 (nb=1.6); (e) =0.5, EA= −7, δR=2.0 (nb=2.0). (f) =0.5, EA=41, δR=2.0 (nb=
2.0); (g) =0.5, EA=45, δR=2.0 (nb=2.0); (h) =0.25,
EA= −7, δR=4.0 (nb=2.25), showing onset of coexistence of
chains and small compact groups.
Asnb is increased beyond2 the chain labyrinth begins to give way to mixtures of chains and small groups such as triplets [Fig.8(h)]. As more than two particles (on aver-age) need to occupy the repulsion zone in order to achieve
separation at the δR length scale, we therefore expect a mixture of zones containing triplets (localnb =3) and zones containing chains (localnb=2).
An important question for design of functional materials that are not at thermodynamic equilibrium (see below for further discussion) is the kinetic stability or otherwise of dif-ferent structures. We examine structural conversion between monomers, chains and more compact structures by identifying particles as belonging to chains or compact groups as follows. A chain particle will have at least two neighbors (particles within some cutoff distance) but, crucially, to qualify as a chain particle these neighbors must not be neighbors of each other. (Here we use a cutoff distance of 0.5a to define neighbors: we have checked that results are insensitive to this as long as it is not too large, i.e., does not approach the repulsion range. Note that such neighbors in chains are not therefore necessarily bonded by attractive interactions: we seek a general structural analysis that can be applied even for zero attraction, important because we know that chains form even with zero attraction.) Particles at the end of chains, which have only one neighbor, are also identified as chain particles if that neighbor is itself a chain particle. Conversely we define a group particle as having at least two neighbors which are also neighbors of each other. Finally there are also particles with no neighbors within the cutoff distance, i.e., monomers. Inspection of snapshots (see the inset to Fig.9for an example) is used to validate that this method successfully distinguishes between chains, groups, and monomers.
The temporal behavior of the fractions of particles in chain and group configurations (Fig.9) demonstrates that in the chain labyrinth regime (1.0< nb2.0) conversion from chain to group is very slow, the growth of the group fraction being approximately logarithmic in time. Chain labyrinths persist for long times. Even though coarsening would nor-mally be seen as a local process depending on the short-range interaction of two particles, with an Arrhenius-type characteristic rate determined simply by the attractive inter-action, because the particles are assembled into chains and neighboring chains are strongly correlated at the significantly larger length scaleδR by the repulsion, coarsening, e.g., into groups requires not just breaking local attractive bonds but overcoming the repulsion of neighboring parallel chains: a much more energetically costly disturbance in the local energy balance.
Figure 9 shows that there is a “maximum chain” state at a particular nb=nmax where the fraction of particles in groups and monomers is minimized. In Fig.9,=0.35, for example, this occurs aroundnmax≈1.4. For nb below this, we see chain-monomer coexistence. The observed monomers tend to be grouped in lines akin to chains: these monomers are the “remnants” of the ordered single-particle dispersed phase. Asnbincreases abovenmaxthe population of particles in groups increases, until bynb 2.0 significant numbers of particles exist in groups rather than chains.
MARK D. HAW PHYSICAL REVIEW E99, 012603 (2019)
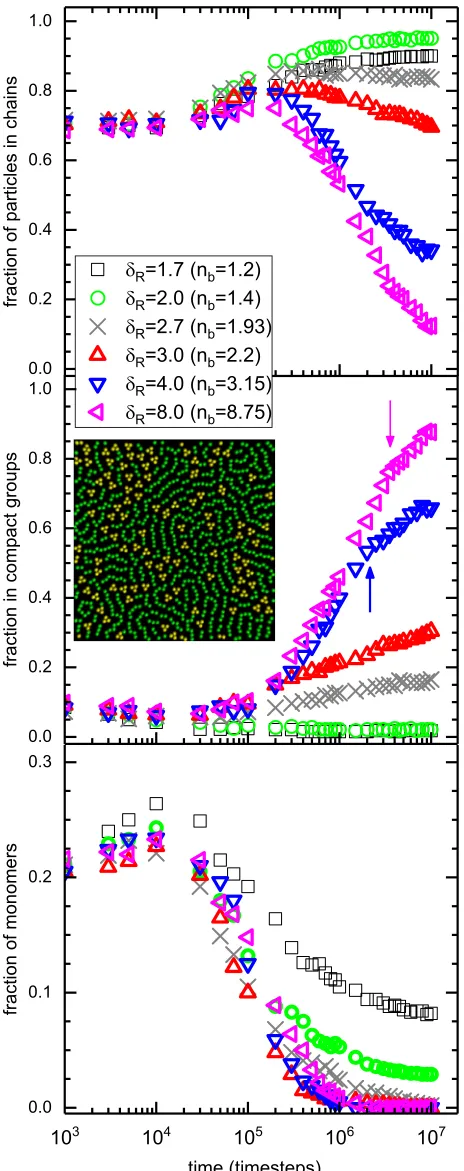
FIG. 9. Fraction of particles belonging to chains (top), compact groups (middle), and fraction of monomers (bottom), for=0.35,
EA= −7, and variousδR(nb). The inset to the middle plot shows an
example snapshot (=0.35,EA= −7,δR=3.0,nb=2.2) att=
107 time steps, with particles belonging to chains plotted in green, particles in groups in yellow. Arrows in the middle plot indicate change in growth of fraction in compact groups, as discussed in the text.
Fig.9(a)shows that the majority of particles exist in chains. Thermal conversion over time from chains to more stable triplets and larger groups occurs at a rate that increases asnb increases fromnmax. At largenb the rate of conversion also reduces at later time [see arrows in Fig. 9(b)for nb=3.15 and nb =8.75]. This switch in growth rate coincides with when FV, the fraction of system area contributing to large voids, reaches its maximum value (Fig. 7). The increase in
FV indicates growth of large voids between chains or groups as particles seek reduced energy states:FV reaches a constant as this route to reducing repulsion energy by maximizing separation reaches a limit when there is no further space to create large voids. According to Fig. 9(b), local chain-to-group reconfiguration continues after this time, representing a secondary route to further minimizing energy but with a different (slower) characteristic timescale.
The magnitude of restructuring rate is highly dependent on nb: for example, from Fig. 9 at nb=3.15 (δR =4) the fraction of particles in groups reaches 0.5 in around 106time
steps. If we extrapolate from the logarithmic trends at nb= 2.18(δR=3.0) andnb=1.93(δR=2.7) we find equivalent characteristic times of 109 steps and 1014 steps, respectively.
This indicates a very significant dependence on small changes innb. For a real material where one simulation time unit is around 10−7s, e.g., such as the example mentioned above of a
film of1μm colloids, a reduction in repulsion length scale fromδR=4 toδR=2.7 therefore generates an increase in the characteristic time for structural evolution from a fraction of a second to hundreds of days. Such a huge change in timescale indicates a strongly cooperative effect not simply related to the interaction between two isolated particles: indeed, logarithmic scaling in time is often associated with aging in complex energy landscapes such as labyrinths and glasses [5,19,20]. Such a sensitivity of timescale magnitude to system properties indicates a valuable control variable in the design of func-tional materials.
IV. CONCLUSIONS
We have explored the complex interplay between short-range attraction and long-short-range repulsion, focusing here on relatively strong repulsion, demonstrating effects on structure and kinetics that vary significantly depending onEA,δR, and . The effect of the repulsion is to drive separation of particles into “repulsion zones” of length scaleδR. The average number of particles that, by mass conservation, must nominally oc-cupy each zone,nb, combines the effects of repulsion length scale and particle area fraction and is a useful parameter to categorize structural and kinetic behavior. Ordered single-particle systems give way, asnb increases above 1, to chains driven and stabilized by repulsion, and the formation of a chain labyrinth. The formation of this labyrinth occurs at all
[image:8.608.56.288.70.656.2]sign of thermal coarsening. Finally at largenb 1 the system is dominated by repulsion, ultimately separating into layered or ordered compact groups. Short-length-scale structure and coarsening depend onEAbut systems show similar power-law long-length-scale coarsening kinetics at allEA.
Our results deepen our knowledge of the role of com-bined short-range attraction and long-range repulsion and the consequences of “frustrated” systems, demonstrating that an exceptionally rich range of out-of-equilibrium structures and mixed systems can be obtained and their aging toward equilibrium controlled. With recent developments in tuneable colloid chemistry such as “patchy” colloids, star copoly-mers, and so on, alongside tuneable interactions (strength and range, repulsive and attractive) from charge stabiliza-tion, magnetic interactions, and depletion attractions, results from this simple model potentially provide a road map for
design of films and membranes with complex porous struc-ture and aging properties at the colloidal length scale. That such rich behavior can arise from such a simple interaction underlines such materials’ potential for novel and versatile functionality.
Here we have considered a relatively strong repulsion
ER =45 and focused on the roles ofandδR, showing how these two parameters combine innb, and ofEA, exploring how attraction influences structure and kinetics in different regimes of nb. Further work extending to higher , and varying the repulsion strengthERto providing a further tuning parameter to shift the balance between attraction and repulsion, is in progress and will be described elsewhere.
All data underpinning this publication are openly available from the University of Strathclyde KnowledgeBase [21].
[1] J. C. Berg,An Introduction to Interfaces and Colloids(World Scientific, Singapore, 2009).
[2] H. N. W. Lekkerkerker and R. Tuinier,Colloids and the Deple-tion InteracDeple-tion(Springer, Dordrecht, 2011).
[3] J. Sabin, A. E. Bailey, and B. J. Frisken,Soft Matter12,5325
(2016).
[4] A. D. Dinsmore, P. L. Dubin, and G. M. Grason,J. Phys. Chem. B115,7173(2011).
[5] Y. Zhuang and P. Charbonneau,J. Chem. Phys.147, 091102
(2017).
[6] S. Merminod, T. Jamin, E. Falcon, and M. Berhanu,Phys. Rev. E92,062205(2015).
[7] C. L. Klix, C. P. Royall, and H. Tanaka,Phys. Rev. Lett.104,
165702(2010).
[8] M. B. Sweatman and L. Lue, J. Chem. Phys. 144, 171102
(2016).
[9] S. V. Buldyrev, G. Malescio, C. A. Angell, N. Giovambattista, S. Prestipino, F. Saija, H. E. Stanley, and L. Xu, J. Phys.: Condens. Matter21,504106(2009).
[10] A. B. de Oliveira, P. A. Netz, and M. C. Barbosa,Europhys. Lett.85,36001(2009).
[11] M. C. Walters, P. Subramanian, A. J. Archer, and R. Evans,
Phys. Rev. E98,012606(2018).
[12] P. J. Camp,Phys. Rev. E71,031507(2005).
[13] G. Malescio and G. Pellicane,Phys. Rev. E70,021202(2004). [14] M. D. Haw,Phys. Rev. E81,031402(2010).
[15] A. T. Pham, Y. Zhuang, P. Detwiler, J. E. S. Socolar, P. Charbonneau, and B. B. Yellen, Phys. Rev. E 95, 052607
(2017).
[16] L. K. Tamm, editor, Protein-Lipid Interactions: From Mem-brane Domains to Cellular Networks(Wiley-VCH, Weinheim, Germany, 2005).
[17] N. Osterman, D. Babic, I. Poberaj, J. Dobnikar, and P. Ziherl,
Phys. Rev. Lett.99,248301(2007).
[18] Y. Shokef and T. C. Lubensky, Phys. Rev. Lett.102,048303
(2009).
[19] B. Reimann, R. Richter, and I. Rehberg, Phys. Rev. E 65,
031504(2002).
[20] F. Krzyzewski and M. A. Zaluska-Kotur, Phys. Rev. E 77,
031502(2008).