International Journal of Innovative Technology and Exploring Engineering (IJITEE) ISSN: 2278-3075, Volume-9 Issue-1, November 2019
Abstract: Deep learning (DL) as well as feature learning by unsupervised methods have made tremendous consideration in the past decades because of its great and dynamic capacity to change input data into high level depictions by means of various machine learning (ML) methods and approaches. Therefore these interests have also showed a fast and steady growth in the arena of medical image analysis, especially in Diabetic Retinopathy (DR) classification. On contradiction, manual interpretation involves excessive processing time, large amount of expertise and work. Sternness of the DR is analyzed relative to the existence of Microaneurysms (MAs), Exudates (EXs) and Hemorrhages(HEs). Spotting of DR in its early stage is crucial and important to avoid blindness. This paper proposes an algorithm to build an automated system to extract the above mentioned DR features which are the elemental and initial signs of diabetic retinopathy. Initial step in this algorithm is preprocessing of the original image. The next step in this features extraction algorithms is elimination of optic disc (OD) and blood vessels which have similar characteristic with these features. Blood vessels are segmented using Multi-Level Adaptive Thresholding. OD is segmented using morphological operations. Feature extraction and classification is achieved by using deep Bag of Feature (BoF) model which uses Speeded Up Robust Features Our method achieved 100% acuuracy in DRIVE database and over 90% accuracy for e-OPTHA database. Thus, the proposed methodology represents a track towards precise and highly automated DR diagnosis on a large substantial scale along with better sensitivity and specificity.
Index Terms: Bag of Feature model, microaneurysms, Diabetic Retinopathy, haemorrhages and exudates.
I. INTRODUCTION
Diabetes mellitus is a common diseases and it occurs in one of the 2 forms- Type 1 &Type 2. This disease results in generalized micro and macro vascular complications. Micro vascular complications due to microangeopathy is directly associated to glycaemic control and it affects eyes, peripheral nerves and kidneys.
Retinal changes occurs in patients with diabetes mellitus and are referred to as DR. In the developed world, due to change in life style, the incidence of DR has increased. It is one of the foremost reasons of vision loss among working age group in the present world scenario.
Certain risk factors are there which are known to play a vivacious role in the development of DR even though the exact causal factors have not been identified clearly. Poor
Revised Manuscript Received on November 05, 2019.
Anil Kumar K.R, Department of Electronics and Communication Engineering, NSS College of Engineering, Palakkad, Kerala, India. Research Scholar, University of Calicut, Kerala, India.
Noushira K.I, PG Scholar, Department of Electronics and Communication Engineering, NSS College of Engineering, Palakkad, Kerala, India.
Meenakshy K, Department of Electrical and Electronics Engineering, Government Engineering College, Thrissur, Kerala, India..
control of diabetes often lead to an earlier onset of DR and fast progression of previously controlled retinopathy. With the increase in duration the patients has had diabetes, frequency of incidence of DR increases, even though the general disease is mild or well controlled.
DR is a long-lasting progressive disease and it ranges from mild to moderate and austere non proliferative forms. Mild form of DR is identified by the existence of a few MAs, Moderate form is categorized by the presence of a few HEs, hard EXs, and severe form can be identified by the presence of these entities in a greater amount .
Ophthalmoscopically, the earliest changes of DR characteristically show the changes that occur in smaller blood vessels. Small dot and blot hemorrhages are common, degeneration of vessel walls which leads to microaneurysms appear as round minute dots occasionally arranged like clusters of grapes at the ends of vascular twigs. These are earliest sign of background diabetic retinopathy. Oedema appear as bright yellow, waxy looking patches of exudates in varying size and shape and location having well defined borders, which is the accumulation of oozed fatty material produced from protein and lipids in retina.
In majority of diabetes mellitus patients DR develops within a time period of 15 years. Risk of DR mainly increases with the duration of diabetes, smoking and hypertension. Diabetic patients have 20-25 times higher risk of visual loss when compared to non-diabetics.
Screening for DR should be done annually by examining the fundus and pupil as treatment is really effective at the early phase and the therapy for retinopathy mostly stabilizes vision and also decreases the rate of development of blindness. Manual assessment of each patient and evaluation of retinopathy is a very tiring process for medical authorities. Also, as it demands a huge cost of examinations and skilled experts for the same, many go untreated. Therefore to evade variation in the results and to decrease the cost, a computer aided severity level examination is to be designed. The classification of these retinal lesions is of prognostic value in addition to its diagnostic significance. The exact location of lesion required for laser treatment is to be exposed better and for that effective detection and cataloging of retinal lesions is of great importance in precise diagnosis of DR.
II. LITERATUREREVIEW
The feature extrication, segmentation and cataloguing processes are very significant in automated detection methods. Several methods are already recommended in literature for the perception and classification of DR features.
Classification of Diabetic Retinopathy Features
using Bag of Feature Model
These features are detected and extracted independently or in a combined way. False detection of OD and retinal blood vessel are the main problems in the detection of these features. Previous research uses different supporting techniques along with preprocessing and segmentation methods such as Hough transform, watershed transform, edge detection methods, maximum entropy method and circular transformations for the detection and elimination of OD and retinal vessels. Detection methods of exudates and microaneurysms are roughly classified into supervised and unsupervised methods. Many of the unsupervised methods uses thresholding and morphological operators.
Microaneurysms are the earliest noticeable feature of DR.
One of the earliest methods to detect MAs was proposed in Spencer et al [1]. A candidate detection method by a matched filter approach is implemented. An additional rule based classification step and a top hat based method are used for segmentation. Fleming et.al in [2] presented a novel region-growing technique which uses a step based on slope values instead of a meek threshold. Additionally paraboloid factors are employed to abstract many features employed in candidate classification phase. A parameter optimization method is used to fit these factors to each candidate. Zhang et al in [3] applied multiple Gaussian Matched Filters(GMF) instead of employing a single GMF. Microaneurysm candidates are found by using this filter and calculated maximum response in order to create a probability map. A thresholding technique is applied to this probability map so as to list out the opening set of MAs candidates. Final classification is accomplished by a rule based classifier which uses 30 features. In [4] Lazar and Hajdu present a unique unsupervised method for microaneurysm detection and it does not need any training or classification step. In this approach a one dimensional scanline at varying orientations for each pixel is applied to differentiate MAs from blood vessels. MAs possess local minima in every direction of the revolved scan lines while blood vessels have single minima which corresponds to the scanline which is normal to the vessel. Thus, a possibility map is constructed at every pixel using this property. Then by applying a humble thresholding, the final set of candidates are produced.
Thresholding is one of the simplest methods for exudates extraction. In [5] histogram based multilevel thresholding was used to extract the brighter region on 8 bit gray level images. By using minimum square regression technique focus point of the blood vessels were determined and Median filtering is used for blood vessel segmentation. Using this focus point OD is found out. Brighter areas other than the OD are labeled as exudates. In [6] morphological operations and fuzzy-C means (FCM) clustering are employed to figure out Exs and blood vessels in retinal images (RI). Morphological operations are used to trace out the amount of pixels affected with EXs and blood vessel extraction. Then using the highest intensity pixels a mask is formed to eradicate OD and it is ascertained with Circular Hough Transform(CHT). Morphological operations along with connected component analysis is used to detect blood vessels Then the EXs are found out using FCM and eight clusters of images were created. These EXs clusters are carefully chosen and are isolated to decide the concluding EXs images. The quality as well as variety of input image and parameter fine-tuning are the major challenges in unsupervised learning based methods.
Several supervised learning procedures were offered to resolve the segmentation and feature extraction problem. Mizutani et al in [7] used a double ring filter method to notice the opening candidates. MAs are dark ring areas within a brighter area. This property is used to figure out the MAs candidates. A pixel is labeled as a microaneurysm pixel provided the mean intensity strength of the external ring is larger than that of the inner cirque. Once the opening candidates are spotted, grouping is accomplished with twelve extricated features along with an Artificial Neural Network (ANN). Algorithms based on DL perform better than the other contemporary algorithms. However, DL involves gigantic training datasets. Such big labeled sets are unavailable for RI. The authors of [8] represented a relative study of EXs classification based on Support Vector Mechine (SVM) and ANN. SVM delivers better accuracy when compared to others. In [9], classification of exudates candidates using mixture of co-occurrence features of grey level and wavelength statistical features was reported. A method composed of template matching, feature extraction and improved minimum distance discriminant classifier is suggested in [10] for the extraction of exudates candidates. In the classification method described in [11] Ada Boost technique is utilized to separate DR lesions. Anil Kumar K.R and Meenakshy K in [12] demonstrated an efficient method to extract blood vessels from low as well as high resolution retinal FIs. The model in [13] will be useful to isolate the sternness of DR images. In [14] a joint approach of CHT and Convolutional Neural Network (CNN) was offered for spotting EXs. This method is trained and tested in three different datasets and achieved 100%, 98.41%, sensitivity and specificity respectively in the DiaretDB0 data set, 99.2%, 97.97% sensitivity and specificity respectively in the DiaretDB1 dataset and 100%, 98.44% sensitivity and specificity respectively in the DrimDB data set.
III. METHODOLOGY
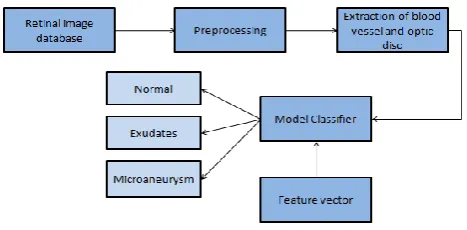
The system offers an algorithm for automatic discovery of DR features from digital fundus images. Blood vessels are the cause of false positive in detection of MAs and hemorrhages. OD contains the maximum pixel values in a retinal image and it is also a source of false positive in bright lesion detection. So the elimination of OD and blood vessel are necessary step to extract features of retinal fundus images. Morphological operation and thresholding based methods are used to segment blood vessels and CHT is put in for the elimination of OD. Our method uses a Bag of Feature (BoF) approach to automatically differentiate between the features of normal and upnormal images. Figure 1 portrays the representation of our system in block diagram form.
A. Preprocessing
International Journal of Innovative Technology and Exploring Engineering (IJITEE) ISSN: 2278-3075, Volume-9 Issue-1, November 2019
Fig.1: Block outline of suggested method
literature it is found that Gaussian filter gives better performance than other filtering methods.
The results obtained with different filters are shown in Figure 2. As shown in Eq(1) based on the Gaussian function, the Gaussian smoothing administers average value of neighboring pixels and the operator clears the effect of illuminations and other noises. It acts by removing components with high frequencies from the image.
)
1
(
)
,
(
*
)
,
(
Im
)
,
(
Im
g
sx
y
g
gx
y
G
aux
y
where * stands for convolution,
Im
g
s(
x
,
y
)
is Gaussianfiltered output,
G
au(
x
,
y
)
is Gaussian filter and)
,
(
Im
g
gx
y
is green channel component .B. Elimination of anatomical structures
OD and blood vessels are known as anatomical structures of retinal fundus images. Highlighting the discriminate lesions will mark them simply distinguishable with our feature detector. Hence some morphological operations are done over all images to highlight these lesions. The extractions of these two anatomical structures are done differently. The steps involved are described in the following sections. Blood Vessels Extraction
A multi-level adaptive thresholding technique is employed to separate blood vessels from RI. It iteratively applies different threshold values and keep vessels in each layer. Threshold
value
T
MAX is determined from the image histogram. It isused to keep those pixels in first segmented image which is greater than
T
MAX. Then morphological thinning operator isemployed to obtain the image
Im
g
THIN from the firstsegmented image
Im
g
SEG. This results in vessels which areonly one pixel wide. Now edge image
I
Edge is identifiedusing equation (2).
I
Edge highlights the edge pixels of allvessels For each pixel p in
Im
g
THIN)
2
(
Im
Im
2
1
)
(
8
1
) ( )
( m od8 1
i
p THIN p
THIN
Edge
p
g
ig
iI
where
p
7down top
0 represents the pels pertaining to an anti-clockwise ordered structure of pels describing the eight vicinity of p.Im
g
THIN(p) represents the value of the pixel.For vessel pixels
Im
g
THIN (p) = 1 and zero for all the otherconditions.
I
Edge(
p
)
1
for vessel edge point whereas it is2 for intermediate vessel. Then decrease the threshold value
by 1 and repeat the entire steps until
T
MAX-1 is zero.Optic Disk Recognition and Eradication
In humans OD has an elliptical contour shape. OD is the rising point of blood vessels as well as optic nerves. It appear as a bright yellow disc. It is larger than the retinal exudates. Mathematical morphology can be used to eliminate OD. The main four processes used here are dilation, erosion, opening and closing. To eliminate OD, we use a CHT method. The CHT is based on the equation of circle defined by Eq(3)
)
3
(
)
(
)
(
x
i
2
y
i
2
r
2where,
and
are the center of a circle with radiusr
. Tokeep away false detection of OD we modified our system by applying CHT on each image at different sensitivity level. Strong circles are the ones that consistent with the OD while the rest are either misleading patches or exudates. Original image without blood vessels and optic disc are presented in Figure 3.
C. Classifier Model
Bag of feature (BoF) model is employed in image classification problems and in DR classification as one of the effective and popular classification models. An image in this model is represented as a group of self-governing local descriptors. Then quantize by histogram vector. The color features have revealed enormous impact in grouping the RI. Therefore it is added as feature for the formation of the BoF. Usually, there are two steps in BoF. Finding a collection of descriptors from a group of training images is the first step. To obtain the feature set, a retinal image is separated into smaller spots with the help of dense sampling technique. Every local patch has a descriptor. This descriptor will maps a point into a large dimensional feature space. The Speeded Up Robust Features (SURFs) interest areas are discovered in this work and SURFs are acquired from the pre-processed RI.
The second step is construction of a visual vocabulary. It is done by grouping the separated characteristics from the training set. K-means clustering algorithm is used for this purpose. The feature descriptors are obtained and then allocated to the nearest visual vocabulary when an image is given. Hence each image is represented using a histogram of the occurrences of each possible word from a given vocabulary. This is then employed as the descriptor vector for training the classifier.
IV. RESULTSANDDISCUSSION
For this study, we used images containing exudates and microaneurysm from the public dataset e-ophta and images having exudates, microaneurysms and heommorrages from DRIVE database. The system performance is assessed using the parameters given below.
(a) True Positive Rate (Sensitivity):
It is the ability of an
experiment to indicate disease among those with the
disease.
It is expressed asTP
FN
y
Sensitivit
1
1
where TP indicates true positive and it represent the count of lesion pels properly labeled by the method as lesion pels. FN indicates false negatives and it portrays the count of lesion pels that are falsely labeled by the method as non-lesion pels. (b) True Negative Rate (Specificity):
It is the fraction of
those without disease who will have a negative test
result.
and it is expressed as
TN
FP
y
specificit
1
1
(5)
where TN indicate true negatives and it renders the amount of non-lesion pels properly estimated by the test as non-lesion pels in reference to ground truths. FP indicates false positives and it indicates the count of non-lesion pels that are deceitfully labeled by the test as lesion pels.
(c) Accuracy: This parameter indicates the capability of a method to distinguish the patient and healthy cases properly. It can be expressed as
)
6
(
pixels
of
number
Total
TP
TN
Accuracy
Experimental Results
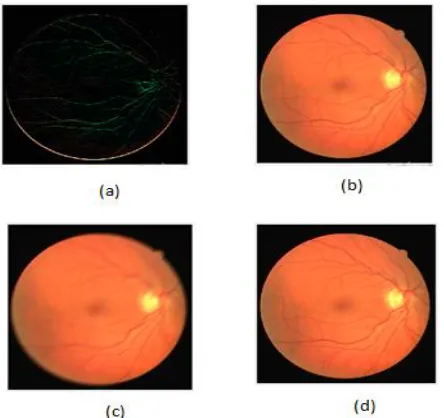
During the preprocessing step, input image was subjected to different filtering techniques like Laplacian filter, Motion filter, Average filter and Gaussian filter .The output obtained from different filters are shown in figure 3 and the results indicates that the gaussian filter gives better performance than other techniques.
[image:4.595.315.546.56.212.2]After preprocessing separation of blood vessel is carried out to avoid the misclassification. From the literature local entropy thresholding along with morphological operator method gives accurate blood vessel elimination. Here morphological operator like thinning and thickening is used for the extraction of blood vessel. The obtained outputs with intermediate results are shown in fig.3.
Fig 2: Filtered image output using(a) Laplacian (b)Average (c) Motion (d)Gaussian filters respectively
Fig.3
: Blood vessel elimination process(a) Orininalimage (b)fitered image (gaussian filter) (c)Segmented image(Thresholding method) (d)Thinned image (e)Image
after blood vessl removed
Morphological operator like erosion and dilation and CHT are used for the elimination of OD. Figure 4 shows the obtained output and the intermediate results.
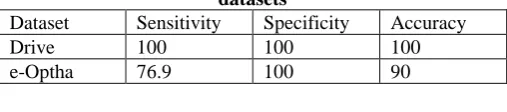
The performance of our method is established using 2 publicly offered databases. Our experimental dataset consists of 90 normal and 210 DR affected images. In this work, the database was alienated into two groups: a training group comprising 210 images (70%) and a testing group having 90 images (30%). For performance appraisal of the classification model, performance measures such as True Positive Rate, True Negative Rate and Accuracy were considered. The performance analysis of our method is described below. The method produces accurate results with sensitivity=76.9%, Specificity=100% and accuracy=90% for e-optha dataset. 100% sensitivity and specificity are obtained with Drive dataset. The performance measures for the proposed approach for different datasets are tabulated in Table.1.
[image:4.595.54.276.479.688.2] [image:4.595.311.538.484.687.2]International Journal of Innovative Technology and Exploring Engineering (IJITEE) ISSN: 2278-3075, Volume-9 Issue-1, November 2019
Table 1: Performance measures of classifier for different datasets
Dataset Sensitivity Specificity Accuracy
Drive 100 100 100
e-Optha 76.9 100 90
V. CONCLUSION
Most of the existing algorithms demands surplus pre and/or post processing phases for recognizing various features in retinal fundus images. Also, previous algorithms requires manual feature extirpation stages to sort the features in FI. In this effort, bag of feature model is exploited to develop an easily manageable and automated diagnosis system. This approach is used to classify exudates and microaneurysm from normal images. No manual feature extraction stages are
needed. The proposed approach can provide
ophthalmologists a feasible, efficient, and timesaving way of DR detection. The bag of feature model along with SURF feature descriptor demonstrates excellent discriminating capabilities with an accuracy of 100% & 90% for DRIVE and e-OPTHA databases respectively. In future, additional feature detectors and descriptors such as SIFT, HOG, LBP and further experimental FI are to be assimilated into the system. Furthermore, effort should be done to autotomatically assess the sternness of DR.
REFERENCES
1. Spencer, T., Olson, J.A., McHardy, K.C., Sharp, P.F., Forrester, J.V. “An image processing strategy for the segmentation and quantification of microaneurysms in fluorescein angiograms of the ocular fundus.” Computers in Biomedical Research 29, 284–302,1996.
2. A. D. Fleming, S. Philip, K. A. Goatman, J. A. Olson and P. F. Sharp, "Automated microaneurysm detection using local contrast normalization and local vessel detection," in IEEE Transactions on Medical Imaging, vol. 25, no. 9, pp. 1223-1232, Sept. 2006.
3. Zhang, B., Wu, X., You, J., Li, Q. and Karray, F. “Detection of
microaneurysms using multi-scale correlation coefficients.” Pattern Recognition, 43(6), pp.2237-2248, 2010.
4. Lazar and A. Hajdu, "Retinal Microaneurysm Detection Through Local Rotating Cross-Section Profile Analysis," in IEEE Transactions on Medical Imaging, vol. 32, no. 2, pp. 400-407, Feb. 2013.
5. D. Kavitha and S. S. Devi, ―Automatic detection of optic disc and exudates in retinal images,‖ in Intelligent Sensing and Information Processing, 2005. Proceedings of 2005 International Conference on. IEEE, 2005, pp. 501–506.
6. P. H. Princye and V. Vijayakumari, ―Detection of exudates and feature extraction of retinal images using fuzzy clustering method,” Computational Intelligence and Information Technology, 2013. 7. Mizutani, A., Muramatsu, C., Hatanaka, Y., Suemori, S., Hara, T. and
Fujita, H., 2009, March. Automated microaneurysm detection method based on double ring filter in retinal fundus images. In Medical Imaging 2009: Computer-Aided Diagnosis(Vol. 7260, p. 72601N). International Society for Optics and Photonics.
8. A. Osareh, M. Mirmehdi, B. Thomas, and R. Markham, “Comparative exudate classification using support vector machines and neural networks”, in International Conference on Medical Image Computing and Computer-Assisted Intervention. Springer, 2002, pp. 413–420. 9. L. Xu and S. Luo, “Support vector machine based method for
identifying hard exudates in retinal images,” in Information, Computing and Telecommunication, 2009. YC-ICT’09.IEEE Youth Conference on. IEEE, 2009, pp. 138–141.
10. V. V. Kumari and N. Suriya Narayanan, “Diabetic retinopathy-early detection using image processing techniques,” International Journal on Computer Science and Engineering, vol. 2, no. 02, pp. 357–361, 2010 11. S. Roychowdhury, D. D. Koozekanani, and K. K.Parhi, “Dream:
diabetic retinopathy analysis using machine learning,” IEEE journal of biomedical and health informatics, vol. 18, no. 5, pp. 1717–1728, 2014.
12. Anil Kumar K.R and Meenakshy K, “ Retinal Vasculature Extraction using Non-Subsampled Contourlet Transform and Multi-structure Element Morphology by Reconstruction,” International Journal of Recent Technology and Engineering (IJRTE), Vol-8 Issue-2, July 2019. Page No.: 116-125.
13. Dutta, Suvajit, et al. "Classification of diabetic retinopathy images by using deep learning models." International Journal of Grid and Distributed Computing 11.1 (2018): 89-106.
14. K. Adem, “Exudate detection for diabetic retinopathy with circular hough transformation and convolutional neural networks,” Expert Systems with Applications, vol. 114, pp.289–295, 2018.
AUTHORSPROFIL
Anil Kumar K.R, was born in Kerala, India in May 1977. He took his B.Tech degree in Electronics Engineering with first class from Cochin University of Science and Technology (CUSAT), Kerala, India in June 1999 and M.Tech degree in Industrial Electronics from Visvesvaraya Technological University (VTU), Belgaum, Karnataka, India in September 2010 with first rank. Currently he is pursuing Ph.D degree in University of Calicut, Kerala, India. He is a life member of ISTE. Since 2000 he has been an Assistant Professor in the department of Electronics and Communication Engineering, NSS College of Engineering, Palakkad, Kerala, India. His areas of research are Biomedical Image and Signal Processing and Computer Vission
Noushira K I, was born in Kerala, India in April 1994. She pursed B.Tech degree in Electronics and Communication Engineering from Kannur University, Kerala, India in 2015.She pursued her PG Degree in Communication Engineering from the Department of Electronics and Communication Engineering, NSS College of Engineering, Palakkad, Kerala, India affiliated APJ Abdul Kalam Technological University. Her research interests include Biomedical Image and Signal processing..