International Journal of Innovative Technology and Exploring Engineering (IJITEE) ISSN: 2278-3075, Volume-8 Issue-11, September 2019
4152
Published By:
Blue Eyes Intelligence Engineering & Sciences Publication
Retrieval NumberK25470981119/2019©BEIESP DOI:10.35940/ijitee.K2547.0981119
Abstract— Activity detection based on likelihood ratio in the presence of high dimensional multimodal data acts as a challenging problem as the estimation of joint probability density functions (pdfs) with intermodal dependence is tedious. The existing method with above expectations fails due to poor performance in the presence of strongly dependent data. This paper proposes a Compressive Sensing Based Detection method in the Multi-sensor signal using the deep learning method. The proposed Tree copula- Grasshopper optimization based Deep Convolutional Neural Network (TC-GO based DCNN) detection method comprises of three main steps, such as compressive sensing, fusion and detection. The signals are initially collected from the sensors in order to subject them under tensor based compressive sensing. The compressed signals are then fused together using tree copula theory, and the parameters are estimated with the Grasshopper optimization algorithm (GOA). The activity detection is finally performed using DCNN, which is trained with the Stochastic Gradient Descent (SGD) Optimizer. The performance of the proposed method is evaluated based on the evaluation metrics, such as probability of detection and probability of false alarm. The highest probability of detection and least probability of false alarm are obtained as 0.9083, and 0.0959, respectively using the proposed method that shows the effectiveness of the proposed method in activity detection.
Keywords: Probability density functions, Tree copula theory, Stochastic gradient descent, and Grasshopper optimization algorithm
I. INTRODUCTION
Multimodal data indicates the multiple forms of a phenomenon of interest (PoI) that is observed with the use of different types of sensors or various acquisition methods [2]. Fusion of multimodal data has achieved more attention in various fields of application, including multi-media analysis [13], biometric score fusion [12], footstep detection [15], automatic target recognition [14]. A multi-source signal can either be a single channel obtained from single sensor or a multi-channel obtained from multi-sensors [8]. In case of multi-sensor recording, when the number of sensors is greater than that of the number of sources termed as overdetermined case, then the recovery of the original signal can be done using the linear combination of obtained mixed signals [8]. In order to model the complex dependencies over multivariate data for the evaluation of joint pdf, copula theory is used in [2-8]. Hence, the advantages of using the copula theory for LR based
Revised Manuscript Received on September2, 2019.
Sujata D Badiger, R V College of Engineering, Bengaluru, Karnataka, India.
(E-mail: sujathadb@rvce,edu.in)
Dr. Uttarakumari M, R V College of Engineering, Bengaluru, Karnataka, India..
(E-mail: [email protected])
detection in the presence of multi modal data requires more computational price [5].
The ground-breaking theory of Compressed Sensing (CS) was designed recently to enable the vector with correlated entries [16]. Based on CS theory, as long as the signals are sparse or compressible in a particular domain, they are observed at a rate too lower than the Nyquist sampling frequency, at the same time, the original signals are reconstructed accurately based on construction algorithm [17] [7]. Mostly used in the field of digital signal and image processing, the CS acts as a promising tool for the improvement of the performance of wireless networks [9]. The target space sparseness for most of the fields lends itself to the emerging compressive sensing (CS) technology [17]. The basic feature of CS is the recovery of the sparse signal from the fewer measurements even with the presence of noise. For example, the usage of CS in case of ground penetrating radar imaging allows the reconstruction of target space with fewer frequencies that are sampled at random, which considerably lowers the acquisition time [18][5]. CS is a new signal front-end processing method that is developed in the recent years. It overcomes the signal bandwidth limits using the Shannon’s theoretical signal recovery, and has the capability to complete the signal acquisition at a sampling rate less than twice the signal frequency [8]. This can reduce the computation needed for WSNs to obtain the signals, with the preservation of storage space and consumption of energy [10].
The major intension of this research is the development of a Compressive Sensing Based Detection method in the Multi-sensor signal using the deep learning technique. The proposed detection method undergoes three major steps, namely compressive sensing, fusion and detection. Initially, the sensor signals are gathered from large number of sensors and fed to the proposed technique. The first step in the proposed scheme is the compressive sensing, where the signals obtained from the sensors are compressed using the tensor based compressive sensing. After this process, the compressed signals are fused together with the use of the tree copula theory, where the probabilistic estimation is carried out using the GOA. Finally, the fused signals are utilized in the detection of activity, which is performed using the DCNN. The training of the DCNN is performed using the SGD in order to estimate the optimal weights of the DCNN, where the solution with minimum error value is selected as the optimal solution.
Tree Copula Theory Based Fusion And
Compressive Sensing For Activity Detection
using Multi-Modal Data
Data
4153
Published By:
Blue Eyes Intelligence Engineering & Sciences Publication
Retrieval NumberK25470981119/2019©BEIESP DOI:10.35940/ijitee.K2547.0981119
II. PROPOSED METHODOLOGY
The main aim of this research is to develop a Compressive Sensing Based Detection technique in Multi-sensor signal through deep learning scheme. The entire process is carried out through three steps, such as compressive sensing, fusion and detection. Initially, the sensor signals are collected from wide range of sensors and fed to the proposed technique. The initial stage in processing is the compressive sensing, which is done by tensor based compressive sensing [21]. After this stage, the compressed signals are fused together using the tree copula theory, where the probabilistic estimation is performed using the GOA [22]. Then, the fused signals are used in the activity detection process that is carried out using the DCNN, which is trained with the use of SGD.
Fig1. Architecture of the proposed activity detection scheme
2.1 System Model
Let us consider a
S
number of sensors possessingS
number of signals and are fed to compressive sensing. Let
i
be the signal needed to be compressed on tensor basis, which is fed to the individual tensor based compressive sensing process. Each of theS
number of signals are compressed individually and fed to signal fusion process. TheS
number of signals are fused together to form a single signal using the tree copula theory.The tensor based compression sensing concept [T-CS] [21] is used to perform the compression of the signals directly without any intermediate steps.
The compressed signals are subjected to get fused together as a single signal using the tree copula theory in the next step. The fusion of the signals obtained in compressed form from the process of tensor based compressive sensing is performed using the tree copula theory, where the probabilistic estimation of the parameters is done with the use of the GOA. The GOA is a nature-inspired algorithm that works based on the characteristics of the insect called grasshopper. The nature-inspired algorithms divide the process of search as two phases, namely exploration and exploitation. The search agents are motivated to move abruptly in case of the exploration phase, whereas the search agents move locally in case of the exploitation phase. The target seeking in addition to these phases are performed naturally by the grasshoppers, and can be used in the development of the mathematical model of an algorithm. The mathematical model can be expressed as,
b b b
b
C
D
H
B
(1)
where,
B
b is the position of theb
th grasshopper,C
b isthe social interaction,
D
b is the force of gravity onb
thgrasshopper, and
H
b is the wind advection. In case ofrandom behaviour, the above equation can be rewritten as,
b b
b
b
r
C
r
D
r
H
B
1
2
3(2)
where,
r
1,r
2, andr
3 are the random numbers thatranges between 0 and 1. The social interaction
C
bcan beexpressed as,
E b h h bh bhb
c
f
f
C
1(3)
where,
s
represents the strength of the social forces,f
bhindicates the distance among the
b
thand theh
thgrasshopper, and is calculated as,
f
bh
q
b
q
h , andf
bh
is the unit vector from
b
thgrasshopper to theh
thgrasshopper and is calculated as, bh
h b bh
f
q
q
f
.
The component
D
b can be estimated as,
Ib
I
o
D
(4)
where,
I
is the gravitational constant, and
I
o
is the unitvector towards the centre of earth. The component
H
b canbe estimated as,
P
b Po
h
(5)
where,
P
is the constant drift, and
P
o
is the unit vectortowards the wind direction. As the Nymph grasshopper does not have any wings, the movement of them depends on the
direction of the wind. On substituting the values of
C
,D
,and
H
in equation (1),
E I Pb h h bh h b h b
b
I
o
P
o
f
q
q
q
q
c
B
1 (6)International Journal of Innovative Technology and Exploring Engineering (IJITEE) ISSN: 2278-3075, Volume-8 Issue-11, September 2019
4154
Published By:
Blue Eyes Intelligence Engineering & Sciences Publication
Retrieval NumberK25470981119/2019©BEIESP DOI:10.35940/ijitee.K2547.0981119
fE b h h bh h b h b f f f b Q f q q q q c low upp T T B
1 2 (7)where, uppfand lowfare the upper bound and lower
bound of the
th
f
dimension respectively,T
is thedecreasing coefficient, and
Q
f
is the best solution obtained for the past long period of time. The parameters in the final relation of the tree copula model are thus optimized using the above equation. The fused signals are fed to the proposed TC-GO based deep CNN in order to perform the process of activity detection.
2.2 Activity recognition using the proposed TC-GO based deep CNN
The deep CNN classifier classifies the compressed signal and derived the classes, which include walking, dancing, jogging, cycling, swimming and playing. For the effective classification of the compressed signals, deep CNN classifier is used and the weights-biases are determined using the SGD optimizer.
Deep CNN performs a major role in the analysis of the compressed signals for better classification results. In deep CNN, a patch of neurons are connected to the individual neuron present in the next layer. The architecture of deep CNN consists of three layers, namely pooling (POOL) layers, convolutional (conv) layers, and a Fully Connected (FC) layer. The layers in the deep CNN carry out specific functions, such as development of feature maps in the conv layers, sub-sampling of the feature maps in POOL layers, and finally the classification in FC layer. With more number of conv layers, the classification accuracy can be improved.
III. RESULTS AND DISCUSSION
The results and discussion of the proposed TC-GO based DCNN classifierare discussed in this section. The results of the TC-GO based DCNN classifierwhen compared with the existing conventional classifiers in terms of probability of detection and probability of false alarm with respect to various training percentages and K-values are presented.
3.1 Experimental setup and Dataset description
The proposed TC-GO based DCNN classifier is implemented in MATLAB that is operated in PC with the Windows 8 OS, and the simulation is performed with the use of various number of nodes. Goat database [20] is a labeled dataset, where the motion data were gathered from six sensor nodes fixed at different orientations to a collar over the goat’s neck. These six sensor nodes, with various orientations, record the number of activities done by the goat in simultaneous manner. In this paper, activities of five different goats were recorded on two farms in Netherlands in the presence of 3-axis accelerometer, gyroscope, high-impact accelerometer, and magnetometer with the sampling frequency of100 Hz.
The evaluation metrics, namely probability of detection and the probability of false alarm shows the effectiveness of the proposed TC-GO based DCNN classifier.
printed volumes, illustrations are generally black and white (half- tones). Colored pictures are welcome in the electronic version free of charge. If you send colored figures that are to be printed in black and white, please make sure that they really are also legible in black and white. Some colors show up very poorly when printed in black and white.
3.2 Results of the simulation
Various existing conventional methods, such as Neural Network (NN), Deep Belief Neural Network (DBN), and the Recurrent Neural network (RNN) are compared with the proposed TC-GO based DCNN classifier in order to convey the effectiveness of the proposed method in terms of the evaluation metrics, namely probability of detection and the probability of false alarm rate.
Comparative analysis of the methods in the presence of 50 nodes:
The comparative analysis of the methods involved in activity detection in the presence of 50 nodes is depicted in figure 5. Figure 5.a shows the probability of detection rate with the variation in k-value for the comparative methods. When the k-value is 70, the probability of detection for the methods, such as TC-GO based DCNN, NN, DBN, and RNN is 0.8804, 0.8648, 0.7947, and 0.8139, respectively. When the k-value is 100, the probability of detection for the methods, such as TC-GO based DCNN, NN, DBN, and RNN is 0.9076, 0.8899, 0.8192, and 0.8374, respectively. Figure 5.b shows the probability of detection rate with the variation in k-value for the comparative methods. When the training percentage is 70, the probability of detection for the methods, such as TC-GO based DCNN, NN, DBN, and RNN is 0.866, 0.8528, 0.7908, and 0.8323, respectively. With the increase in k-value and training percentage, the probability of detection increases. When the training percentage is 90, the probability of detection for the methods, such as TC-GO based DCNN, NN, DBN, and RNN is 0.8717, 0.8586, 0.7999, and 0.8427, respectively. With the increase in k-value and training percentage, the probability of detection increases.
Data
4155
Published By:
Blue Eyes Intelligence Engineering & Sciences Publication
Retrieval NumberK25470981119/2019©BEIESP DOI:10.35940/ijitee.K2547.0981119
respectively. With the increase in k-value and training percentage, the probability of false alarm decreases.
a) b)
[image:4.595.86.468.66.384.2]c) d)
Figure 5. Comparative results of the experiment in the presence of 50 nodes a) probability of detection in terms of value, b) probability of detection in terms of training percentage, c) probability of false alarm rate in terms of
k-value, d) probability of false alarm rate in terms of training percentage.
4.5.2 Comparative analysis of the methods in the presence of 100 nodes
The comparative analysis of the methods involved in activity detection in the presence of 100 nodes is depicted in figure 6. Figure 6.a shows the probability of detection rate with the variation in k-value for the comparative methods. When the k-value is 70, the probability of detection for the methods, such as TC-GO based DCNN, NN, DBN, and RNN is 0.8801, 0.8611, 0.7747, and 0.7808, respectively. When the k-value is 100, the probability of detection for the methods, such as TC-GO based DCNN, NN, DBN, and RNN is 0.9083, 0.8864, 0.7981, and 0.8039, respectively. Figure 6.b shows the probability of detection rate with the variation in k-value for the comparative methods. When the training percentage is 70, the probability of detection for the methods, such as TC-GO based DCNN, NN, DBN, and RNN is 0.8662, 0.8528, 0.7714, and 0.8584, respectively. When the training percentage is 90, the probability of detection for the methods, such as TC-GO based DCNN, NN, DBN, and RNN is 0.8717, 0.8596, 0.787, and 0.8631, respectively. With the increase in k-value and training
percentage, the probability of detection increases.
International Journal of Innovative Technology and Exploring Engineering (IJITEE) ISSN: 2278-3075, Volume-8 Issue-11, September 2019
4156
Published By:
Blue Eyes Intelligence Engineering & Sciences Publication
Retrieval NumberK25470981119/2019©BEIESP DOI:10.35940/ijitee.K2547.0981119
a) b)
c) d)
Figure 5. Comparative results of the experiment in the presence of 100 nodes a) probability of detection in terms of value, b) probability of detection in terms of training percentage, c) probability of false alarm rate in terms of
k-value, d) probability of false alarm rate in terms of training percentage.
[image:5.595.87.470.52.358.2]4.5.3 Comparative analysis using ROC curve
[image:5.595.314.556.409.559.2]Figure 6. depicts the performance of the existing methods against the proposed TC-GO based DCNN classifier based on ROC curve. Figure 6.a shows the results in the presence of 50 nodes. When the FPR is 0.33, the corresponding TPR for TC-GO based DCNN, NN, DBN, and RNN is 0.728, 0.7166, 0.6638, and 0.7, respectively. For the FPR 0.833, the TPR for the methods, such as DBN, FDBN, NN, k-NN, NB, and the Taylor-DBN is 0.8487, 0.836, 0.7788, and 0.8205, respectively. Figure 6.b shows the results in the presence of 00 nodes. When the FPR is 0.33, the corresponding TPR for TC-GO based DCNN, NN, DBN, and RNN is 0.7276, 0.7165, 0.6444, and 0.7222, respectively. For the FPR 0.833, the TPR for the methods, such as DBN, FDBN, NN, k-NN, NB, and the Taylor-DBN is 0.8487, 0.837, 0.7662, and 0.8404, respectively. Thus, the proposed TC-GO based DCNN classifier provides high TPR value as compared to the existing methods for the minimum error of 0.166.
Figure 6. Comparative results of the experiment in terms of ROC curve a) in the presence of 50 nodes, b) in
the presence of 100 nodes IV. COMPARATIVE DISCUSSION
Data
4157
Published By:
Blue Eyes Intelligence Engineering & Sciences Publication
Retrieval NumberK25470981119/2019©BEIESP DOI:10.35940/ijitee.K2547.0981119
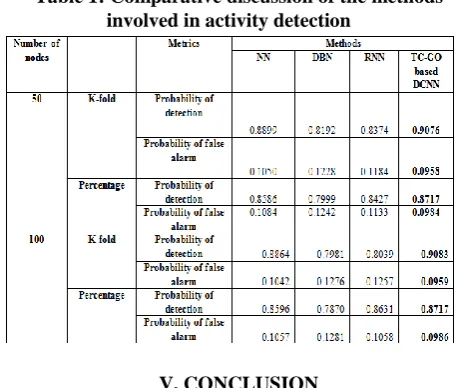
[image:6.595.54.283.324.518.2]When the number of nodes is 50, the probability of detection for the methods, such as NN, DBN, RNN, and the proposed TC-GO based DCNN in terms percentage is 0.8586, 0.7999, 0.8427, and 0.8717, respectively, and the probability of false alarm for the methods, such as NN, DBN, RNN, and the proposed TC-GO based DCNN in terms of percentage is 0.1084, 0.1242, 0.1133, and 0.0984, respectively. When the number of nodes is 100, the probability of detection for the methods, such as NN, DBN, RNN, and the proposed TC-GO based DCNN in terms of k-fold is 0.8864, 0.7981, 0.8039, and 0.9083, respectively, and the probability of false alarm for the methods, such as NN, DBN, RNN, and the proposed TC-GO based DCNN in terms of k-fold is 0.1042, 0.1276, 0.1257, and 0.0959, respectively. When the number of nodes is 50, the probability of detection for the methods, such as NN, DBN, RNN, and the proposed TC-GO based DCNN in terms percentage is 0.8596, 0.787, 0.8631, and 0.8717, respectively, and the probability of false alarm for the methods, such as NN, DBN, RNN, and the proposed TC-GO based DCNN in terms of percentage is 0.1057, 0.1281, 0.1058, and 0.0986, respectively.
Table 1: Comparative discussion of the methods involved in activity detection
V. CONCLUSION
Detection of activity using the high dimensional multimodal data on the basis of likelihood ratio is the major challenge due to the fact that the calculation of joint probability density functions (pdfs) is difficult with intermodal dependence. In this paper, a Compressive Sensing Based Detection method in Multi-sensor signal using the deep learning technique is proposed. The proposed Tree copula-Grasshopper optimization based Deep Convolutional Neural Network (TC-GO based DCNN) activity detection technique undergoes three important steps, namely compressive sensing, fusion and detection. The signals are collected from the sensors in the first step to make them compressed using the tensor based compressive sensing. The compressed signals are fused as a single signal using tree copula theory, and the parameters are calculated by Grasshopper optimization algorithm (GOA). The activity detection is performed using DCNN with the fused signal, which is trained with the Stochastic Gradient Descent (SGD) Optimizer. The effectiveness of the proposed method is analysed on the basis of the evaluation metrics, such as probability of detection and probability of false alarm. The probability of detection and probability of false alarm of
0.9083, and 0.0959, respectively are obtained using the proposed method that shows the superiority of the proposed method in activity detection. Experiments with more number of real datasets will be considered as the future work
REFERENCE
1. T. Wimalajeewa and P. K. Varshney, "Compressive Sensing-Based Detection With Multimodal Dependent Data," in IEEE Transactions on Signal Processing, vol. 66, no. 3, pp. 627-640, Feb.1, 1 2018. 2. T. Wimalajeewa and P. K. Varshney, "Detection with multimodal
dependent data using low-dimensional random projections," 2017 IEEE International Conference on Acoustics, Speech and Signal Processing (ICASSP), New Orleans, LA, 2017, pp. 4621-4625. 3. Hariri, A. and Babaie-Zadeh, M., “Compressive detection of sparse
signals in additive white gaussian noise without signal reconstruction,” Signal Processing, vol. 131, pp.376-385,2017.
4. A. Razavi, M. Valkama and D. Cabric, "Compressive Detection of Random Subspace Signals," in IEEE Transactions on Signal Processing, vol. 64, no. 16, pp. 4166-4179, Aug.15, 15 2016.
5. Dang, V. and Kilic, O., “Simulation framework for compressive sensing-based through-wall detection of moving targets,” IET Radar, Sonar & Navigation, vol. 11, no. 9, pp.1349-1358,2017.
6. R. Ma, F. Hu and Q. Hao, "Active Compressive Sensing via Pyroelectric Infrared Sensor for Human Situation Recognition," in IEEE Transactions on Systems, Man, and Cybernetics: Systems, vol. 47, no. 12, pp. 3340-3350, Dec. 2017.
7. R. Zhang, Q. Hu, G. Wang and B. Ye, "Distributed Compressed Sensing of Microseismic Signals Through First Break Time Extraction and Signal Alignment," in IEEE Access, vol. 6, pp. 27408-27417, 2018.
8. Ali, S., Khan, N.A., Haneef, M. and Luo, X., “Blind source separation schemes for mono-sensor and multi-sensor systems with application to signal detection,” Circuits, Systems, and Signal Processing, vol. 36, no. 11, pp.4615-4636,2017.
9. Kaneko, M. and Al Agha, K., “Compressed sensing based protocol for interfering data recovery in multi-hop sensor networks,” IEEE Communications Letters, vol. 18, no. 1, pp.42-45,2014.
10. Xiao, S., Li, T., Yan, Y. and Zhuang, J., “Compressed sensing in wireless sensor networks under complex conditions of Internet of things,” Cluster Computing, pp.1-11, 2018.
11. Zhang, D.G., Zhang, T., Zhang, J., Dong, Y. and Zhang, X.D., “A kind of effective data aggregating method based on compressive sensing for wireless sensor network,” EURASIP Journal on Wireless Communications and Networking, vol. 1, p.159, 2018.
12. K. Nandakumar, Y. Chen, S. C. Dass, and A. K. Jain, “Likelihood ratiobased biometric score fusion,” IEEE Trans. Pattern Anal. Mach. Intell.,vol. 30, pp. 342–347, Feb. 2008.
13. P. K. Atrey, M. A. Hossain, A. E. Saddik, and M. S. Kankanhalli,“Multimodal fusion for multimedia analysis: a survey,” MultimediaSystems, vol. 16, no. 6, pp. 345–379, Apr. 2010.
14. H. Zhang, N. M. Nasrabadi, Y. Zhang, and T. S. Huang, “Multi-viewautomatic target recognition using joint sparse representation,” IEEETrans. Aerosp. Electron. Syst., vol. 48, pp. 2481–2497, 2012. 15. X. Jin, S. G. A. Ray, and T. Damarla, “Multimodal sensor fusion for
personnel detection,” in Proceedings of 14th International Conferenceon Information Fusion, Chicago, IL, July 2011.
16. B. Sun, H. Feng, and K. Chen, “A deep learning framework of quantized compressed sensing for wireless neural recording,'' IEEE Access, vol. 4,no. 99, pp. 5169- 5178, Sep. 2017.
17. D. L.Donoho, “Compressed sensing,” IEEE Trans. Inf. Theory, vol. 52,no. 4, pp. 1289-1306, Apr. 2006.
18. Gurbuz, A., McClellan, J., Scott, W.: “A compressive sensing data acquisitionand imaging method for stepped frequency GPRs,” IEEE Trans. SignalProcess., 2009, vol. 57, no. 7, pp. 2640–2650
19. S. Kay, “Fundamentals of statistical signal processing: detection theory,” Prentice Hall, 1998.
20. https://easy.dans.knaw.nl/ui/datasets/id/easy-dataset:78937
21. Richard G. Baraniuk ,"Compressive Sensing [Lecture Notes]", IEEE Signal Processing Magazine, vol.24, no. 4, pp.118 - 121, July 2007. 22. Mirjalili, S.Z., Mirjalili, S., Saremi, S., Faris, H. and Aljarah, I.,
“Grasshopper optimization algorithm for multi-objective optimization problems,” Applied Intelligence,
International Journal of Innovative Technology and Exploring Engineering (IJITEE) ISSN: 2278-3075, Volume-8 Issue-11, September 2019
4158
Published By:
Blue Eyes Intelligence Engineering & Sciences Publication
Retrieval NumberK25470981119/2019©BEIESP DOI:10.35940/ijitee.K2547.0981119
23. Ning, J., Liu, Q., Ouyang, H., Chen, C. and Zhang, B., "Multi-sensor fusion framework for detecting small amplitude hunting of high-speed trains," Journal of Vibration and Control, 2018.