Exploring the use of Water Cycle Optimization
Algorithm for Foreign Exchange Prediction
Arup Kumar Mohanty, Debahuti Mishra
Abstract: The aim of this paper is to model a network and predict the exchange price of United States Dollar to Indian Rupees using daily exchange rates from Dec 18, 1991-Jul 19, 2007. In this paper, Water Cycle Optimization (WCA) technique has been used to optimize the Artificial Neural Network (ANN) for Foreign Exchange prediction on the basis of their predictive performance. The performance metrics considered for the evaluation of the models are root mean square error (RMSE) and mean absolute error (MAE). The tabulated outcome shows the efficiency of the model over other popular models.
Index Terms: ANN; Forex;Machine Learning; Prediction; WCA
I.INTRODUCTION
To enhance the economic system of a country global marketing is very important for all countries. The raw data of the financial time series are redundant enough which appears to be noisy, irrelevant, volatile and ambiguous. These unusual natures of the concerned data cannot be adequately used to predict the foreign exchange rates by using current statistical models. For international trading; currency exchange policy and a defined standard are necessary. Therefore the global business leader USA’s currency dollar (USD) is a common standard currency for international trade. Das S.R. et al. [7] presented and predicted the exchange rate of currency using some technical indicators like Exponential Moving Average (EMA), Stochastic Oscillator, Momentum, Relative Strength Index (RSI), Simple Moving Average (SMA), Average True Range (ATR), Willium%R or %R, Moving Average Convergence and Divergence (MACD). The above technical indicators are calculated using various basic information (price list, charge percentage etc) collected from the Forex data repository. Apart from many solution approaches; machine learning approaches like FLANN, decision tree learning, artificial neural network (ANN), deep learning, support vector method (SVM) are emergently used to predict the near future price from the historical data of forex. Forex price prediction is a constrained, non-linear and continuous problem, hence very difficult to find the apparent solution to fix the issues.
Revised Manuscript Received on August 05, 2019.
Arup Kumar Mohanty, Department of Computer
Science&Information Technology,
Siksha ‘O’ AnusandhanDeemed to be University, Bhubaneswar, Odisha, India
Debahuti Mishra, Department of Computer Science and Engineering,
Siksha ‘O’ AnusandhanDeemed to be University, Bhubaneswar, Odisha, India
To solve and predict the above problem, various meta-heuristic approaches have been proposed in various fields. Genetic algorithm (GA), deferential evolution (DE), particle swarm optimization (PSO) , ant colony optimization (ACO), shuffled frog leaping algorithm (SFL), water cycle algorithm (WCA), marriage in honey bee optimization (MBO), artificial bee colony optimization (ABC), fish school search (FSS) are many of them Pradeep Kumar D and Ravi V [9] and Ojha V. K. et al.[10].
In this work, WCA has been explored to optimize the ANN in order to predict the USD to INR exchange price for 3 days, 7days and 15days ahead. The concept of WCA has been inherited and inspired from nature that is based on the process of water cycle. The WCA procedure reflects the process of flow of rivers and streams towards downhill into the sea. The present paper introduces WCA algorithm for optimizing ANN for prediction of forex prediction in time series data. The main objective of this paper is to check the performance of the WCA with other two established optimization techniques named GA and DE. The obtained results are summarized and visualized with the respective graphical representations and tabulations.
The remaining part of the paper is organized as follows. Section 2 represents the background study of the problem. Experimentation & result discussion, proposed model and result evaluation are done in section 3. Finally section 4 concludes the article with a challenging future direction.
II.LITERATURE REVIEW
The Foreign Exchange (FOREX) rate is the calculation of one countries currency in terms of another. For any countries economic growth it is one of the most important measure that calculates and affects a common man’s life expense. Hence, the prediction of FOREX rate is never underestimated and must be regarded as a paramount (Hoag and Hoag, 2002) [1]. For decades many authors criticized the technical analysis and its methodology in the studyof price movements on the market. Many drawbacks in the existing statistical methods have motivated researchers to focus more on meta-heuristic algorithms and nature inspired methods to consider them as the optimization techniques. The advantages of these optimization algorithms help to maintain a globalized optimal solution strategy with the integration of ideal models like ANN.Soni et al.[5]
Exploring the use of Water Cycle Optimization Algorithm for Foreign Exchange Prediction
techniques and artificial intelligence for the prediction of stock market movements. The author has identified ANN as a most significant machine learning technique for stock market prediction. Vucovic et al. [6] investigated and collected many historical data and designed a NN model for FOREX prediction based the movement of USD/EUR exchange rates. The empirical data used in the model of neural networks are related to the exchange rate USD/EUR in the period 23.04.2012–04.05.2012. In the financial era, genetic algorithms have shown the best combination values with suitable parameter setting for the trading rules, and they can be easily built with ANN models for designing and identify trades. Naik et al. [2] presented a GA based data mining methodology for solving the knowledge acquisition problems which are in stock market. Similarly Todor et al. [3] presented a time series model for forex prediction with the help of an ANN model trained with DE in distributed computational environment. A new optimization technique called WCA is proposed by Escander et al. in 2012 [4] for solving some constrained optimization and engineering design problems.
III.PROPOSED FOREX PREDICTION MODEL
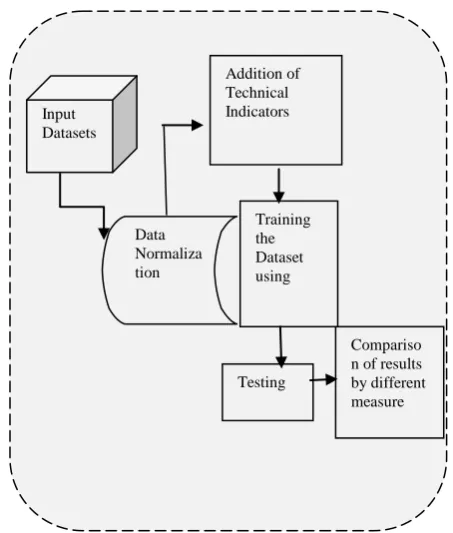
Now artificial neural network is designed. Before testing the model train the model. In this work at the end compare the actual price and predicted price by plotting the graph and performance evaluation measuring for three days, seven days and fifteen days ahead predicted price. The layout of the proposed prediction model is given in Figure 1.
[image:2.595.327.554.129.396.2]For this experiment USD to INR FOREX dataset is contains 4000 samples and 2800 of training samples and 1200 test samples. Dataset collected from [8]. In order to predict the USD to INR exchange price the details of parameter setting is also given in Table 1.
Figure 1. Schematic layout of proposed FOREX prediction model
Table 1. The Parameters Setting
ANN ANN-GA ANN-DE ANN-WCA
Number of hidden layers-1 Number of nodes in the hidden layers-5
Alfa-0.1
Number of Iteration-50
Population size-50 Iteration-50
Selection operator- Roulette wheel
Crossover rate-0.25 Mutation rate-0.1
Population size-50 Iteration-50 Crossover rate-0.8
Mutation constant/Scale factor-0.5
Population size-50 No. of River-9 No. of sea-1 dmax-0.01 Iteration-50
IV.SIMULATION AND RESULT ANALYSIS
This section explores the experimentation and the analysis of result obtained from experimentation. The proposed model is coded in MATLAB 9.1 programming software and simulations run in Intel Core i3 processor and the RAM size is 4.0GB with the Operating System of Windows 8.1 Pro. In this work dataset is normalized from collected dataset. Then for the price prediction technical indicators are calculated.
Addition of Technical Indicators
Compariso n of results by different measure Training
the Dataset using
Testing Input
Datasets
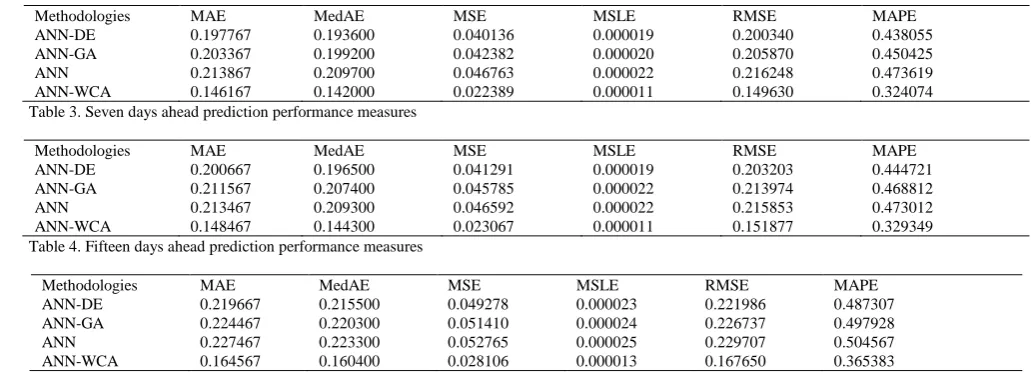
In this study one standard benchmark dataset has been used for exchange rate prediction that is USD to INR from which 2800 are training samples and 1200 are test samples. A network structure is created using ANN which has been trained using GA, DE, and WCA for exchange price prediction for the time horizon of three days, seven days, and fifteen days. The resultant weight from the trained dataset has been tested using sample test data. The experimental result of WCA is compared with GA, DE, and ANN. From Figure 3, Figure 4 and Figure 5 it can be observed WCA predicts more close to actual exchange price and WCA is showing lower error than other three techniques such as; ANN, ANN-GA and ANN-DE with respect to Mean Absolute Error (MAE), Median Absolute Error (MedAE), Mean Square Error (MSE), Root Mean Square Error (RMSE) and Mean Average Percentage Error (MAPE).
0 200 400 600 800 1000 1200
40 41 42 43 44 45 46 47 48 49
ANN based opening price prediction of USD to INR Forex data
Time Series in Day
E xc ha ng e ra te o pe n pr ic e Predicted Actual
Figure 2. (a) 3days ahead exchange price prediction using ANN
0 200 400 600 800 1000 1200
40 41 42 43 44 45 46 47 48 49
ANN-GA based opening price prediction of USD to INR Forex data
Time Series in Day
E xc ha ng e ra te o pe n pr ic e Predicted Actual
Figure 2. (b) 3days ahead exchange price prediction using ANN-GA
0 200 400 600 800 1000 1200
40 41 42 43 44 45 46 47 48 49
ANN-DE based opening price prediction of USD to INR Forex data
Time Series in Day
E xc ha ng e ra te o pe n pr ic e Predicted Actual
Figure 2. (c) 3days ahead exchange price prediction using ANN-DE
0 200 400 600 800 1000 1200
40 41 42 43 44 45 46 47 48 49
ANN-WCA based opening price prediction of USD to INR Forex data
Time Series in Day
E xc ha ng e ra te o pe n pr ic e Predicted Actual
Figure 2. (d) 3days ahead exchange price prediction using ANN-WCA
0 200 400 600 800 1000 1200
40 41 42 43 44 45 46 47 48 49
ANN based opening price prediction of USD to INR Forex data
Time Series in Day
Ex ch an ge ra te o pe n pr ic e Predicted Actual
Figure 3.(a) 7days ahead exchange price prediction using ANN
0 200 400 600 800 1000 1200
40 41 42 43 44 45 46 47 48 49
ANN-GA based opening price prediction of USD to INR Forex data
Time Series in Day
Ex ch an ge ra te o pe n pr ic e Predicted Actual
Figure 3. (b) 7days ahead exchange price prediction using ANN-GA
0 200 400 600 800 1000 1200
40 41 42 43 44 45 46 47 48 49
ANN-DE based opening price prediction of USD to INR Forex data
Time Series in Day
E xc ha ng e ra te o pe n pr ic e Predicted Actual
Exploring the use of Water Cycle Optimization Algorithm for Foreign Exchange Prediction
0 200 400 600 800 1000 1200
40 41 42 43 44 45 46 47 48 49
ANN-WCA based opening price prediction of USD to INR Forex data
Time Series in Day
E xc ha ng e ra te o pe n pr ic e Predicted Actual
Figure 3. (d) 7days ahead exchange price prediction using ANN-WCA
0 200 400 600 800 1000 1200
40 41 42 43 44 45 46 47 48 49
ANN based opening price prediction of USD to INR Forex data
Time Series in Day
Ex ch an ge ra te o pe n pr ic e Predicted Actual
Figure 4. (a) 15days ahead exchange price prediction using ANN
0 200 400 600 800 1000 1200
40 41 42 43 44 45 46 47 48 49
ANN-GA based opening price prediction of USD to INR Forex data
Time Series in Day
Ex ch an ge ra te o pe n pr ice Predicted Actual
Figure 4. (b) 15days ahead exchange price prediction using ANN-GA
0 200 400 600 800 1000 1200
40 41 42 43 44 45 46 47 48 49
ANN-DE based opening price prediction of USD to INR Forex data
Time Series in Day
Ex ch an ge ra te o pe n pr ic e Predicted Actual
Figure 4. (c) 15days ahead exchange price prediction using ANN-DE
0 200 400 600 800 1000 1200
40 41 42 43 44 45 46 47 48 49
ANN-WSA based opening price prediction of USD to INR Forex data
Time Series in Day
E xc ha ng e ra te o pe n pr ic e Predicted Actual
Figure 4. (d) 15days ahead exchange price prediction using ANN-WCA
0 5 10 15 20 25 30 35 40 45 50
0.16 0.18 0.2 0.22 0.24 0.26 0.28 0.3 0.32
3days Ahead RMSE Training
Number of Iterations
RM SE ANN ANN-GA ANN-DE ANN-W SA
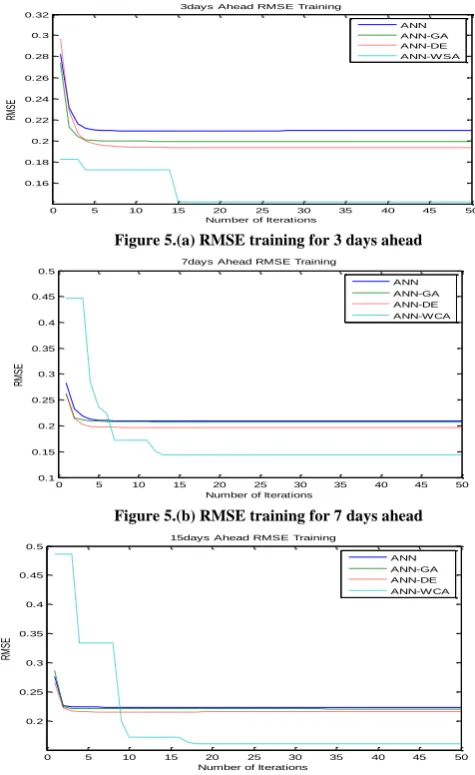
Figure 5.(a) RMSE training for 3 days ahead
0 5 10 15 20 25 30 35 40 45 50
0.1 0.15 0.2 0.25 0.3 0.35 0.4 0.45 0.5
7days Ahead RMSE Training
Number of Iterations
RM SE ANN ANN-GA ANN-DE ANN-WCA
Figure 5.(b) RMSE training for 7 days ahead
0 5 10 15 20 25 30 35 40 45 50
0.2 0.25 0.3 0.35 0.4 0.45 0.5
15days Ahead RMSE Training
Number of Iterations
RM SE ANN ANN-GA ANN-DE ANN-WCA
Figure 5.(c) RMSE training for 15 days ahead
[image:4.595.312.550.52.440.2] [image:4.595.60.289.53.188.2]The error convergence of all the methods have been plotted for 3 days, 7 days and 15 days ahead and are shown in Figure 5. From this, it can be observed that, ANN-WCA is converging at 15 number of iterations for prediction of 3 days ahead, for 7 days ahead prediction ANN-WCA is converging at 12 number of iterations, similarly, for 15 days it converges at 17 number of iterations.
[image:4.595.56.289.204.651.2] [image:4.595.58.285.224.376.2] [image:4.595.61.280.629.762.2]Table 2. Three days ahead prediction performance measures
Methodologies MAE MedAE MSE MSLE RMSE MAPE
ANN-DE 0.197767 0.193600 0.040136 0.000019 0.200340 0.438055
ANN-GA 0.203367 0.199200 0.042382 0.000020 0.205870 0.450425
ANN 0.213867 0.209700 0.046763 0.000022 0.216248 0.473619
[image:5.595.36.552.79.266.2]ANN-WCA 0.146167 0.142000 0.022389 0.000011 0.149630 0.324074
Table 3. Seven days ahead prediction performance measures
Methodologies MAE MedAE MSE MSLE RMSE MAPE
ANN-DE 0.200667 0.196500 0.041291 0.000019 0.203203 0.444721
ANN-GA 0.211567 0.207400 0.045785 0.000022 0.213974 0.468812
ANN 0.213467 0.209300 0.046592 0.000022 0.215853 0.473012
ANN-WCA 0.148467 0.144300 0.023067 0.000011 0.151877 0.329349
Table 4. Fifteen days ahead prediction performance measures
Methodologies MAE MedAE MSE MSLE RMSE MAPE
ANN-DE 0.219667 0.215500 0.049278 0.000023 0.221986 0.487307
ANN-GA 0.224467 0.220300 0.051410 0.000024 0.226737 0.497928
ANN 0.227467 0.223300 0.052765 0.000025 0.229707 0.504567
ANN-WCA 0.164567 0.160400 0.028106 0.000013 0.167650 0.365383
V.CONCLUSION
In this work, an ANN and WCA based foreign exchange prediction method has been proposed. The proposed strategy has been compared with ANN, ANN-DE, ANN-GA and also validated through various performance measures. From the experimentation it can be observed that, the proposed strategy outperforms other traditional and optimized and hybridized methodologies compared with. The validation measures also shows the better performance of proposed ANN-WCA strategy with respect to other methods.
REFERENCES
1. Ojha V. K., Abraham A., Snášel V.,“Metaheuristic design of
feedforward neural networks: A review of two decades of
research”,Engineering Applications of Artificial
Intelligence,(2017),pp.7-116.
2. Pradeepkumar D., Ravi V., “Soft Computing Hybrids for FOREX
Rate Prediction: A Comprehensive Review”,Computers& Operations Research,(2018),pp.262-284.
3. http://in.investing.com/currencies/usd-inr-historical-data
4. Das S. R., Mishra D., Rout M., “A hybridized ELM-Jaya forecasting
model for currency exchange prediction”, Journal of King Saud
University-Computer and Information Sciences,(2017), pp. 1-21.
5. Vukovic D., “ Forexpredicton with neural network: usd/eur currency
pair”, Vol. 10,(2013), pp. 251-261.
6. Soni S., “Applications of ANNs in Stock Market Prediction: A
Survey”, 2005.
7. Eskandar H., Sadollah A., Bahreininejad A., Hamdi M., “Water cycle
algorithm – A novel metaheuristic optimization method for solving
constrained engineering optimization problems”, Computers and
Structures,Vol. 110–111, (2012), pp. 151–166.
8. Todor B., Iliyan Z, Nina D, “Time Series Prediction by Artificial
Neural Networks and Differential Evolution in Distributed
Environment”, Large scale scientific computing, 8th international
comference,( 2011), pp. 198-205.
9. Naik R. L., Ramesh D., Manjula1 B. ,Govardhan A., “ Soft computing
hybrids for FOREX rate prediction: A comprehensive review”, Computer Engineering and Intelligent Systems,Vol 3, No.7,(2012).
10. Hoag A.J. , Hoag, J.H., Introductory Economics. World Scientific,
2002 .
AUTHORS PROFILE
Arup Kumar Mohanty received his B.Tech. degree in
Information Technology from College of Engineering and Technology, Odisha, India, in 2006; the M.Tech. degree in Computer Science and Informatics from Siksha ‘O’ Anusandhan Deemed to be University, Bhubaneswar, India, in 2013
He is an assistant professor with the department of CSIT, Siksha ‘O’ Anusandhan Deemed to be University, Bhubaneswar, India. His research area includes soft computing, computational finance, evolutionary computing and data mining.
Debahuti Mishra received the B.Tech. degree in
computer science and engineering from Utkal University, Bhubaneswar, India, in 1994; the M.Tech degree in computer science and engineering from KIIT Deemed to be University, Bhubaneswar, Odisha, India, in 2006; and the Ph.D. degree in computer science and engineering from Siksha ‘O’ Anusandhan Deemed to be University, Bhubaneswar, India, in 2011. She is a professor with the Department of Computer Science and Engineering, Institute of Technical Education and Research (ITER), Siksha ‘O’ Anusandhan Deemed to be University, Bhubaneswar, India. Her research interests include data mining, data acquisition, bioinformatics, software engineering, soft computing, financial market prediction and machine learning. Under her supervision 10 Ph.D. scholars are awarded and she contributed three books and more than 150 research level papers to