Estimating the proportion of microarray probes
expressed in an RNA sample
Wei Shi
1, Carolyn A. de Graaf
1,2, Sarah A. Kinkel
1,2, Ariel H. Achtman
1, Tracey Baldwin
1,
Louis Schofield
1,2, Hamish S. Scott
3,4, Douglas J. Hilton
1,2and Gordon K. Smyth
1,5,*
1
The Walter and Eliza Hall Institute of Medical Research, 1G Royal Parade, Parkville, VIC 3052,
2
The Department of Medical Biology, The University of Melbourne, Parkville, VIC 3010, 3Institute of Medical and Veterinary Science and The Hanson Institute, Box 14 Rundle Mall Post Office, Adelaide, 4Adelaide Cancer Research Institute, The School of Medicine, University of Adelaide, SA 5000 and 5The Department of
Mathematics and Statistics, The University of Melbourne, Parkville, VIC 3010, Australia
Received October 30, 2009; Revised December 3, 2009; Accepted December 11, 2009
ABSTRACT
A fundamental question in microarray analysis is the estimation of the number of expressed probes in different RNA samples. Negative control probes available in the latest microarray platforms, such as Illumina whole genome expression BeadChips, provide a unique opportunity to estimate the number of expressed probes without setting a threshold. A novel algorithm was proposed in this study to estimate the number of expressed probes in an RNA sample by utilizing these negative controls to measure background noise. The perfor-mance of the algorithm was demonstrated by comparing different generations of Illumina BeadChips, comparing the set of probes targeting well-characterized RefSeq NM transcripts with other probes on the array and comparing pure samples with heterogenous samples. Furthermore, hematopoietic stem cells were found to have a larger transcriptome than progenitor cells. Aire knockout medullary thymic epithelial cells were shown to have significantly less expressed probes than matched wild-type cells.
INTRODUCTION
Statistical analysis of microarray gene expression experi-ments has so far focused mostly on identifying genes which are differentially expressed between different condi-tions (1,2). However, there is an even more fundamental question which has so far been largely neglected, which is to detect which transcripts are actually expressed in each sample. Understanding how the size of the transcriptome
varies with cell type and circumstance is of fundamental
biological interest (3–5). For example, does the
pluripotency of stem cells imply a greater number of distinct expressed transcripts than in committed cells (3). There are also technical implications, for example because
most microarray normalization algorithms assume
that different samples express similar numbers of tran-scripts (6).
Technologies that sequence randomly sampled tran-scripts from RNA samples provide possibilities to estimate statistically the size of the transcriptome (7,8). However, these statistical methods are heavily dependent on distributional assumptions about how expression levels vary between transcripts, and have not yet attracted widespread use. We provide instead a method for estimating the size of the transcriptome using inexpensive, readily available microarray data and making relatively few assumptions. Specifically, we propose an algorithm to estimate the proportion of probes on a whole-genome microarray that correspond to transcripts which are present in the RNA sample hybridized to a particular array. The only requirement is for a selection of good-quality negative control probes which are repre-sentative of the behavior of non-expressed probes. Throughout this article, we use the shorthand ‘expressed probe’ to mean a probe corresponding to a transcript which is expressed in the sample hybridised to that array. Commercial microarray platforms often provide detec-tion calls (present/absent) for each probe on an array (9). For example, Illumina BeadStudio software computes
a detection P-value for each probe on an Illumina
BeadChip, equal to the proportion of negative control probes which have intensities greater than that probe on the same array (10). These calls allow a subset of probes to be selected which are highly likely, based on their intensities, to be truly expressed. The situation is similar
*To whom correspondence should be addressed. Tel: +61 3 9345 2356; Fax: +61 3 9347 0852; Email: [email protected] doi:10.1093/nar/gkp1204
ßThe Author(s) 2010. Published by Oxford University Press.
This is an Open Access article distributed under the terms of the Creative Commons Attribution Non-Commercial License (http://creativecommons.org/licenses/ by-nc/2.5), which permits unrestricted non-commercial use, distribution, and reproduction in any medium, provided the original work is properly cited.
at James Cook University on October 16, 2014
http://nar.oxfordjournals.org/
for Affymetrix arrays. Affymetrix MAS 5.0 software computes a present/absent call for each probe-set on an Affymetrix GeneChip. The present/absent call is made using a Wilcoxon test for each probe set after estimating a baseline from the intensities of mismatch probes on the same array (11). Present/absent calls can be refined using probe-sequence information (12) even without mismatch information (13).
A different approach is to judge the presence/absence for each probe relative to its range of expression in a large database of expression profiles (14). This approaches accounts for differences in probe performance, but makes calls only for probes which have a full range of expression in the database.
All detection call methods yield an estimate of the pro-portion of expressed probes, simply by counting the number of probes called as detected versus those that are not. However, the approach is skewed toward finding evidence in favor of expression. The rate of false negatives, probes which are expressed but are called absent, is not controlled or estimated. BeadStudio detection calls are typically relatively stringent, so the false negative rate is likely to be large (9). MAS 5.0 present calls are less strin-gent, but the false negative rate is still unknown. Detection call methods are not generally designed or intended to call probes that are expressed at low levels.
Our aim is different and more ambitious, to estimate the proportion of all probes which are expressed, regardless of how high or low that expression level might be. Rather than making present/absent calls for individual probes, we treat the size of the transcriptome as a phenotype in its own right. Our algorithm is designed to give a consistent and approximately unbiased estimate of the total number of expressed probes, without necessarily identifying indi-vidual probes.
We applied our algorithm to the increasingly popular Illumina whole-genome expression BeadChips, for which a set of good-quality negative control probes is available. We comprehensively tested the efficacy of the algorithm on a range of different experimental scenarios that could be expected to produce groups with different trans-criptome sizes. Initial validation was performed by comparing the number of expressed probes between chip generations and for verified coding sequences versus predicted sequences. These measurements accurately por-trayed the progress in chip design and sequence annota-tion. The algorithm also effectively tracked a controlled increase in transcriptome size, which was achieved by
comparing chips generated from homogenous and
heterogenous populations. Finally, we showed that our algorithm could identify changes in transcription at the physiological level by studying differentiation stages of hemapoietic cells and the regulation of RNA transcript numbers by the thymic transcription factor AIRE.
MATERIALS AND METHODS
Algorithmic approach
The intensity distribution of regular probes on any partic-ular array is a mixture of the intensities of probes which
are expressed and those which are not expressed. We can express this as the mathematical mixture
fregðyÞ ¼0f0ðyÞ þ ð10Þf1ðyÞ
wherefregis the overall probability density function of the
intensities of regular probes, f0 the probability density
for non-expressed regular probes, f1 the probability
density for expressed regular probes andp0the proportion
of regular probes that are not expressed. The aim of this
article is to estimate 0. The corresponding cumulative
distribution function can be similarly written
FregðyÞ ¼0F0ðyÞ þ ð10ÞF1ðyÞ: ð1Þ
If the array contains a large number of good-quality negative control probes, then the empirical distribution of intensities from these probes will give a good estimate
of F0. Meanwhile, Fregcan be readily estimated from the
empirical distribution of regular probe intensities. If we
could also estimate F1(y), for any particular y, then we
could solve (1) for0.
It is natural to assume that the intensities of expressed probes are made up of background intensities and signal
intensities, i.e. if y is the intensity of a randomly chosen
expressed probe, then
y¼bþs
where b is the background intensity and s is the signal
intensity (18). Heresis a measure of the expression level
of the probe’s transcript whileb represents measurement
error arising from technical sources. It is also natural to assume that the background intensities follow the same
distribution f0 as that of non-expressed probes.
Therefore, the distributions of expressed and
non-expressed probes are related through the convolution equation
f1ðyÞ ¼
Z
f0ðbÞfsðybÞdb
or
F1ðyÞ ¼
Z
f0ðbÞFsðybÞdb ð2Þ
wherefsandFsare the probability density and cumulative
distribution functions of the signals of expressed probes. Let b1,. . .,bm be the observed intensities of negative
control probes for one array. Approximating f0in (2) by
the empirical distribution of the bigives
^
F1ðyÞ ¼
1 m
Xm
i¼1
FsðybiÞ ð3Þ
Now we need an estimator forFs.
Any plot of microarray intensities shows a very strongly right skew distribution. It is reasonable to assume that most transcripts have low levels of expression and that
higher levels of expression are progressively less
common. Therefore, we follow the previous practice of a number of several highly successful background cor-rection and normalization methods (18–21) and assume
at James Cook University on October 16, 2014
http://nar.oxfordjournals.org/
thatFscan be adequately modelled by an exponential
dis-tribution. Let y1,. . .,yn be the observed intensities of
regular probes for our array. The mean parameter
E(s) = ofFsis estimated by
^
¼yb
whereyandbare the averages of observed intensities for
regular probes and negative control probes, respectively.
This yields our estimator forp0. For anyy we estimate
^
FregðyÞ ¼
#ðyi<yÞ þ#ðyi¼yÞ=2 n
and
^
F0ðyÞ ¼
#ðbi<yÞ þ#ðbi¼yÞ=2 m
Finally we estimateF1(y) from (3), using the exponential
form forFs.
This yields an estimate of the proportion of
non-expressed probes as
^ 0ðyÞ ¼
^
FregðyÞ F^1ðyÞ
^
F0ðyÞ F^1ðyÞ
Anyyyields an estimate. In practice, we use
^
0¼^0ðbmedÞ
where bmed is the median of the negative control
intensities.
The estimated expression proportions were found to be
stable around bmed when testing on all negative control
probes (Supplementary Figure S1). All three distribution
function estimators should be accurately estimated foryin
this neighborhood.
Microarray data sets
The data sets used in this study are summarized in Table 1. Particular attention is given to data sets 2 and 4. For data
set 2, CD45
Ly51
MHCIhimTECs were isolated from
C57BL/6 Aire+/+ and Aire/mice (22). For data set 4,
C57BL/6 mouse hematopoietic stem cells are found in the Lineage- Sca1+ Kit+ (LSK) fraction of bone marrow tissue (23). Unless otherwise indicated in Table 1, all data is from in-house experiments conducted by the authors.
Data input and annotation
All microarray data was read and manipulated using the Bioconductor R software package limma (24). Probe annotation files were downloaded from Illumina web site (http://www.illumina.com).
RESULTS
Negative control intensities
[image:3.612.40.560.85.319.2]Illumina BeadChips include a set of negative control probes (10). The negative control probes have randomly permutated sequences and appear in all our investiga-tions to be a good representation of the behavior of non-expressed probes. The number of negative control probes ranges from 750 to 1600 for different types of BeadChips (different species and different versions). Each WG-6 BeadChip encompasses six arrays.
Table 1. Data sets used in this study
ID Platform Number regular
probes
Number negative controls
Experiment description
1 MouseWG-6 V1.1 46 657 1603 Six cell types: hematopoietic stem cells, CMPs, GMPs, pro DC precursors,
neutrophils and macrophages. Number of arrays per cell type: 4, 2, 1, 3, 1 and 3, respectively.
2 MouseWG-6 V1.1 46 657 1603 Two cell types: wild type and Aire knockout MHCIIhimTECs. Number of
arrays per cell type: 3.
3 MouseWG-6 V2 45 281 936 Three cell types: pro DC precursors, neutrophils and macrophages. Number
of arrays per cell type: 9, 3 and 3, respectively.
4 MouseWG-6 V2 45 281 936 Four cell types: hematopoietic stem cells, CMPs, GMPs and MEPs.
Number of arrays per cell type: 3.
5 HumanWG-6 V1 47 312 1517 Six conditions: MCF7 and Jurkat samples were mixed at six different
proportions (see Figure 4a). Number of arrays per condition: 2.
6 HumanWG-6 V1 47 312 1517 Four conditions: Universal Human Reference RNA(UHRR) and Human
Brain Reference RNA(HBRR) were mixed at four different proportions (see Figure 4b). Number of arrays per condition: 5. Published in ref. (15)
7 HumanWG-6 V2 48 687 1374 Six conditions: three subtypes of T lymphocytes taken from two patients
infected with hepatitis C virus. Number of arrays per condition: 1. Published in ref. (16)
8 HumanHT-12 48 799 759 Twelve samples. Bone marrow from seven malaria-infected and five
uninfected donors. Number of arrays per sample: 1.
9 HumanWG-6 V3 48 803 759 Four cell types: LinCD49fhiEpCAM, LinCD49fEpCAM,
LinCD49fEpCAM+and LinCD49f+EpCAM+mammary
subpopulations. Number of arrays per cell type: 3. Published in ref. (17)
at James Cook University on October 16, 2014
http://nar.oxfordjournals.org/
Figure 1 shows the intensity distributions for regular probes and negative control probes from a data set
using Illumina MouseWG-6 version 2 BeadChips
(Table 1, data set 3). There are 45 281 regular probes and 936 negative control probes in each array. On every array, the main body of negative control intensities is below the median and overlapping the lower quartile of the negative controls. The negative control probes consistently track the regular probes in the sense that an array having high regular probe intensities also has high negative control probe intensities. This pattern increases our confidence that the negative control probes provide an unbiased estimate of the background intensities. The similar pattern has been observed for other types of BeadChips.
Our algorithm estimates the proportion of expressed probes on each array, by comparing the empirical inten-sity distribution of the negative control probes with that of the regular probes. A mathematical mixture model is used to infer the intensity distribution of expressed probes, and hence to estimate the expressed proportion. In the follow-ing, we demonstrate the performance on this estimator on different data sets and on different BeadChip versions.
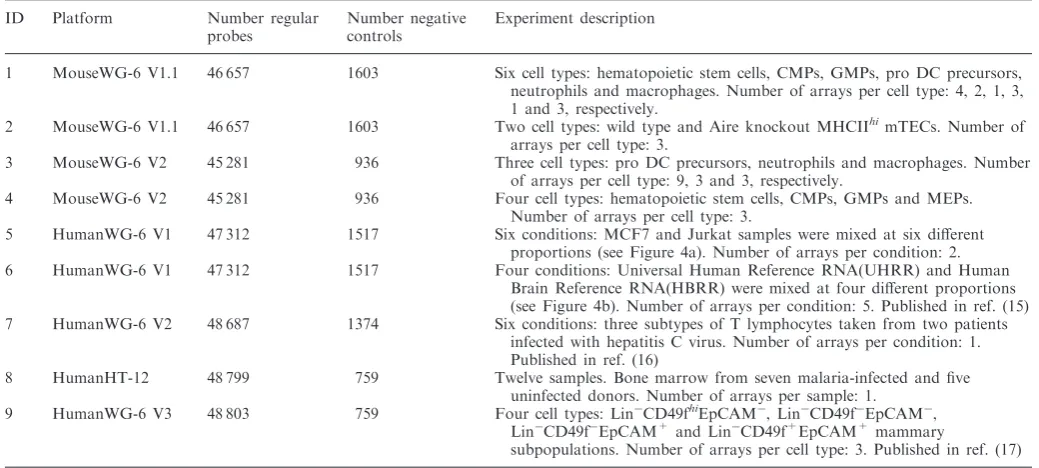
Expression proportions by platform
Figure 2 shows estimated expression proportions for all Illumina WG-6 BeadChip platforms. To make this plot, we used all arrays from all data sets described in Table 1 with a few exceptions. The thymic epithelial cells (data set 2), the reference RNA samples (data set 6) and the erythrocyte progenitors (from data set 4) were excluded, so as to make the cell types on the different platforms as
similar as possible. There is a consistent trend to higher proportions of expressed probes in later versions of both mouse and human BeadChips, presumably because of improved probe design in the later platforms. In mouse, 30% v1.1 probes were replaced in v2. In human, 82% of v1 probes were replaced or removed in v2, and a further 23% of v2 probes were replaced in v3. Our v3 BeadChips had larger expression proportions than our HT-12 BeadChips, despite having exactly the same set of probes. This may be because the v3 samples are from adult stem cells and early progenitors, which have been found to express more genes than lineage restricted cells (25,26).
Regardless of platform, far fewer probes were detected
when using BeadStudio’s detectionP-values instead of our
estimate (Supplementary Section 2). The BeadStudio detection calls are presumably less able to detect lowly expressed probes. The increasing pattern of expression proportions along the BeadChips versions was also lost (Supplementary Figure S2).
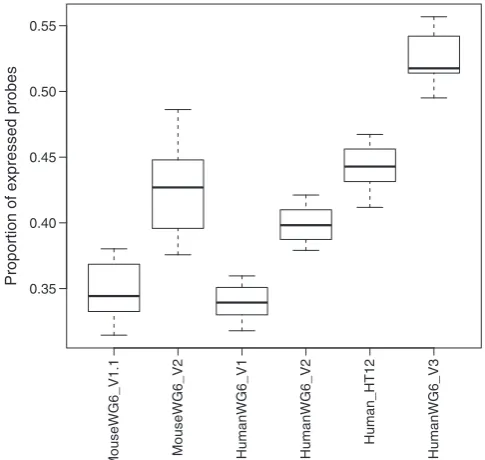
RefSeq versus non-RefSeq probes
RefSeq NM transcripts from the RefSeq database are curated mature messenger RNA transcripts that have verified coding sequences. For each BeadChip type, we divided the regular probes on the array into RefSeq NM probes and other probes, using annotation provided by Illumina. Probes designed to interrogate these transcripts are naturally more likely to be truly expressed in most samples, compared with probes designed to interrogate
MouseWG6_V1.1 MouseWG6_V2 HumanWG6_V1 HumanWG6_V2
Human_HT12
HumanWG6_V3
0.35 0.40 0.45 0.50 0.55
[image:4.612.325.568.67.297.2]Proportion of expressed probes
Figure 2. Proportions of expressed probes estimated for different BeadChip types. All data described in Table 1 are included except for datasets 2 and 6 and the erythrocyte progenitors from data set 4. For each BeadChip type, the boxes show the minimum, first quartile, median, second quartile and maximum of estimated expression propor-tions across all its arrays.
Observed intensity distribution
Arrays
log2 intensity
6
8
10
12
14
1 2 3 4 5 6 7 8 9 10 11 12 13 14 15
regular probes negative control probes
Figure 1. Intensity distributions for regular probes and negative control probes. Data from 15 arrays using Illumina MouseWG-6 version 2 was used for this plot. Numbers of regular probes and negative control probes are 45 281 and 936, respectively on each
array. Intensities are on log2scale.
at James Cook University on October 16, 2014
http://nar.oxfordjournals.org/
[image:4.612.59.302.69.301.2]predicted transcripts, and this was confirmed by our data for every BeadChip type (Figure 3).
Interestingly, the RefSeq expression proportions
were higher for human than for mouse, regardless of
BeadChips version. The difference remained when
estimating the expression proportion at the gene or tran-script level (Supplementary Section 3). At the gene level estimation, the median numbers of expressed genes in HumanWG-6 version 3 and MouseWG-6 version 2 are 14 597 and 9 467, respectively.
Mixture experiments
A microarray experiment in which pure samples are mixed at different proportions is called a mixture experiment in this study. The mixed sample, which is a mixture of the two pure samples, should have a larger proportion of expressed probes than either of the pure samples because it includes distinct transcripts from both samples. Two mixture experiments were examined here: an in-house mixture experiment and the MAQC experiment (15). In the in-house mixture experiment, MCF7 and Jurkat samples were mixed at six different proportions: 100% versus 0%, 94% versus 6%, 88% versus 12%, 76% versus 24%, 50% versus 50% and 0% versus 100% (Data set 5 in Table 1). In the MAQC experiment, UHRR and HBRR samples were mixed at four different proportions: 100% versus 0%, 75% versus 25%, 25% versus 75% and 0% versus 75% (Data set 6 in Table 1). Estimation of the expression proportion was performed on RefSeq NM probes.
As expected, almost all the mixed samples have higher proportions of expressed probes than pure samples in both our in-house mixture experiment and the MAQC
experiment (Figure 4a and b). It is interesting to see
that MAQC arrays have larger proportions of
expressed probes than arrays in our in-house mixture experiment and other arrays (RefSeq NM groups) in this study. This is not surprising because the UHRR sample consists of RNAs from 10 human cancer cell lines and therefore includes many more expressed distinct mRNA transcripts than samples in the ‘usual’ experiments.
The HBRR sample is also found to have a large pro-portion of expressed probes (73.8%). It was reported that the proportion of expressed genes in mouse brain was 80% (27). The expression proportion estimation at gene level reveals that the average proportion of expressed genes in the HBRR sample was 79.6%, which was very close to the reported proportion.
The estimated expression proportions for the mixed samples and pure samples can be used to infer the numbers of genes expressed commonly and uniquely in the two samples (see Supplementary Section 4 for details). This showed 56% of RefSeq NM probes to
be expressed in both MCF7 and Jurkat, with
2.4% uniquely expressed in Jurkat and 3.2% in MCF7 (Figure 4c). For the MAQC data, 70% of RefSeq NM probes were expressed in both UHRR and HBRR, with 3–4% uniquely expressed in each individual source (Figure 4d).
Hematopoietic stem and progenitor cells
Stem cells are unique in their ability to self renew and differentiate into mature cells. Recent work suggests that embryonic stem cells maintain their differentiation poten-tial through a unique chromatin state, that keeps lineage-specific genes poised for activation, yet is able to be permanently shut down as cells were lineage restricted and the genes would not be required (25,26). This chromatin structure, termed ‘bivalent domains’, results in expression for many lineage specific genes at a low level. Accessibility is lost during lineage restriction, correlating with a decreased number of expressed genes. Whether this is true for tissue-specific stem cells is unknown.
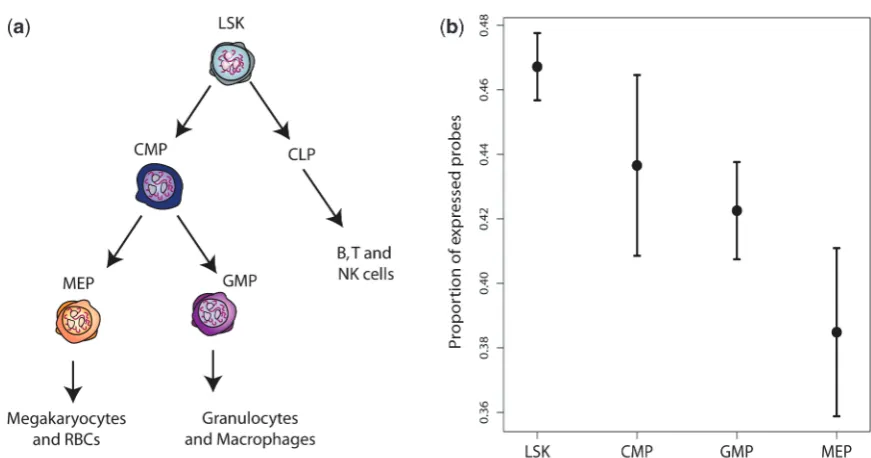
Hematopoietic stem cells (LSKs) are thought to differ-entiate into lineage restricted progenitors including common myeloid progenitors (CMPs) and common lymphoid progenitors (CLPs) (28). CMPs in turn produce more restricted progenitors including granulocyte macrophage progenitors (GMPs) and megakaryocyte erythrocyte progenitors (MEPs) (29) (Figure 5a). It has been hypothesized that hematopoietic stem cells may express a wider variety of transcripts than restricted pro-genitors, although many of these transcripts may be expressed at low levels (3). Our algorithm shows that LSK cells do indeed have a higher expression proportion than the three types of progenitor cells. More generally, increasing lineage restriction and decreasing pluripotency is associated with lower expression proportions in cells further down the family tree (Figure 5b).
0.1
0.2
0.3
0.4
0.5
0.6
0.7
Proportion of expressed probes
0.1
0.2
0.3
0.4
0.5
0.6
0.7
MouseWG6_V1.1 MouseWG6_V2 HumanWG6_V1 HumanWG6_V2
Human_HT12
HumanWG6_V3
[image:5.612.47.288.67.306.2]RefSeq NM probes Other probes
Figure 3. Proportions of expressed probes by RefSeq annotation and BeadChip type. Data are as for Figure 2.
at James Cook University on October 16, 2014
http://nar.oxfordjournals.org/
0.58
0.60
0.62
Proportion of expressed probes
100:0 94:6 88:12 76:24 50:50 0:100
(a)
0.74
0.75
0.76
0.77
Proportion of expressed probes
100:0 75:25 25:75 0:100
(b)
631 (3.2%)
11088 (56.2%)
474 (2.4%)
7537 (38.2%) MCF7 Jurkat
(c)
710 (3.6%)
671 (3.4%) 13890 (70.4%)
4459 (22.6%) UHRR HBRR
[image:6.612.128.502.68.358.2](d)
Figure 4. Expression proportion estimation for samples from two mixture experiments. (a) Estimated expression proportions for samples from the in-house mixture experiment. Jurkat and MCF7 samples were mixed at the proportions of 100:0, 94:6, 88:12, 76:24, 50:50 and 0:100. Error bars are
standard errors (n= 2). (b) Estimated expression proportions for samples used in the MAQC project. Universal Human Reference RNA(UHRR)
and Human Brain Reference RNA(HBRR) samples were mixed at the proportions of 100:0, 75:25, 25:75 and 0:100. Error bars are standard errors
(n= 5). (c) RefSeq NM probes commonly and exclusively expressed in MCF7 and Jurkat samples. (d) RefSeq NM probes commonly and exclusively
expressed in UHRR and HBRR samples.
Figure 5. Correspondence between hematopoietic stem cell differentiation tree and estimated expression proportions for different cell types.
(a) Hematopoietic stem cells differentiate into different progenitor cells. (b) Estimated proportions of expressed probes for four different cell
types. Error bars are standard errors (n= 3).
at James Cook University on October 16, 2014
http://nar.oxfordjournals.org/
[image:6.612.93.529.468.697.2]Promiscuous expression in the thymus
Effective deletion of autoreactive T cells is essential for establishing immunological tolerance and preventing autoimmune disease. Medullary thymic epithelial cells (mTECs) play a unique role in this process due to their ability to ‘promiscuously’ express a range of autoantigens that are normally restricted to peripheral tissues (30,31). The intrathymic expression of these antigens exposes thymocytes to the peripheral environment during their development and facilitates the negative selection of those cells displaying autoreactive receptors: a mechanism that has proved important in preventing autoimmunity against tissue-specific antigens (32,33,34).
The autoimmune regulator, Aire, is a transcription factor that promotes promiscuous expression in mTECs and its absence results in a reduction in the intrathymic expression of many tissue-restricted antigen genes (4,5,35). At the phenotypic level, AIRE mutations in humans
are responsible for the multi-organ autoimmune
syndrome APS-1 (36,37), which is mimicked in part by Aire-deficient mouse models (4,22,38).
The estimated proportion of expressed probes for our wild-type mTEC samples was 0.52 (standard error 0.009,
n= 3). As expected, this was greater than for other cell
types using the same platform (Figure 2). In our Aire/
mTEC samples, the proportion of expressed probes was
markedly reduced to 0.44 (standard error 0.016,n= 3).
The number of genes whose expression is activated by Aire has been reported to be in the range 200–1200 (4). This appears to be an underestimate. Our estimation at the gene level shows that there are 2006 more genes
expressed in the wild type compared with the Aire/cells.
DISCUSSION
We have validated our algorithm by showing that it can track improvements in probe design and annotation. Newer BeadChips show steadily increasing expression proportions for the same cell types as probe design is improved.
Our estimator of proportion expressed has a variety of potential applications. By examining mixed samples, we have shown that our estimator can distinguish heteroge-neous cell samples from pure samples. We were further able to determine the number of distinct transcripts uniquely expressed in each of the pure samples. We have
also demonstrated that the estimator can detect
multi-potential gene expression in stem cells, and can describe promiscuous expression associated with T-cell deletion in the thymus. The ability to quantify these effects in terms of numbers of probes, and numbers of genes, is a marked step forward in understanding these processes. We give the first quantitative demonstration that hematopoietic stem cells have a larger expressed transcriptome than more committed progenitors. In the thymus we show that twice as many genes are affected by the regulator Aire as previously reported. In the future, we plan to apply this technique across a extensive collection of hematopoietic cell lineages, to describe the process of differentiation and commitment. Comparisons
across cells in different activated states, such as naive, memory and effector T cells, is also likely to throw light on the nature of the molecular response.
The estimator can be applied to subclasses of probes. The expression proportion computed from the RefSeq annotated probes alone provides an estimate of the number of well-characterized messenger RNA transcripts that are expressed. The expression proportion computed from the unannotated probes could suggest the existence of novel messenger RNA transcripts.
The human BeadChips showed higher numbers of RefSeq genes expressed than mouse BeadChips. This is not sufficient to conclude that the human transcriptome is larger than that of mouse, because there may be differ-ences in RefSeq annotation or probe performance between the species, and the cell types profiled for the two species were not identical. Indeed the mouse results in Figure 3 exclude the thymic epithelium cells, which had the highest expression proportions of any mouse samples. However, the difference was preserved across all versions of the BeadChips, and the mouse cell types include hema-topoitetic stem cells which were expected to have larger than average transcriptomes. Apart from the universal ref-erence RNA samples, the human samples with highest expression proportions were mammary stem cells.
Our expression proportions tend to be much higher than the proportion of probes called as detected by Illumina BeadStudio detection calls. This was expected because detection calls cannot estimate probes with
low-level expression. Even more importantly, our
measure is more stable and predictable across replicate arrays, cell types and BeadChip versions. This may be
because the detection call P-values rely on an upper tail
statistic of the negative controls, a type of extreme statistic subject to relatively high variability, whereas our method uses the entire distribution of the negative controls, with greatest weight near the median.
The proportion of probes called as expressed by Illumina detection calls can be varied by choosing the
cutoff P-value higher or lower. The same is true of
Affymetrix present/absent calls. A cutoff P-value of 0.01
underestimates the expression proportion, whereas
Illumina detection calls with P=0.5 give expression
pro-portions which are much too high (data not shown). In
general, there is no P-value cutoff for the detection call
that gives a consistent estimate of the propotion expressed across all BeadStudio platforms and biological samples, because the detection call approach does not attempt to estimate the expression distribution of expressed probes.
Our results have a number of technical implications relating to microarray normalization and pre-processing. Most microarray normalization strategies assume that all the samples have transcriptomes of similar size. For example, quantile normalization is a well accepted method which assumes that the overall expression distri-bution is identical for every sample (6). These normaliza-tion methods may give unexpected and undesirable results when applied to samples with markedly different trans-criptomes. We found that, for MouseWG-6 version 2 BeadChips, expression proportions for different cell types and samples varied from a minimum of 0.38 to a
at James Cook University on October 16, 2014
http://nar.oxfordjournals.org/
maximum of 0.49, meaning that one sample could have up to 5000 more expressed probes than another (Figure 2). Knowing the proportion of expressed probes will be useful for customizing normalization strategies for different microarray experiments.
Certain popular background correction algorithms for microarray data require an estimate of the mean intensity of expressed probes (18,19,20,21). An estimate of the expression proportion could refine this estimate.
Filtering out probes which do not express in any con-dition in a microarray experiment has been demonstrated to increase the power to detect differentially expressed genes (39,40). However, lowly expressed probes, including possibly important genes such as transcription factors, may be lost if the threshold is set too high. Knowing the expression proportion for each array gives valuable guidance regarding the number of probes to filter.
Our algorithm can be readily applied to microarray platforms other than Illumina, provided that negative control probes are included that provide a good estimate of the background intensities. Affymetrix and Agilent have both included negative control probes into their latest expression platforms including Affymetrix Mouse Gene 1.0 ST Array, Agilent Whole Mouse Genome
Oligo 444k Microarray etc.
Our algorithm, utilizing the negative control probes on the array, adds another string to the bow of microarray expression analysis. The algorithm is implemented in the freely available Bioconductor R package limma (24).
SUPPLEMENTARY DATA
Supplementry Data are available at NAR Online.
ACKNOWLEDGEMENTS
We thank Shuo Li for providing data prior to publication, Matthew Ritchie and Mette Langaas for valuable discus-sions, Andrew Holloway for preparing the mixture data, Francois-Xavier Hubert for his assistance in mTEC sample preparation, Charity Law, Belinda Phipson and Di Wu for the raw data retrieval and Leming Shi for pro-viding the complete raw Illumina data generated from MAQC-I project.
FUNDING
Funding for open access charge: National Health and Medical Research Council (Program grant 490037).
Conflict of interest statement. None declared.
REFERENCES
1. Tusher,V.G., Tibshirani,R. and Chu,G. (2001) Significance analysis of microarray applied to the ionizing radiation response.
Proc. Natl Acad. Sci. USA,98, 5116–5121.
2. Smyth,G.K. (2004) Linear models and empirical Bayes methods for assessing differential expression in microarray experiments.
Stat. Appl. Gen. Mol. Biol,3, Article 3.
3. Akashi,K., He,X., Chen,J., Iwasaki,H., Niu,C., Steenhard,B., Zhang,J., Haug,J. and Li,L. (2003) Transcriptional accessibility
for genes of multiple tissues and hematopoietic lineages is
hierarchically controlled during early hematopoiesis.Blood,101,
383–389.
4. Anderson,M.S., Venanzi,E.S., Klein,L., Chen,Z., Berzins,S.P., Turley,S.J., von Boehmer,H., Bronson,R., Dierich,A., Benoist,C.
et al. (2002) Projection of an immunological self shadow within
the thymus by the Aire protein.Science,298, 1395–1401.
5. Venanzi,E.S., Melamed,R., Mathis,D. and Benoist,C. (2008) The variable immunological self: genetic variation and nongenetic
noise in aire-regulated transcription.Proc. Natl Acad. Sci. USA,
105, 15860–15865.
6. Bolstad,B.M., Irizarry,R.A., Astrand,M. and Speed,T.P. (2003) A comparison of normalization methods for high density oligonucleotide array data based on bias and variance.
Bioinformatics,19, 185–193.
7. Stern,M.D., Anisimov,S.V. and Boheler,K.R. (2003) Can transcriptome size be estimated from sage catalogs?
Bioinformatics,19, 443–448.
8. Zhu,J., He,F., Wang,J. and Yu,J. (2008) Modeling transcriptome
based on transcript-sampling data.PLoS ONE,3, e1659.
9. Archer,K.J. and Reese,S.E. (2010) Detection call algorithms for
high-throughput gene expression microarray data.Brief Bioinform,
11, 244–252.
10. Illumina. BeadStudio Gene Expression Module User Guide, 2008. www.illumina.com (16 November, 2009, date last accessed). 11. Affymetrix. Statistical Algorithms Description Document, 2002.
www.affymetrix.com/support/technical/whitepapers/
sadd_whitepaper.pdf (16 November, 2009, date last accessed). 12. Schuster,E.F., Blanc,E., Partridge,L. and Thornton,J.M. (2007)
Correcting for sequence biases in present/absent calls.Genome
Biol.,8, R125.
13. Wu,Z. and Irizarry,R.A. (2007) A statistical framework for the
analysis of mciroarray probe-level data.Ann. Appl. Stat.,1,
333–357.
14. Zilliox,M.J. and Irizarry,R.A. (2007) A gene expression bar code
for microarray data.Nat. Methods,4, 911–913.
15. MAQC Consortium. (2006) The MicroArray Quality Control (MAQC) project shows inter- and intraplatform reproducibility of
gene expression measurements.Nat. Biotechnol.,24, 1151–1161.
16. Li,S., Floess,S., Hamann,A., Gaudieri,S., Lucas,A., Hellard,M.,
Roberts,S., Paukovic,G., Plebanski,M., Loveland,B.E.et al. (2009)
Analysis of FOXP3+ regulatory T cells that display apparent viral antigen specificity during chronic hepatitis C virus infection.
PLoS Pathog.,5, e1000707.
17. Lim,E., Vaillant,F., Wu,D., Forrest,N.C., Pal,B., Hart,A.H.,
Asselin-Labat,M.L., Gyorki,D.E., Ward,T., Partanen,A.et al.
(2009) Aberrant luminal progenitors as the candidate target population for basal tumor development in brca1 mutation
carriers.Nat. Med.,15, 907–913.
18. Irizarry,R.A., Hobbs,B., Collin,F., Beazer-Barclay,Y.D., Antonellis,K.J., Scherf,U. and Speed,T.P. (2003) Exploration, normalization, and summaries of high density oligonucleotide
array probe level data.Biostatistics,4, 249–264.
19. McGee,M. and Chen,Z. (2006) Parameter estimation for the exponential-normal convolution model for background correction
of Affymetrix GeneChip data.Stat. Appl. Genet. Mol. Biol.,5,
Article 24.
20. Silver,J., Ritchie,M.E. and Smyth,G.K. (2009) Microarray background correction: maximum likelihood estimation for the
normal-exponential convolution model.Biostatistics,10, 352–363.
21. Ritchie,M.E., Silver,J., shlack,A.O., Holmes,M., Diyagama,D., Holloway,A. and Smyth,G.K. (2007) A comparison of background correction methods for two-colour microarrays.
Bioinformatics,23, 2700–2707.
22. Hubert,F.X., Kinkel,S.A., Crewther,P.E., Cannon,P.Z., Webster,K.E., Link,M., Uibo,R., O’Bryan,M.K., Meager,A.,
Forehan,S.P.et al. (2009) Aire-deficient C57BL/6 mice mimicking
the common human 13-base pair deletion mutation present with
only a mild autoimmune phenotype.J. Immunol.,182, 3902–3918.
23. Spangrude,G.J., Heimfeld,S. and Weissman,I.L. (1988) Purification and characterization of mouse hematopoietic stem
cells.Science,241, 58–62.
24. Smyth,G.K. (2005) Limma: linear models for microarray data. In Gentleman,R., Carey,V., Dudoit,S., Irizarry,R. and Huber,W.
at James Cook University on October 16, 2014
http://nar.oxfordjournals.org/
(eds),Bioinformatics and Computational Biology Solutions using R and Bioconductor. Springer, New York, pp. 397–420.
25. Mikkelsen,T.S., Ku,M., Jaffe,D.B., Issac,B., Lieberman,E., Giannoukos,G., Alvarez,P., Brockman,W., Kim,T.K., Koche,R.P.
et al. (2007) Genome-wide maps of chromatin state in pluripotent
and lineage-committed cells.Nature,448, 553–560.
26. Bernstein,B.E., Mikkelsen,T.S., Xie,X., Kamal,M., Huebert,D.J.,
Cuff,J., Fry,B., Meissner,A., Wernig,M., Plath,K.et al. (2006) A
bivalent chromatin structure marks key developmental genes in
embryonic stem cells.Cell,125, 315–326.
27. Lein,E.S.et al. (2007) Genome-wide atlas of gene expression in
the adult mouse brain.Nature,445, 168–176.
28. Kondo,M., Weissman,I.L. and Akashi,K. (1997) Identification of clonogenic common lymphoid progenitors in mouse bone
marrow.Cell,91, 661–672.
29. Akashi,K., Traver,D., Miyamoto,T. and Weissman,I.L. (2000) A clonogenic common myeloid progenitor that gives rise to all
myeloid lineages.Nature,404, 193–197.
30. Derbinski,J., Schulte,A., Kyewski,B. and Klein,L. (2001) Promiscuous gene expression in medullary thymic epithelial cells
mirrors the peripheral self.Nat. Immunol.,2, 1032–1039.
31. Gotter,J., Brors,B., Hergenhahn,M. and Kyewski,B. (2004) Medullary epithelial cells of the human thymus express a highly diverse selection of tissue-specific genes colocalized in
chromosomal clusters.J. Exp. Med.,199, 155–166.
32. Liston,A., Lesage,S., Wilson,J., Peltonen,L. and Goodnow,C.C. (2003) Aire regulates negative selection of organ-specific t cells.
Nat. Immunol.,4, 350–354.
33. Liston,A., Gray,D.H., Lesage,S., Fletcher,A.L., Wilson,J., Webster,K.E., Scott,H.S., Boyd,R.L., Peltonen,L. and
Goodnow,C.C. (2004) Gene dosage–limiting role of Aire in thymic expression, clonal deletion, and organ-specific
autoimmunity.J. Exp. Med.,200, 1015–1026.
34. DeVoss,J., Hou,Y., Johannes,K., Lu,W., Liou,G.I., Rinn,J., Chang,H., Caspi,R.R., Fong,L. and Anderson,M.S. (2006) Spontaneous autoimmunity prevented by thymic expression of a
single self-antigen.J. Exp. Med.,203, 2727–2735.
35. Derbinski,J., Gbler,J., Brors,B., Tierling,S., Jonnakuty,S., Hergenhahn,M., Peltonen,L., Walter,J. and Kyewski,B. (2005) Promiscuous gene expression in thymic epithelial cells is regulated
at multiple levels.J. Exp. Med., 202, 33–45.
36. The Finnish-German APECED Consortium. (1997) An autoimmune disease, APECED, caused by mutations in a novel
gene featuring two phd-type zinc-finger domains.Nature,17,
399–403.
37. Nagamine,K., Peterson,P., Scott,H.S., Kudoh,J., Minoshima,S., Heino,M., Krohn,K.J., Lalioti,M.D., Mullis,P.E.,
Antonarakis,S.E.et al. (1997) Positional cloning of the APECED
gene.Nat. Genet.,17, 393–398.
38. Ramsey,C., Winqvist,O., Puhakka,L., Halonen,M., Moro,A., Kmpe,O., Eskelin,P., Pelto-Huikko,M. and Peltonen,L. (2002) Aire deficient mice develop multiple features of APECED
phenotype and show altered immune response.Hum. Mol. Genet.,
11, 397–409.
39. Hackstadt,A.J. and Hess,A.M. (2009) Filtering for increased
power for microarray data analysis.BMC Bioinformatics,10, 11.
40. Shi,W. and Smyth,G.K. (2009) Illumina WG-6 BeadChip strips
should be normalized separately.BMC Bioinformatics,10, 372.
at James Cook University on October 16, 2014
http://nar.oxfordjournals.org/