Available online:http://internationaljournalofresearch.org/ P a g e | 263
Image Denoising Using Bilateral Filter with Spea2
Optimized Parameters
1
L V Santosh Kumar Y;
2A Murali;
3M Yashaswini;
4S. Neelima Durga &
5S Hareesh
1,2Faculty, Department of Electronics and Communication Engineering
3, 4,5
B.Tech Student, Department of Electronics and Communication Engineering
1,2,3, 4,5
Raghu Engineering College, Visakhapatnam, A.P, India
ABSTRACT
The main objective of this paper is Image Denoising while preserving edges. Denoising is often a necessary and the first step to be taken before the images data is being analyzed. Unfortunately, the images captured especially from the satellites are affected by noise which reduces the image quality. There are several reasons for this noise. They are heat generated electrons, wrong ISO settings, bad sensors, vibrations and
clouds. The main aim of image Denoising is to
achieve both noise reduction as well as the feature preservation. To achieve this objective, bilateral filter is being used which is a non-linear,
edge-preserving and noise-reducing smoothing filter
especially for images. It has two parameters namely; domain sigma and range sigma which is user defined having a predefined range[7].There are several various algorithms to achieve this image Denoising and image enhancement. In this paper, Improved Strength Pareto Evolutionary Algorithm (SPEA2) is implemented which has shown very good performance over other multi objective evolutionary algorithms like Strength Pareto Evolutionary Algorithm (SPEA) and
Evolutionary Multi objective Optimization
(EMO).In contrast to SPEA2, EMO does not have the features like fitness assignment, the density estimation and the archive truncation process. It also differs with SPEA as there is no single multi
objective solution and has a multiple set of solutions called as Pareto efficient. SPEA2 has four Objective function named as Mean Square Error (MSE), Entropy, Structural Similarity (SSIM) and Second Derivative. In this paper, these four objective functions are used which can be defined as; Mean Square Error(MSE) is regarded as a measure of signal quality. It can be defined as the square of the difference between the noise free image and the de- noised image. Entropy is a statistical measure of randomness or disorder of the image. It is the difference between the noise free image and the Denoised image. Structural Similarity(SSIM) is used for measuring the similarity between two images. It measures the similarities of the structures between the noise free image and the Denoised image. Second Derivative can be used to detect the edges in the image. It is the convolution of the Laplacian mask and the Denoised image. This algorithm with the objective functions and the bilateral filter are implemented in MATLAB and the results of the work are represented graphically.
Available online:http://internationaljournalofresearch.org/ P a g e | 264
I. INTRODUCTION
Digital images play an important role both in daily life applications such as satellite television, magnetic resonance imaging, Computer tomography as well as in areas of research and technology such as geographical information systems and astronomy. Satellite images provide valuable information for various organizations and governmental agencies. But unfortunately, the images which are being captured from the satellites are sometimes not good. Image quality is a characteristic of an image that measures the image degradation. The image quality is being degraded due to the presence of the noise. Noise represents unwanted information which deteriorates the quality of the images. Data sets collected by image sensors are generally contaminated by noise. There are different sources of noise in a digital image. The sources are heat generated electrons, bad sensor, wrong ISO settings, vibration and the clouds. Dark current noise is due to the thermally generated electrons at sensing sites which is proportional to the exposure time and highly dependent on the sensor temperature.
Thus, the main objective of this paper is to remove the noise with fine preservation. To achieve this, an image enhancement filter is selected named as Bilateral Filter [4]. A Bilateral filter is a non-linear, edge-preserving & noise reducing smoothing filter for images. It is a simple and non-iterative filter which makes the parameters easy to set since their effect is not cumulative over several iterations. It has two parameters namely; domain sigma and range sigma which is user defined having a predefined range [7].To obtain the best optimized parameter set Improved Strength Pareto Evolutionary Algorithm (SPEA2) is used [6]. SPEA2 has gained advantages over other algorithms like Strength Pareto Evolutionary
Algorithm (SPEA) and Evolutionary Multi objective Optimization (EMO). SPEA2 has features like fitness assignment, density estimation and archive truncation[2]. Even it has multiple set of solutions called as Pareto efficient instead of single optimal solution. The SPEA2 has four objective parameters namely mean square error (MSE), entropy, structural similarity (SSIM) and second derivative. Each of these objective functions is further explained in next sections. All these objective functions are implemented in the MATLAB along with the Bilateral Filter and the results are represented graphically to show the effectiveness.
The organization of this paper is as follows; in the Section II the Bilateral filter is discussed and in the Section III SPEA2 Algorithm is described, in the Section IV four Objective Functions are discussed along with the mathematical formulas and in the Section V various tests are conducted and its results are represented graphically. Finally, in the Section VI inferring from obtained results the paper has been concluded.
II. BILATERAL IMAGE FILTER
Available online:http://internationaljournalofresearch.org/ P a g e | 265
domain and range filtering is termed as bilateral filtering[7].
The equation of the bilateral image filter is given as;
Where f(x) is the input image h(x) is the output image
„x„ represents the coordinates and „w‟ represents the neighborhood of the pixel of x.
Spatial and Intensity domains are represented as c() and s() convolution kernels and the integral is computed for w.
Normalization factor „k‟ is computed as;
c() and s() kernels are given as;
The values of and are user defined based on how close the pixel neighbors can be considered and how close the neighbors intensity pixels can be considered.
This filter has shown to be an effective image denoising technique. Domain filtering enforces the closeness by weighing the pixel values with coefficients that fall off with distance. The range filtering averages image pixel values with weights that decay with dissimilarity. The range filters are non-linear because their weights depend on image intensity or color. The bilateral filter can be easily applied to the color images as applied to the gray
scale images. This filter has various advantages like; it is easy to implement as it is non- iterative and easy to understand as it is the weighted mean of nearby pixels.
III. IMPROVED STRENGTH PARETO
EVOLUTIONARY ALGORITHM
(SPEA2)
The Improved Strength Pareto Evolutionary Algorithm (SPEA2) was developed by Zitzler and Thiele in 1999[2]. The reason for developing this algorithm is for finding the Pareto optimal solution set in a multi objective optimization problem. In this paper, SPEA2 is presented which eliminates the potential weaknesses of other multi evolutionary algorithms. SPEA2 has shown its efficient performance over the Strength Pareto Evolutionary Algorithm (SPEA) and Evolutionary Multi Objective Algorithm (EMO) [6].
The main differences of SPEA2 in comparison to the SPEA are:
An improved fitness assignment scheme is used, which takes for each individual into account how many individuals it dominates and it is dominated by.
A nearest neighbor density estimation technique is incorporated which allows a more precise guidance of the search process.
A new archive truncation method that guarantees the preservation of the boundary solutions.
SPEA2 also overcomes the disadvantage existing in the case of Evolutionary Multi objective Optimization (EMO). SPEA2 enables finding several members of the Pareto-optimal set in a single run instead of performing a series of separate runs [5].
1
( )
( )
( ) ( , ) ( ( ), ( ))
h x
k x
f w c x w s f x f w dw
( )
( , ) ( ( ), ( ))
k x
c x w s f x
f w dw
2 2
( , )
cx w
c x w
e
2 2 (( ( ) ( ))( ( ), ( ))
sf x f w
s f x f w
e
Available online:http://internationaljournalofresearch.org/ P a g e | 266
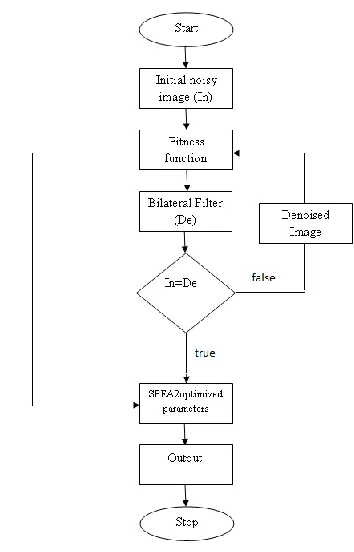
Figure 1: SPEA2 flow chart
IV. OBJECTIVE FUNCTIONS
In this work four different objective functions are considered namely, Mean Square Error (MSE), Entropy, Structural Similarity (SSIM) and Second Derivative. These four objective functions are implemented with the SPEA2 Algorithm. At the same time two of these objective functions are considered as group and are implemented in various test cases. In this section four of these objective functions are described.
IV.I Mean Square Error (MSE)
MSE is one of the objective functions which is used to measure the image quality. It is considered as the image quality assessment function. Mean Square Error can be defined as the average of the squared difference between the noise free image and the Denoised image. It is computed pixel-by-pixel by adding up the squared differences of all
the pixels and dividing by the total pixels count. It is an easily computable quantity for the quality assessment.
Let is the noise free image and
̅̅̅̅̅̅ is the denoised image with the size of
MxN where 0 ≤ x ≤ M-1 and 0 ≤ y ≤ N-1. The Mean Square Error can be calculated as;
∑ ∑ ̅̅̅̅̅̅
IV.II Entropy
Entropy is the statistical measure of randomness or disorder of the image. It is the difference between the noise free image and the Denoised image. Lower entropy value is always preferred.A low entropy system occupies a small number of grey levels which the individual pixel can adopt, while a high entropy system occupies a large number of grey levels which the individual pixel can adopt. If all of the pixels have the same value, the entropy of the image is zero.If the entropy of the image is decreased, so is its information content which means that full gray scale image has high entropy, a threshold binary image has low entropy and single-valued image has zero entropy. The Entropy of the difference image ̅̅̅̅̅̅
can be calculated as;
∑
Where; E- Entropy
Available online:http://internationaljournalofresearch.org/ P a g e | 267 IV.III Structural Similarity (SSIM)
Structural Similarity (SSIM) is based on the idea that the human visual system is highly adapted to process structural information and this attempt to measure the change in this information between the reference and the distorted image. The images which are captured by the satellites may have different structures and the human eye is sensitive to those structures. This SSIM is based on the difference between the structures of the noise free image and the structures of the Denoised image [3].
SSIM measures the features like change in luminance, contrast, and structure in an image. Luminance is modeled as the average pixel intensity of the image. Contrast can be given as the variance between the reference noise free image and the denoised image. The third feature structure similarity can be defined as the cross- correlation between the two images noise free and the denoised images. The resulting values are combined (using exponents referred to as alpha, beta and gamma) and are averaged to generate a final SSIM index value.
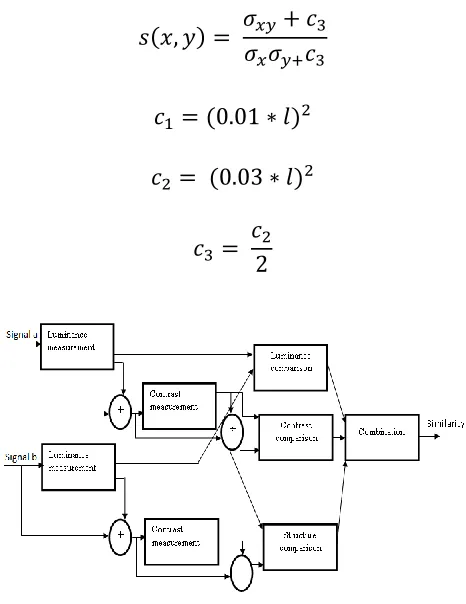
The below figure represents the SSIM Measuring System.
The general equation for SSIM is given as;
SSIM(x, y) =
The luminance comparison function l(x,y) is a function of and .
Where
The contrast comparison function c(x,y) is a function of and .
The structure comparison function is given as;
Figure 2: Structural Similarity
IV.IV Second Derivative
Available online:http://internationaljournalofresearch.org/ P a g e | 268
detect the edges. The second derivative measures the gray level in the image. The lower inverse of standard deviation value gives the more edge preserved denoised image.
The Laplacian mask used in this work is given as:
[
]
V. TESTS AND RESULTS
In this work, bilateral filter is implemented for the satellite images to remove the noise and preserve the edges. This filter has two parameters predefined from the user side named as domain sigma and range sigma. In this work, the SPEA2 Algorithm is implemented with the four defined objective functions. This algorithm optimizes these parameters to obtain the noise free images. Here, three test cases are conducted in order to obtain the optimized parameter values. At a time two of the
objective functions are considered as a group. The bilateral filter optimizes the two parameters
domain parameter and range parameter. These values are ranging from 1 to 9 which are defined by the user. In the test cases, each test gives several Pareto fronts to the user. Out of these multiple solutions named as Pareto fronts, the best value from the set which shows the image with good appearance is selected.
From each test case, a parameter set is selected and the average of these sets was implemented for the denoising process and is implemented in the MATLAB.
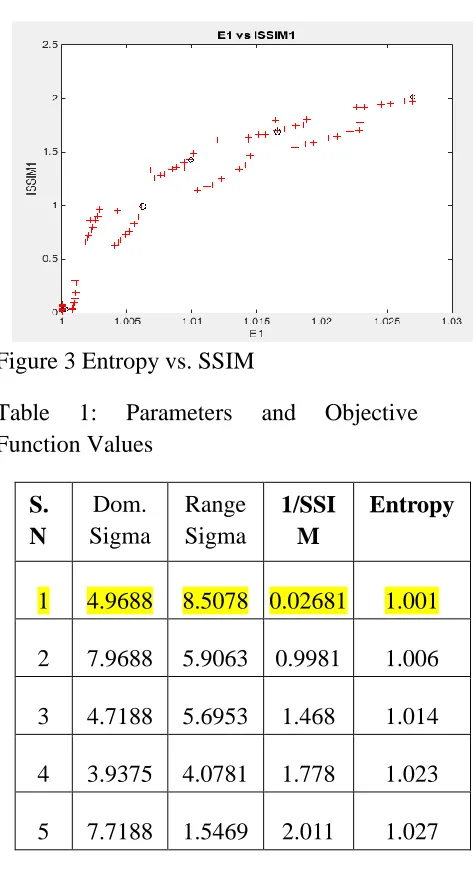
V.I Test case I: Entropy vs. 1/SSIM
In the first test case of the work, the two objective functions Entropy and 1/SSIM are selected. When these are evaluated a Pareto optimal solutions are obtained. These are evaluated and represented graphically and the best optimum 5 values are selected and marked in the graph in figure 3. The parameters and the values of the objective functions are shown in table 1.
Figure 3 Entropy vs. SSIM
Table 1: Parameters and Objective Function Values
S. N
Dom. Sigma
Range Sigma
1/SSI M
Entropy
1 4.9688 8.5078 0.02681 1.001
2 7.9688 5.9063 0.9981 1.006
3 4.7188 5.6953 1.468 1.014
4 3.9375 4.0781 1.778 1.023
Available online:http://internationaljournalofresearch.org/ P a g e | 269 V.II Test case II: Entropy vs. MSE
In this test case two the objective functions are Entropy and MSE. In the same manner 5 points are selected from the Pareto fronts and the optimized parameter values are graphically represented in figure 4. The parameters and the values of the objective functions are shown in table 2.
Figure 4: MSE vs. Entropy
Table 2 : Parameters and Objective Function Values
S. N
Dom. Sigma
Range Sigma
MSE Entropy
(E)
1 4.8438 8.9297 9.39e-05 1.0146
2 5.0313 5.6250 2.90e-05 1.509
3 7.4688 4.4648 6.67e-06 1.1465
4 1.3438 3.8672 0.001151 1.1476
5 7.0625 1.3359 0.001417 0.1173
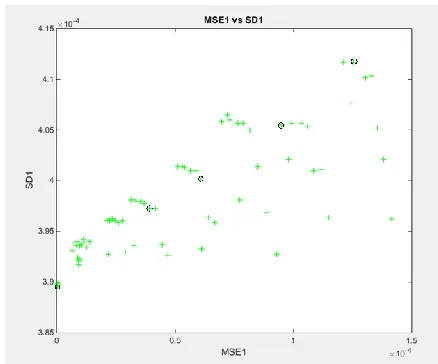
V.III Test case III: 1/SD vs. MSE
The objective functions of this test are 1/SD and MSE. Out of the obtained Pareto fronts best 5
points are selected. These selected points are represented graphically in figure4. The parameter values and the objective function values are shown in table 3.
Figure 5: MSE vs. Second Derivative
Table 3: Parameters and Objective Function Values
S. N
Dom. Sigma
Range Sigma
MSE SD
1 4.8438 8.9297 3.77e-07 0.000389
2 5.0313 5.625 4.16e-05 0.000397
3 7.4688 4.4648 8.49e-05 0.000401
4 1.3438 3.8672 0.000115 0.000396 5 7.0625 1.3359 0.001332 0.000413
Table 4: Final optimized values
S N
Do m. Sig ma
Rang e Sigm
a
Ent rop y
MS E ( e-3)
1/ SSIM
Available online:http://internationaljournalofresearch.org/ P a g e | 270
1 5.6250 6.2578 1.767 0.002 1.012 0.036
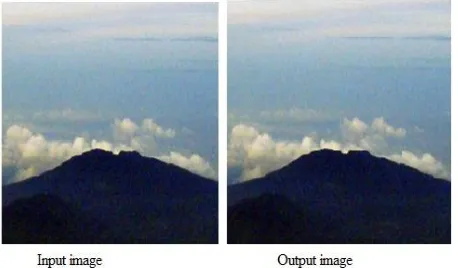
Figure 6: Obtained images for domain sigma=4.9688 and range sigma=8.5078
Figure 7: Obtained images for domain sigma=7.0625 and range sigma=1.3359
Figure 8: Obtained images for domain sigma=7.0625 and range sigma=1.3359
Figure 9: Obtained images for final domain sigma=5.6250 and range sigma=6.2578
The above images shown in figure 6, figure 7 and figure 8 are for the selected domain sigma and range sigma values and the final obtained image in figure 9 is for the average values of domain sigma=5.6250 and range sigma=6.2578 which are shown in table 4.
VI. CONCLUSION
Available online:http://internationaljournalofresearch.org/ P a g e | 271
denoising, the output image is applied to SPEA2 optimized parameters to obtain the best domain and range sigma values. In SPEA2 parameters Laplacian mask is used in second derivative. The SPEA2 parameters are compared separately as shown in section V. From the tabular readings and output image quality, we obtained the best domain and range sigma values which can be used for any other images to obtain best optimized image quality. It can be applied for both black and white image as well as color image. It has applications in satellite image denoising, image smoothing etc.
REFERENCES
[1] Tomasi R. Manduchi,”Bilateral filtering for gray and color images”, proceedings of 1998 IEEE International Conference on Computer Vision, pp.839-846, 1998.
[2] Zitzler.E and L. Thiele, “Multi objective evolutionary algorithms: A comparative case study and the strength Pareto approach,” IEEE transactions on Evolutionary Computation Vol. 3 No. 4, pp.257-271, 1999.
[3] Z. Wang, A.C. Bovik, H.R. Sheikh, E.P. Simon celli, “Image Quality Assessment: From Error Visibility to Structural Similarity,” IEEE Transactions on image processing, Vol.13, No.4, pp.600-612, 2004.
[4] S. Paris, P. Kornprobst, J. Tumbling, F. Durand, “Bilateral Filtering: Theory andApplications,” Computer Graphics and Vision Vol. 4 No.1, 2009.
[5] E. Kugu, J.Li, “Assessment of denoising algorithms by evolving the Pareto front,” Proceedings of Capstone Conference 2009, pp.17, 2009.
[6] E. Zitzler, M. Laumanns and L. Thiele, “SPEA2: Improving the strength Pareto evolutionary algorithm,” TIK-Report 103, Department of Electrical Engineering, Swiss Federal Institute of Technology(ETH), 2001.