EUROPEAN COMMISSION
Brussels, 24.8.2010 SEC(2010) 996 final
COMMISSION STAFF WORKING DOCUMENT
Contents
1. Introduction... - 6 -
1.1. World Supply and Demand... - 6 -
1.2. World Prices ... - 7 -
1.3. Long Term Outlook ... - 7 -
2. Coal in a European Context ... - 8 -
2.1. European Overview ... - 8 -
2.2. Coal in the EU Strategic Energy Reviews ... - 9 -
2.3. Manpower in the European Coal Industry... - 10 -
2.4. European Electricity Generation... - 10 -
2.5. Emissions of CO2 from Coal in the EU ... - 14 -
3. General Considerations... - 17 -
3.1. Reserves ... - 17 -
3.2. Demand Drivers... - 21 -
3.3. Coal and Gas Prices ... - 21 -
3.4. Emissions Trading ... - 22 -
3.5. Reservoir Levels for Hydro Generation... - 23 -
3.6. Currencies ... - 24 -
3.7. Coal Derivatives and Forward Prices for Steam Coal ... - 26 -
3.8. Market Supply Structure... - 27 -
3.9. Steel Industry Developments ... - 27 -
4. Hard Coal – Production and Consumption in the EU... - 29 -
4.1. EU Production Trends ... - 29 -
4.2. EU Consumption Trends ... - 30 -
5. Coke – Production and Consumption in the EU... - 31 -
6. International Hard Coal and Coke Markets ... - 33 -
6.1. Major Hard Coal Producers ... - 33 -
6.2. Hard Coal Trade... - 35 -
6.3. Steam Coal Trade... - 36 -
6.5. Coke Trade... - 37 -
6.6. Imports to the EU... - 37 -
6.7. International Price Trends... - 40 -
6.8. Coking Coal Prices ... - 42 -
6.9. Coke Prices ... - 43 -
6.10. World Transport Infrastructure... - 44 -
6.11. Freight Considerations... - 44 -
7. Lignite and Peat – Production and Consumption ... - 46 -
7.1. World Context... - 46 -
7.2. EU Production Trends ... - 47 -
7.3. Consumption... - 48 -
7.4. Peat Production ... - 48 -
7.5. Oil Shale ... - 48 -
8. State Aid to the indigenous hard coal industry in the EU... - 49 -
9. Conclusions... - 50 -
9.1. World Context... - 50 -
9.2. European Context ... - 51 -
9.3. Coal in EU Electricity Generation ... - 51 -
9.4. EU Reserves of Coal and Lignite ... - 51 -
9.5. EU Hard Coal Production and Consumption... - 51 -
9.6. World Hard Coal Trade ... - 51 -
9.7. EU Hard Coal Imports ... - 52 -
9.8. International Coal Prices... - 52 -
Figures
Figure 1 - World Total Primary Energy Supply ... - 6 -
Figure 2 - Outlook for World Coal Demand (IEA Reference Scenario) ... - 8 -
Figure 3 - EU Solid Fuel Supply in 2008 (Million Tonnes Coal Equivalent) ... - 9 -
Figure 4 – Electricity Generation by Fuel Source 2007 ... - 12 -
Figure 5 – Electricity Generation Capacity Planned, Under Development, and Under Construction in the EU... - 14 -
Figure 6 – CO2 Emissions from Combustion of Solid Fuels ... - 15 -
Figure 7 - World Reserves of Coal ... - 18 -
Figure 8 – Europe’s Fossil Fuel Reserves Map ... - 20 -
Figure 9 - Coal and Gas Prices to UK Power Producers ... - 22 -
Figure 10 – EUETS Carbon Prices ... - 23 -
Figure 11 - Scandinavian Reservoir Levels (percent)... - 24 -
Figure 12 - Exchange Rates for Key Currencies ... - 25 -
Figure 13 – Movements in Exchange Rates ... - 26 -
Figure 14 - Historic Spot and Forward Swap Prices... - 27 -
Figure 15 – Top Ten World Steel Producers 2008 (Mt crude steel)... - 29 -
Figure 16 - EU Hard Coal Production Trends ... - 29 -
Figure 17 – EU Consumption Trends for Hard Coal (Mt)... - 31 -
Figure 18 – EU Coke Production Trends... - 32 -
Figure 19 – Hard Coal Seaborne Trade 2008 ... - 35 -
Figure 20 - World Seaborne Hard Coal Trade... - 36 -
Figure 21 – EU Import Sources ... - 38 -
Figure 22 – EU Import Volumes by Member State ... - 39 -
Figure 23 – North West Europe Steam Coal Prices... - 40 -
Figure 24 – Price of Steam Coal Imported from Third Countries ... - 41 -
Figure 26 - Spot Chinese Coke Prices ... - 44 -
Figure 27 - Spot Sea Freight Rates - Richards Bay (South Africa) to Rotterdam ... - 45 -
Figure 28 – EU Lignite Production Trends... - 47 -
Tables Table 1 – Manpower in the European Coal Industry ... - 10 -
Table 2 - Net Electricity Generation by Fuel Source 2007 (GWh) ... - 13 -
Table 3 – Emissions of CO2 in 2007 from Combustion of Solid Fuels ... - 15 -
Table 4 - European Coal Reserves (Mt) ... - 18 -
Table 5 – Growth in World Crude Steel Production... - 28 -
Table 6 – Major World Hard Coal Producers (Mt)... - 33 -
Table 7 - Price Trends in Coking Coal (US $/Tonne FOB Australia)... - 42 -
Table 8 – Major World Lignite Producers ( Mt )... - 46 -
Table 9 – State Aid 2003 – 2008 – amounts actually granted by Member States (only for the main coal aid granters in the EU- 27) or authorised by the Commission for the relevant year in million €. ... - 50 -
Annexes Annex 1 – Summary of EU-27 Data... - 53 -
Annex 2 - Supplies and deliveries in the EU of Hard Coal, Coke and Lignite in 2007 and 2008... - 55 - This document has been produced using data provided by the Member States and
observations from market participants up to the end of 2009. Where data has not been available, clearly indicated estimations have been made by the Commission services. Note that the data may differ from that of Eurostat.
1. INTRODUCTION
Article 7 paragraph (c) of the Council Regulation (EC) No 405/2003 of 27 February 2003 concerning Community monitoring of imports of hard coal originating in third countries, requires the Commission to report each year, in an appropriate form, data and information on the market in solid fuels in the Community in the preceding year together with a market outlook for the current year.1
1.1. World Supply and Demand
In 2008 total world coal production (hard coal and lignite) increased by 6.2%, continuing the growth of the last ten years, where 2008 production was 48% higher than 1998 levels.2 The following graph illustrates the long term growth in coal demand compared to other energy sources.3
Figure 1 - World Total Primary Energy Supply
0 500 1000 1500 2000 2500 3000 3500 4000 4500 19 70 19 72 19 74 19 76 19 78 19 80 19 82 19 84 19 86 19 88 19 90 19 92 19 94 19 96 19 98 20 00 20 02 20 04 20 06 20 08 M il li o n T onnes of O il E qui v a le nt
Coal Oil Gas Nuclear Hydro Comb. renew & waste
Source – IEA 2009
Hard coal production in 2008 increased by 7.4% to 5,845 million tonnes (Mt), following an increase of 4.5% in 2007. Cumulative growth since 1998
1
The Commisssion staff working document covers only the data to 2008 in comparison with 2007. The data for the previous years can be found on the following website (http://ec.europa.eu/energy/observatory/coal/report_solid_fuels_market_eu_en.htm). The information on the solid fuel market 2009 cannot be summarized before all 27 Member States have reported.
2
is 59.0%. Lignite4 production decreased by 0.4% to 951 Mt in 2008, compared to growth of 1.7% in 2007, and remains just 2.7% above the 1995 production level.
Analysis of proven hard coal and lignite reserve data indicates that, at current world production levels, there are approximately 146 years of reserves available.
Total coal demand increased by 6.8%, or 310 million tonnes coal equivalent5 (Mtce) in 2008, following a six year trend of annual increases averaging 6.3%.
Global trade in hard coal also continued to grow in 2008, albeit at a much lower pace than the previous five years, with hard coal exports up 1.6% (15 Mt) to 938 Mt following a 57 Mt increase in 2007. Steam coal exports in 2008 decreased by 1.2% to 676 Mt after 5.0% growth in 2007, whereas coking coal exports continued to show strong growth of 9.7% to 262 Mt, following growth of 10.8% in the previous year.
1.2. World Prices
The commodities boom in the early part of 2008 had a massive effect on coal prices with average CIF4 steam coal prices for the year increasing by 68% to $137.79/tonne in Europe, and by 77% to $125.42/tonne in Japan. This compared to 2007 when prices increased by 17.8% in Europe and by 12.0% in Japan. Average steam coal FOB6 prices likewise increased in 2008 – by 108.2% in Colombia, 89.6% in Indonesia, 80.5% in Australia and 72.7% in South Africa.7
Spot prices for international steam coal showed unprecedented levels of volatility. For example, the delivered price to North West Europe peaked at around $220/tonne in July 2008, before falling rapidly as a result of the world financial crisis. The price dropped below $70/tonne in January 2009 and generally traded around $70/tonne for the remainder of the year.
1.3. Long Term Outlook
In its Reference Scenario8, the IEA projects coal demand increasing to 6,981 Mtce in 2030, a 53% increase on 2007. Whilst a demand reduction is seen in
4
For the purposes of the EU statistics in all parts of the document and the attached tables, lignite, brown coal and peat are grouped together and included in a single EU total. (Production of oil shale is not included in the solid fuel totals but figures are reported later in section 7.5.)
5
IEA definition of 1 million tonne coal equivalent equals 0.7 tonnes oil equivalent, or 7 million kilocalories
6
Free on board 7
Source – IEA Coal Information 2009 8
the EU, major increases in demand are seen in India and China, as illustrated by the following chart9.
Figure 2 - Outlook for World Coal Demand (IEA Reference Scenario)
Source – IEA 2009
2. COAL IN A EUROPEAN CONTEXT
2.1. European Overview
Europe is the third largest region worldwide in terms of coal consumption, after China and the USA. In the European Union around sixty percent of consumption is derived from indigenous production, with 146 Mt of hard coal and 434 Mt of lignite produced in 2008. Production figures expressed on a common basis of tonnes coal equivalent (tce) are 123 Mtce of hard coal and 133 Mtce of lignite. Coal covers around 18% of the primary energy demands in the European Union; about 30% of power generation is based on coal.10 The chart below illustrates the contribution of indigenous hard coal and lignite, together with imported hard coal, to total EU solid fuel supply, all expressed in tonnes of coal equivalent.11
9
Source – IEA World Energy Outlook 2009 10
Figure 3 - EU Solid Fuel Supply in 2008 (Million Tonnes Coal Equivalent)
2.2. Coal in the EU Strategic Energy Reviews
In the first Strategic Energy Review the concept of the Energy Triangle was introduced, illustrated by the diagram below.
In the Second Strategic Energy Review, published in November 2008, the Commission called on Parliament and Council to welcome, inter alia, “the Commission's intention to promote the environmentally-compatible development of the EU's indigenous fossil fuel resources and to encourage the Berlin Fossil Fuel Forum to develop a concrete set of recommendations regarding the action necessary to further this objective.”
2.3. Manpower in the European Coal Industry
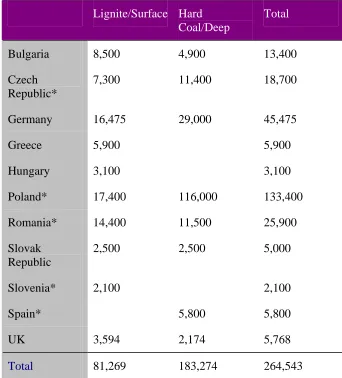
[image:10.595.154.496.186.564.2]The coal industry in Europe is a major employer, with over 250,000 employees in total. The following table shows the latest available manpower data for 2009 (except where indicated). This refers to direct employees, not including contract labour or those working in the generation sector.
Table 1 – Manpower in the European Coal Industry
Lignite/Surface Hard Coal/Deep
Total
Bulgaria 8,500 4,900 13,400
Czech Republic*
7,300 11,400 18,700
Germany 16,475 29,000 45,475
Greece 5,900 5,900
Hungary 3,100 3,100
Poland* 17,400 116,000 133,400
Romania* 14,400 11,500 25,900
Slovak Republic
2,500 2,500 5,000
Slovenia* 2,100 2,100
Spain* 5,800 5,800
UK 3,594 2,174 5,768
Total 81,269 183,274 264,543
*Euracoal data for 2008
Employment is especially important in those regions where operations are concentrated, and where they may have been present for many years. In such regions there are usually significant numbers of further employees in supporting and related industries.
2.4. European Electricity Generation
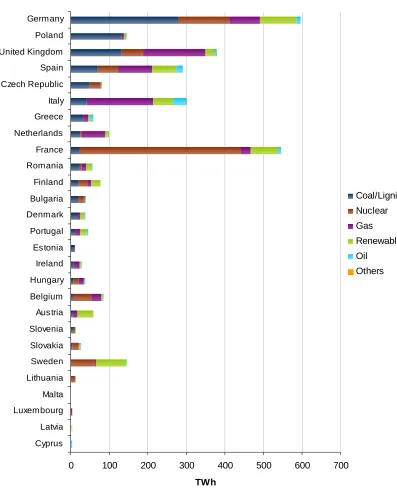
lignite, whereas in France 4% is generated from coal and 77% is nuclear 12. The split of generation for the EU 27 in 2007 was coal 29%, nuclear 28%, gas 23%, renewables 17%, oil and others 3%.
The use of hard coal and lignite in power generation in 2007, compared to other fuels, is illustrated by the following chart. This shows all the Member States, ranked by their coal usage in electricity generation.
Figure 4 – Electricity Generation by Fuel Source 2007
0 100 200 300 400 500 600 700
Cyprus Latvia Luxembourg Malta Lithuania Sweden Slovakia Slovenia Austria Belgium Hungary Ireland Estonia Portugal Denmark Bulgaria Finland Romania France Netherlands Greece Italy Czech Republic Spain United Kingdom Poland Germany
TWh
Coal/Lignite Nuclear Gas Renewables Oil
Others
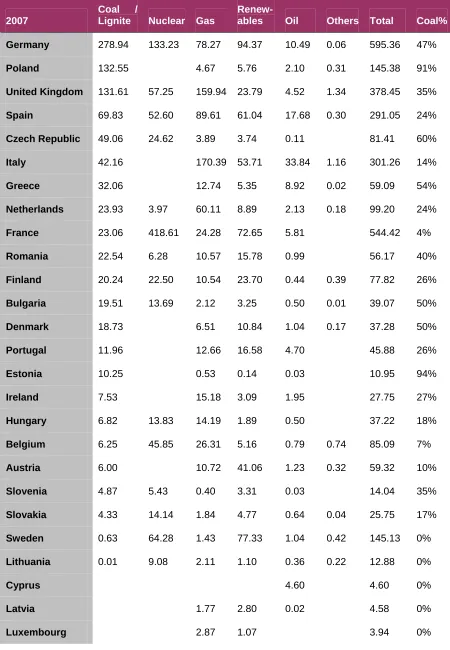
Table 2 - Net Electricity Generation by Fuel Source 2007 (GWh)
2007
Coal /
Lignite Nuclear Gas
Renew-ables Oil Others Total Coal%
Germany 278.94 133.23 78.27 94.37 10.49 0.06 595.36 47%
Poland 132.55 4.67 5.76 2.10 0.31 145.38 91%
United Kingdom 131.61 57.25 159.94 23.79 4.52 1.34 378.45 35%
Spain 69.83 52.60 89.61 61.04 17.68 0.30 291.05 24%
Czech Republic 49.06 24.62 3.89 3.74 0.11 81.41 60%
Italy 42.16 170.39 53.71 33.84 1.16 301.26 14%
Greece 32.06 12.74 5.35 8.92 0.02 59.09 54%
Netherlands 23.93 3.97 60.11 8.89 2.13 0.18 99.20 24%
France 23.06 418.61 24.28 72.65 5.81 544.42 4%
Romania 22.54 6.28 10.57 15.78 0.99 56.17 40%
Finland 20.24 22.50 10.54 23.70 0.44 0.39 77.82 26%
Bulgaria 19.51 13.69 2.12 3.25 0.50 0.01 39.07 50%
Denmark 18.73 6.51 10.84 1.04 0.17 37.28 50%
Portugal 11.96 12.66 16.58 4.70 45.88 26%
Estonia 10.25 0.53 0.14 0.03 10.95 94%
Ireland 7.53 15.18 3.09 1.95 27.75 27%
Hungary 6.82 13.83 14.19 1.89 0.50 37.22 18%
Belgium 6.25 45.85 26.31 5.16 0.79 0.74 85.09 7%
Austria 6.00 10.72 41.06 1.23 0.32 59.32 10%
Slovenia 4.87 5.43 0.40 3.31 0.03 14.04 35%
Slovakia 4.33 14.14 1.84 4.77 0.64 0.04 25.75 17%
Sweden 0.63 64.28 1.43 77.33 1.04 0.42 145.13 0%
Lithuania 0.01 9.08 2.11 1.10 0.36 0.22 12.88 0%
Cyprus 4.60 4.60 0%
Latvia 1.77 2.80 0.02 4.58 0%
Malta 2.17 2.17 0%
EU-27 922.87 885.36 723.62 541.15 106.58 5.68 3185.27 29%
Percentages 29% 28% 23% 17% 3% 0% 100%
Source – Eurostat
A significant amount of new generation capacity needs to be built in the coming years to meet increased demand and to replace ageing plants. The following chart illustrates generation capacity planned, under development and under construction, plotted to show the year it is planned to be online.13
Figure 5 – Electricity Generation Capacity Planned, Under Development, and Under Construction in the EU
Source – Platts
2.5. Emissions of CO2 from Coal in the EU
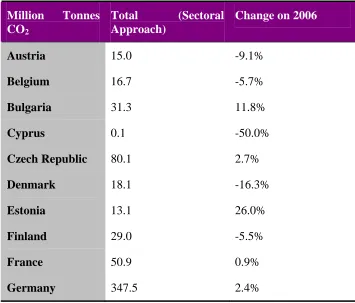
The split in estimated emissions of CO2 in 2007 from combustion of coal, lignite and peat between EU member states is illustrated by the following chart14.
13
CCS can be expected to play an important role in delivering on the joint EU objectives of secure and competitive electricity supplies and facing up to the climate change challenge which requires rapid decarbonisation of the EU energy system. It is not however likely to be applied on a wider scale in new build power plants before 2020. On the other hand, based on requirements in Article 33 of the Directive 2009/31/EC on the geological storage of carbon dioxide, all new combustion plants with a rated electrical output of 300 megawatts or more in the meantime have to be constructed as “ capture ready “.
Figure 6 – CO2 Emissions from Combustion of Solid Fuels
Source - IEA
It can be seen that the three largest emitters, Germany, Poland and the UK account for 56% of the EU’s emissions from burning solid fuels. Detailed figures are given in below.
Table 3 – Emissions of CO2 in 2007 from Combustion of Solid Fuels
Million Tonnes CO2
Total (Sectoral Approach)
Change on 2006
Austria 15.0 -9.1%
Belgium 16.7 -5.7%
Bulgaria 31.3 11.8%
Cyprus 0.1 -50.0%
Czech Republic 80.1 2.7%
Denmark 18.1 -16.3%
Estonia 13.1 26.0%
Finland 29.0 -5.5%
France 50.9 0.9%
[image:15.595.155.510.446.749.2]Greece 36.6 5.5%
Hungary 11.7 0.0%
Ireland 9.0 -7.0%
Italy 60.5 -13.3%
Latvia 0.4 17.6%
Lithuania 1.0 -6.5%
Luxembourg 0.3 -30.2%
Malta 0.0 0.0%
Netherlands 31.3 8.7%
Poland 212.4 -1.6%
Portugal 11.2 -13.5%
Romania 36.1 -1.4%
Slovakia 15.8 -2.3%
Slovenia 6.6 3.1%
Spain 78.7 13.7%
Sweden 8.9 -0.7%
UK 146.9 -6.9%
Total 1,269.2 -0.3%
Source – IEA
The IEA calculates total CO2 emissions both by the ‘sectoral approach’ (based on consumption in each sector) and by the reference approach (based on overall national fuel balances). The figures given here are from the sectoral approach, based on the total of all the sectors.
3. GENERAL CONSIDERATIONS
3.1. Reserves
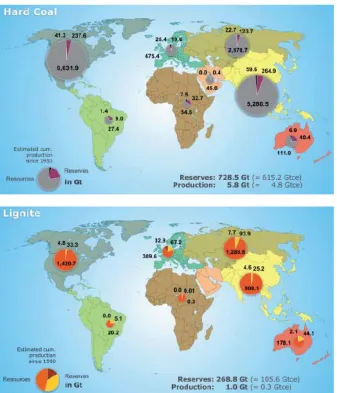
Europe possesses substantial reserves of coal and lignite, which represent around 80% of Europe’s fossil fuel reserves. There are a number of different ways of assessing these deposits, but whichever way the assessment is carried out, the figures are substantial. The World Energy Council15 gives estimates of proven recoverable reserves in Europe (at the end of 2005) of around 30 billion tonnes (Bt), including around 8.5 Bt hard coal and 21.5 Bt lignite (including sub-bituminous coal). The German Federal Institute for Geosciences and Natural Resources (BGR), which uses different classifications, gives reserves16 at the end of 2008 of 19 Bt and resources17 of 475 Bt of hard coal, and reserves of 65 Bt and resources of 302 Bt of lignite18. The following maps illustrate the world distribution of reserves of hard coal and lignite.
15
Source – World Energy Council 2007 Survey of Energy Resources 16
According to the BGR reserves are defined as the quantity that can be recovered economically from a mineral deposit at current prices with current technology
17
According to the BGR resources are defined as demonstrated quantities that cannot be recovered at current prices with current technology but might be recoverable in the future, as well as quantities that are geologically possible but have not been demonstrated
Figure 7 - World Reserves of Coal
Source – BGR Reserves, Resources and Availability of Energy Resources 2008
[image:18.595.133.470.93.486.2]The following table gives the BGR assessments of significant reserves in European states at the end of 2008.
Table 4 - European Coal Reserves (Mt)
Hard Coal
Reserves
Hard Coal
Resources
Lignite
Reserves
Lignite Resources
Austria 333
Belgium 2,115
Bulgaria 68 1,320 1,928 4,194
France 160 114
Germany 99 82,949 40,600 36,500
Greece 2,876 3,554
Hungary 276 5,075 2,633 2,704
Ireland 14 26
Italy 10 600 7 22
Netherlands 497 2,750
Poland 12,650 164,659 3,791 219,651
Portugal 3 33 33
Romania 14 2,373 408 7,947
Slovakia 97 386 83 525
Slovenia 56 39 315 341
Spain 868 3,363 319
Sweden 1 4
United Kingdom 432 186,700 1,000
EU Total 18,148 473,735 53,177 277,690
Albania 794
Bosnia Herzegovina 484 146 2,369 1,814
Croatia 300
Kosovo 1,564 9,262
Macedonia 332 300
Norway 24 68
Serbia Montenegro 544 648 7,112 13,074
Europe Total 19,200 474,597 65,348 302,440
The largest hard coal reserve is in Poland, representing 70% of the EU total. In the case of lignite, reserves are present in a swathe from Germany through Central Europe and the Balkans, to Greece. Within the EU, Germany has the largest deposit, with major reserves also in Poland, Greece, Hungary, and Bulgaria.
[image:20.595.89.464.206.646.2]A comparison between reserves of coal and lignite with other fossil fuels is illustrated by the following map19.
Figure 8 – Europe’s Fossil Fuel Reserves Map
Source – European Commission
19
3.2. Demand Drivers
Coal demand in Europe is dominated by the power sector, accounting for 69% of overall consumption in the case of hard coal and 94% for lignite. Demand is driven by a complex set of factors and constraints. The starting point is demand for electricity, which is mainly impacted by the energy intensity of the economy, the level of industrial activity, the changing behaviour of consumers, and the weather. The prime determinant of how demand for electricity can be met is the available capacity of different forms of generation.
For a given level of generation capacity, the market will broadly optimise the system, depending on competing fuel prices, the price of CO2 permits under the EU Emissions Trading System, power plant efficiencies, and environmental constraints. As a generality, hydro, nuclear and renewable generation will always run if it is available. Shortages or problems in any of these sectors are likely to lead to increased coal generation. Scandinavian reservoir levels, for example, are an important factor in coal demand in Northern Europe. Oil generation will only run in circumstances of extremely high demand or where there is no other availability.
Much coal capacity runs ‘base load’. However, at times when there is an excess of generating plant available on the system, coal and gas generation tends to compete for ‘mid-merit’ operation (i.e. during those periods when there is sufficient margin between demand and potential supply for choices to be made). The market choice between generation from coal or gas depends on the relationship between the coal price and the gas price, together with the impact on each of the carbon price, usually expressed as the difference between the ‘clean dark spread’ and the ‘clean spark spread’.
The following paragraphs deal with some of these demand drivers in more detail
3.3. Coal and Gas Prices
The dramatic increases in gas prices in the middle of the decade made coal-fired generation significantly more attractive where there is a choice of capacity, for example in the UK and in Spain. This led to high coal demand in 2006, but as gas prices reduced during 2007, coal demand fell back, and during 2008 was further constrained by environmental factors. Reducing gas prices in 2009 have made fuel-switching to gas attractive for those companies which have the ability to do so, particularly affecting coal-fired generation in the UK and Spain.
Coal and gas prices to major power producers in the UK are illustrated by the following chart.20
Figure 9 - Coal and Gas Prices to UK Power Producers
Source – DECC Energy Statistics (UK)
3.4. Emissions Trading
The second phase of the EU Emissions Trading System started in 2008 and permit prices initially ranged between €20 to €30 per tonne of CO2. However, a collapse in demand associated with the economic downturn led to a fall in values to below €10 in early 2009. Permits have since traded in a range generally between €12 and €15.
Carbon prices for the second phase are illustrated in the following chart21.
Figure 10 – EUETS Carbon Prices 0 €/t 5 €/t 10 €/t 15 €/t 20 €/t 25 €/t 30 €/t 35 €/t Ja n
20 07
Ma r -
20 07
Ma y
20 07
Jul 20
07
Se p
20 07
No v -
20 07
Ja n
20 08
Ap r -
200 8
Ju n
20 08
Au g
20 08
Oc t -
200 8
De c -
20 08
Fe b
20 09
Ap r -
200 9
Ju n
20 09
Au g
20 09
No v -
20 09
Ja n
20 10
Source – Platts
At the lower levels of CO2 prices, seen from the end of 2008, it might have been expected that coal would continue to run ahead of gas, increasing coal demand. However, this can be counteracted by a reduction in gas prices, such as has been seen during 2009.
3.5. Reservoir Levels for Hydro Generation
Reservoir levels in Spain have not been a major driver in constraining coal burn in recent years, compared to other factors such as low gas prices.
Figure 11 - Scandinavian Reservoir Levels (percent)
Minimum, maximum and median levels are for the period 1990 to 2006 Source – Nordpool
3.6. Currencies
Internationally traded coal is generally priced in US dollars. However, the relationship of the dollar to currency in the producing country is important both in setting market prices and in determining competitiveness and profitability of suppliers. For example, where the South African rand is falling against the dollar, it makes it easier for South African coals to compete and profitability increases against the same dollar price. The Currency movements against the Euro are illustrated by the following chart22.
Figure 12 - Exchange Rates for Key Currencies 0 /€ 5 /€ 10 /€ 15 /€ 20 /€ 25 /€ 30 /€ 35 /€ 40 /€ 45 /€ 50 /€
Jan
200 7
Feb
20 07
Apr
200 7
Jun
- 2007
Aug
- 20 07
Sep
- 2007
Nov
20 07
Jan
- 20
08
Mar
- 2
008
May
- 200
8
Jul
2008
Aug
200
8
Oct
2008
Dec
200
8
Feb -
200 9
Apr
- 20
09
Jun
- 2009
Jul
2009
Sep -
200 9
Nov
20 09
Dec
2009
AUD RUB USD ZAR
Source – ECB
Figure 13 – Movements in Exchange Rates 80% 90% 100% 110% 120% 130% 140% 150% 160% 170% Jan 2007 Feb - 2007
Apr - 200
7
Jun 2007
Aug - 20
07
Oct 200
7
Dec - 20
07
Feb - 2008
Apr - 200
8
Jun - 2008
Aug - 2008
Sep - 20
08
Nov - 2008
Jan - 2009 Mar - 2 009 May - 200
9
Jul 2009
Sep - 20
09
Nov - 2009
Dec - 20
09 AUD
RUB USD ZAR
Source – ECB
3.7. Coal Derivatives and Forward Prices for Steam Coal
Over recent years we have seen the emergence and rapid growth of trading in coal derivatives – ‘paper trading’ – with swaps based on indices such as API 2 (the North West Europe index) and API 4 (the South African index). The volume of trade in coal swaps is now several times greater than the physical market.
Coal swaps enable the physical and financial risks of buying coal to be de-coupled, and are used by buyers and sellers in the market to hedge transactions. The liquidity of the market in coal derivatives has been helped by the increased number of participants; banks and finance houses began to trade coal swaps in addition to the major buyers, sellers and traders. Most transactions are on an OTC23 basis, although exchange based transactions have more recently begun to gain ground.
The following chart shows the forward values of coal swaps for North West Europe as at the end of 2009, compared to historic prices.24
23
Figure 14 - Historic Spot and Forward Swap Prices
Source – McCloskey Coal Information Services
3.8. Market Supply Structure
Compared to some other commodities, the supply structure for the international coal market is extremely diverse. There is some tendency towards market concentration in all of the producing countries. However, the long-term world market prospects are also encouraging new companies into the coal export business, therefore expanding the pool of suppliers.
In the case of coking coal – above all, hard coking coal – Australia has created a strongly dominant position with almost 68% market share, which in turn is in the hands of just a few producers. However, another player – CVRD – has stepped onto the coking coal scene. CVRD is developing into another market participant through projects in Mozambique and Venezuela, as well as the entry into Australian coal mining. The significant further consolidation which would have arisen from the planned takeover of Rio Tinto by BHP Billiton is no longer in prospect.
Competition in the area of steam coal continues to be broader, and in recent years Russia and Indonesia have strengthened their position, as well as the USA returning to steam coal exports in periods of higher prices.
3.9. Steel Industry Developments
Crude steel production around the world fell by 14 Mt from 1.344 Bt to 1.330 Bt in 2008 (-1.0%), illustrated by the table below.25China produced 38% of the world’s steel and saw modest growth of 2% whilst the rest of the world suffered a decline of 3%. Estimated figures for 2009 illustrate the
effect of the financial crisis, with world steel production reducing by a further 10%. China, however, returned to strong growth (+13%) whereas the rest of the world saw a major reduction in output (-24%).
Table 5 – Growth in World Crude Steel Production
2006 2007 2008 2009 (Est)
Mt % Mt % Mt % Mt %
China 423 +19 489 +15 500 +2 566 +13
Rest of World 826 +5 855 +4 830 -3 629 -24
Total 1,249 +9 1,344 +8 1,330 -1 1,195 -10
Source – World Steel Association
During 2008 European steel production reduced by 5% compared to the previous year, with the financial crisis only taking hold in the last quarter. However, the full force of the crisis was seen in 2009 when production was estimated to be 30% down on 2008.
Following the creation of Arcelor Mittal Steel in 2006 and the acquisition of Corus Group by Tata Steel in 2007, there has been no further significant consolidation in the steel sector. The following chart shows how Arcelor Mittal produced almost as much steel as the three next-largest companies combined during 2008.26 Tata Steel fell from sixth to eighth position compared to 2007. However, it should be noted that these top ten producers only accounted for 28% of total world production.
Figure 15 – Top Ten World Steel Producers 2008 (Mt crude steel)
4. HARD COAL –PRODUCTION AND CONSUMPTION IN THE EU
4.1. EU Production Trends
Indigenous production continued its decline in 2008, with the overall trend expected to continue in 2009. The following chart shows trends for the major producing countries.
Figure 16 - EU Hard Coal Production Trends
The average calorific value of European hard coal is estimated at 24.61 GJ per tonne27. On this basis, hard coal production in 2007, expressed in
standard units of coal equivalent, was 122.6 Mtce.
In Poland production reduced by 3.8 Mt (-4.3%) to 83.7 Mt. Mines have suffered from a lack of investment in recent decades for the development of new reserves. There is no significant progress with privatisation, and the economic downturn has led to further obstacles in sourcing capital for investment. Production figures for 2009 are expected to show a further reduction to around 82 Mt. In 2008 Poland became a net coal importer for the first time (also taking into account exports to other EU member states). The largest reduction in production from 2007 to 2008, in both absolute and percentage terms, was in Germany, with production reducing by 5.0 Mt (-20.8%) to 19.1 Mt as a result of the continuing mine closure programme. This programme is planned to achieve an orderly end to German mining by 2018. Production in 2009 is expected to fall further to around 14.7 Mt.
UK production increased by 0.9 Mt in 2008 (5.6%) to 17.5 Mt. Mining companies had more success in gaining planning permission for surface mines than in recent years, and the Hatfield deep mine was reopened. Production is expected to increase by a similar margin in 2009. At the end of 2009 there were six major deep mines in operation together with a number of small underground mines and around 30 surface mines of various sizes.
Production in the Czech Republic decreased slightly in 2008 to 12.6 Mt. Coking coal accounts for around 60% of production volumes. The company, OKD, which owns the Czech mines, was planning major investments; if these plans are not realised, there is a threat of a rapid drop in production in the next few years as developed reserves are exhausted.
In Spain production reduced by 0.8 Mt to 10.2 Mt in 2008.
4.2. EU Consumption Trends
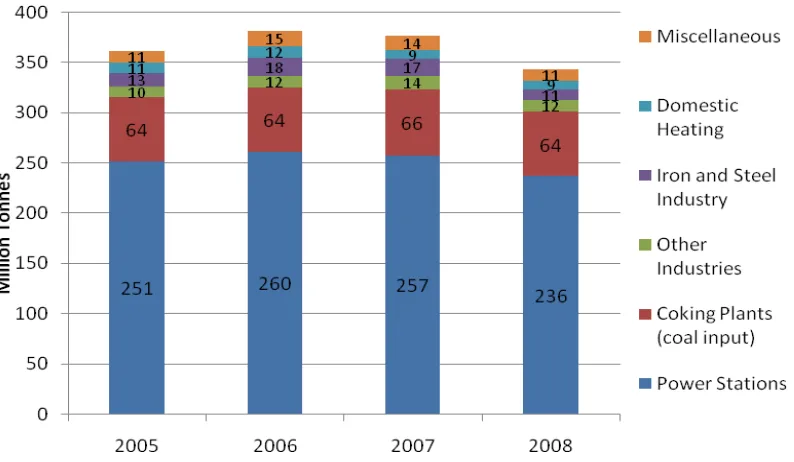
Trends in total consumption of hard coal are illustrated by the following chart.
Figure 17 – EU Consumption Trends for Hard Coal (Mt)
Total hard coal consumption was 342.9 Mt in 2008 compared to 376.1 Mt in 2007. Consumption continues to be dominated by the power sector at 69% followed by coke production at 19%. Power station consumption was down by 8.1% in 2008 compared to 2007, whilst use for coke production was down by 2.4%.
Underlying the overall reduction in power station consumption were some significant reductions in individual member states. In 2008, power station consumption reduced by 4.8 Mt (-9.3%) in the UK, by 4.4 Mt (-15.2%) in Spain and by 3.5 Mt (-6.6%) in Germany. Other significant reductions were 1.9 Mt in Poland (-4.1%), and 1.9 Mt in Finland (-34.0%). Only Italy increased its consumption for power generation, by 0.7 Mt (4.6%).
The reduced demand of 1.6 Mt from coking plants in 2008 was an early indication of the effects of the financial crisis in the steel industry, with further marked reductions expected in 2009.
5. COKE –PRODUCTION AND CONSUMPTION IN THE EU
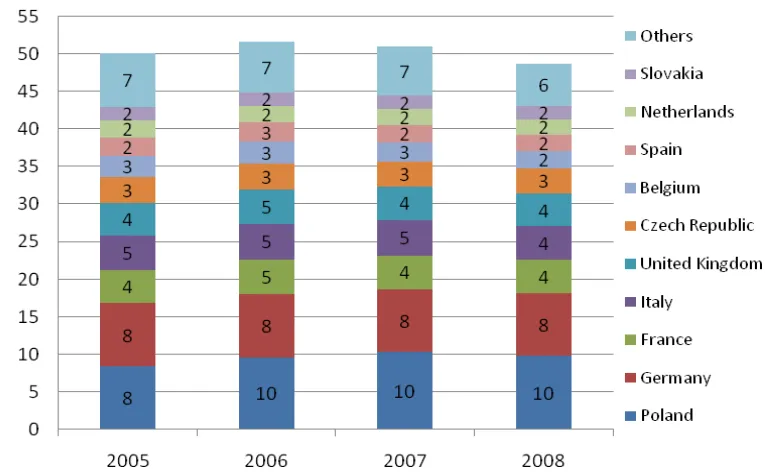
Figure 18 – EU Coke Production Trends
Total EU production of coke was 48.9 Mt in 2008 compared with 51.0 Mt in 2007, a reduction of 4.1%. Total EU consumption of coke in 2008 was 51.2 Mt compared with 53.6 Mt in 2007, a reduction of 4.5%. At 5.5 Mt, coke imports supply around 11% of the market.
6. INTERNATIONAL HARD COAL AND COKE MARKETS
6.1. Major Hard Coal Producers
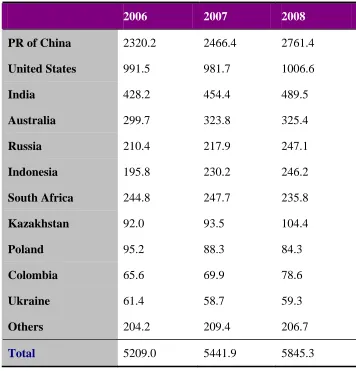
World hard coal production continued to show strong growth in 2008, despite the fourth quarter slowdown due to the global economic downturn. In fact, it showed stronger growth than the previous three years in a period encompassing seven years of record growth. It was again driven by growth in production from non-OECD countries, with a 9.9% growth in 2008, making the last four years of annual growth average 8.2%. Production increased in China, USA, India, Russia, Indonesia, Kazakhstan and Colombia, but declined in South Africa, and Poland.
[image:33.595.154.510.308.679.2]The following table shows figures for the largest producers28.
Table 6 – Major World Hard Coal Producers (Mt)
2006 2007 2008
PR of China 2320.2 2466.4 2761.4
United States 991.5 981.7 1006.6
India 428.2 454.4 489.5
Australia 299.7 323.8 325.4
Russia 210.4 217.9 247.1
Indonesia 195.8 230.2 246.2
South Africa 244.8 247.7 235.8
Kazakhstan 92.0 93.5 104.4
Poland 95.2 88.3 84.3
Colombia 65.6 69.9 78.6
Ukraine 61.4 58.7 59.3
Others 204.2 209.4 206.7
Total 5209.0 5441.9 5845.3
Source – IEA Coal Information 2009
China accounts for over 47% of world hard coal production. Output grew by 12% in 2008, accounting for 73% of the increase in world production. China’s production has more than doubled since 2000 which allows the country to meet fast growing demand for coal-fired generation and steel making. However, as a major coal exporter, China moved from the second largest hard coal exporter in 2001 to the sixth in 2008. During 2009, coal exports have fallen further, and imports are expected to show a dramatic increase, making China a major net coal importer of around 100 Mt.
Coal production in the United States increased by 2.5% in 2008 after a 1.0% fall in 2007.As well as being the second largest global hard coal producing country, the United States is the seventh largest exporter.
India is the third largest hard coal producer, and increased production by 7.7% in 2008. Although it dominates South Asian production, Indian coal contains very high ash levels, and is consumed domestically – India is increasingly dependent on imports because of its rapidly growing power requirements.
Australia remains the largest hard coal exporter, but increased production by just 0.5% in 2008, compared to an increase in production of 8.0% between 2006 and 2007.
Russia expanded its output by 13.4% in 2008, and remained the largest international coal supplier to the European Union. From 2005 it has overtaken South Africa as the world’s third largest coal exporter, and in 2008 overtook Indonesia and South Africa to become the world’s fifth largest producer.
Indonesia is the sixth largest hard coal producer but second largest exporter in the world (and the largest exporter of steam coal). Coal production continued to show strong growth, up by 6.9% in 2008.
South Africa accounts for 97% of Africa’s hard coal production but in recent years production has been fairly static or declining, and it has dropped into seventh place amongst world coal producers, and sixth place amongst exporters. Production reduced by 4.8% in 2008 compared to 1.2% growth in 2007.
Kazakhstan increased production by 11.6% in 2008 and produced more than 100 Mt for the first time since 1993. Around 30% of production is exported, mainly overland to Russia.
Poland is the only EU country to rank amongst the world’s major hard coal producers, remaining in ninth place in 2008.
6.2. Hard Coal Trade
A high proportion of world coal production is consumed within the country of origin – around 85%, and this is especially true of the two largest producers, China and the USA. Relatively small proportional changes in supply and demand in these countries can have a major impact on international market dynamics.
World hard coal trade grew by 1.3%, or 11.8 Mt, in 2008 to an estimated total of 937.8 Mt29.
The major steam coal exporting nations are Indonesia, Australia, Russia, Colombia and South Africa, whereas for coking coal the major exporters are Australia, the United States and Canada.
Major world coal trade flows are illustrated by the following diagram30
Figure 19 – Hard Coal Seaborne Trade 2008
Source – Verein der Kohlenimporteure 2009
Trends in seaborne hard coal trade are illustrated by the following chart31
29
Source IEA World Coal Information 2009 30
Figure 20 - World Seaborne Hard Coal Trade
Source – IEA Coal Information 2009
6.3. Steam Coal Trade
Total world steam coal exports decreased by 8.2 Mt (1.2%) in 2008 to 676.0 Mt.
Exports from Indonesia, Australia, Colombia, and the United States rose in 2007, whereas Russia, South Africa, China, Kazakhstan and Vietnam saw declining exports.
In 2008 Indonesia increased its steam coal market share to 25.6% of the world total. Australia, Russia, Colombia and South Africa followed with respective shares of 17.1%, 12.7% 10.9% and 9.1%.
Over the last few years, and particularly in 2008, international coal supply has been slightly tighter than historically, especially in the period 1998 to 2003. Some of this arose from producers slowing down projects following a period of excess capacity, but some of the tightness was unplanned. Infrastructure failures in Australia, South Africa’s failure to invest in new mines as the ownership of mines changed, and China’s reduced export licenses all took coal from the market.
to the Pacific market compared to the previous year. Russia also increased its supplies to the East whereas supplies to the West were stable.
The Atlantic market will decline in 2009 but the Pacific market will see renewed growth, and overall steam coal demand may not be significantly less than in 2008.
6.4. Coking Coal Trade
The world trade in coking coal increased by 6.1% to 261.8 Mt in 2008.32 Australia remained, by far, the largest exporter at 136.9 Mt, with exports up by 5.7 Mt compared to the previous year.
Early 2008 saw a dramatic tightening of the coking coal market with increasing demand coinciding with supply disruptions caused by the floods in Australia. However, towards the end of the year a slump in coking coal demand was becoming apparent because of the impact of the worldwide recession on the steel industry, and a number of major mining companies were reducing output at coking coal mines.
In 2009 a similar pattern has been seen in the steam coal market. Whereas US and European steelmakers have seen severe cutbacks, China has led a significant recovery in Asia. Nevertheless, coking coal trade is expected to suffer a reduction of up to 10% over the year.
6.5. Coke Trade
The OECD33countries’ imports of coke increased by 2.5% in 2008 to 19.1 Mt.34 Germany, the United States, Austria, Canada, Japan and France were the six major OECD coke importers in 2008, accounting for 68.9% of coke imports. Germany alone accounted for 22.7% of the OECD coke imports in 2008.
With most coke produced close to where it is used for steelmaking, international coke trade is extremely sensitive to levels of activity in the steel market. Demand for imported coke has fallen to very low levels with the economic downturn.
6.6. Imports to the EU
Imports of hard coal to the EU in 2008 of 210.6 Mt reduced by 3.2% compared to 217.7 Mt in the previous year and represented 59% of total supply. The major exporting countries to the EU were Russia (25.8%), South Africa (17.2%), the USA (14.9%), Colombia (12.8%), Australia (12.2%),
32
IEA includes coal used in coking blends and for pulverised coal injection in coking coal statistics which are not strictly coking coals
33
Indonesia (7.2%) and Canada (2.9%). In 2008 the USA overtook Colombia and Australia to become the EU’s third largest supplier.35
[image:38.595.99.495.187.397.2]The split of these imports between supplying countries is illustrated by the following chart.
Figure 21 – EU Import Sources
Russia has been the largest supplier to the EU since 2006. Amongst the major importers, the UK took 50% of its imports from Russia in 2008 and Germany took 23%. Russia was also the main supplier to most of the Eastern and South Eastern European Union member states. South Africa remained an important supplier, principally to Spain where it accounted for 27% of its imports, and also to Denmark (31%), Netherlands (24%), Germany (22%), Italy (20%) and France (17%).
Major European importing countries are illustrated by the following chart.
35
Figure 22 – EU Import Volumes by Member State
6.7. International Price Trends
[image:40.595.97.432.168.392.2]The following graph illustrates the development of spot steam coal prices delivered to North West Europe36.
Figure 23 – North West Europe Steam Coal Prices
Source – McCloskey Coal Information Services (MCIS)
The spot price levels seen in mid 2008 were completely unprecedented in international coal markets and bore no relationship to underlying costs of production and transportation. Prices to North-West Europe reached $219.35 on 4th July 2008.
Although there was some change in the fundamentals – the costs of mining and transport – associated with high oil prices, this would be insufficient to drive prices to these high levels. The massive and rapid increase in prices appeared to have been driven by a combination of tightness in the supply/demand balance, and speculation of traders in the market. Continued demand growth was coupled with a number of supply disruptions. There was also some ‘pull’ from the coking coal market where supplies were very tight following floods in Australia at the beginning of the year; some coals normally destined for the steam coal market were prepared as ‘semi-soft’ coking coals.
Whilst a correlation with oil prices has not generally been apparent in the past, very high oil prices provided opportunity for upward movement in coal prices, and it is noteworthy that coal and oil prices both peaked and fell back at around the same time in July.
The rapid fall in coal prices, as a result of the economic downturn, was even more marked than the increase earlier in the year, although it should be noted that prices ended 2008 at levels which were still high by historical standards. During 2009 prices hovered around $60/tonne in the earlier part of the year but then showed a generally upward trend as demand recovered in the Pacific market, ending the year towards $80/tonne. The weakness of the Atlantic market vis-à-vis the Pacific was illustrated by the fact that fob spot prices from Newcastle (Australia) were sometimes higher than prices delivered to North West Europe.
[image:41.595.113.479.290.548.2]Import prices for steam coal reported to the European Commission are illustrated by the following chart.
Figure 24 – Price of Steam Coal Imported from Third Countries
€ 0,00 € 20,00 € 40,00 € 60,00 € 80,00 € 100,00 € 120,00 € 140,00
2° se me
ster 200
2
1° s em
este r 200
3
2° s em
ester 20
03
1° se mest
er 20 04
2° se meste
r 20 04
1° s em
este r 200
5
2° s em
este r 200
5
1° s em
este r 200
6
2° s em
ester 2006
1° s em
este r 200
7
2° s em
este r 200
7
1° s em
este r 200
8
2° se me ster 200 8 Time A ver ag e p ri ce i n E U R /t c e
Source – European Commission
Between the second semester of 2007 and the second semester of 2008 average prices increased by 64% to €119/tce, and then fell back by 29% to €85/tce in the first semester of 2009.
6.8. Coking Coal Prices
Unlike in thermal coal markets, pricing for coking coal is largely determined in annual contact negotiations and is strongly influenced by the resulting benchmark prices which emerge during the annual negotiating round (shown in Table 7). There are no established price indices and no derivatives. This makes pricing of metallurgical coal significantly less transparent than in thermal markets. Stringent quality considerations in the coking market mean that the commodity is not sufficiently fungible to support a liquid index and derivatives-based market.
Over recent years the most significant driver of coking coal prices has been the supply/demand balance. This was clearly illustrated by events in early 2008, with major floods in Queensland, Australia. The relatively small number of suppliers of prime coking coals, together with the burgeoning demand growth, means that any perceived perturbation to the market can have major impacts on prices. The massive rise in steam coal prices also had an effect, as suppliers sought to maintain the premium on coking coal (including semi-soft and PCI), both reflecting its scarcity and the increased costs of preparation for the market.
The global recession – and the associated major downturn in steel production (see paragraph 3.9) – had a significant impact on negotiations for coking coal prices in 2009/10, although these were elevated to some degree by tonnages contracted at the higher prices for 2008/9 and not accepted for delivery by customers.
The following table illustrates the development of prices for internationally traded coking coal, based on Australian contract prices.
Table 7 - Price Trends in Coking Coal (US $/Tonne FOB Australia)
Contract Prices* 2005/6 2006/7 2007/8 2008/9 2009/10
Hard Coking Coal 125 112 96 300 129
Semi-soft Coking Coal 80 58 65 240 85
PCI 102 68 71 250 90
*April to March basis
Source – Merrill Lynch/Macquarie
Figure 25 – Price of Coking Coal Imported from Third Countries
Source – European Commission
Between the second semester of 2007 and the second semester of 2008 average prices increased by 96% to €182/tonne. Prices only fell back by 1% to €180/tonne in the first semester of 2009 because of the impact of annually negotiated contracts on price levels. The impact of lower contract prices from April 2009 is likely to be seen more clearly in the second semester.
6.9. Coke Prices
Figure 26 - Spot Chinese Coke Prices
Source – Euracoal
The development of coke prices reacted in a similar manner to coking coal, reflecting an overheating steel market followed by collapse as the recession took hold.
6.10. World Transport Infrastructure
Infrastructure constraints are a major factor in both the development of new coal resources around the world and in meeting surges in current demand. With the rapid growth in recent years of bulk commodities as a whole, and of coal in particular, there have been major bottlenecks in both loading and discharging ports, and domestic railway lines.
Problems vary from country to country; in Australia there has been major congestion at ports; in Russia the very long rail routes both West and East from the coal producing region in Siberia cause periodic problems because of shortage of wagons or adverse weather conditions.
The chance to exploit market opportunities arising from the increasing demand in coal has triggered plans for a worldwide expansion of the infrastructure across all of the links of the transport chain. Expansion projects in the loading ports have been launched in Indonesia, Colombia, Russia and South Africa. Russia is acting to improve rail access to Eastern ports. However, with the reduced demand levels in 2009, transport bottlenecks have been less of a problem than in 2008 when they contributed to the high coal prices.
6.11. Freight Considerations
The following chart shows the development of rates from the beginning of 2004 to the end of 2009.
Figure 27 - Spot Sea Freight Rates - Richards Bay (South Africa) to Rotterdam
Source – Euracoal
Freight rates react rapidly to supply/demand dynamics and have shown major volatility in recent years. The benchmark freight rate from Richards Bay to Rotterdam ended 2008 around 10% of its peak value in the middle of the year, as a result of the initial impact of the financial crisis. During 2009 prices have responded to a resurgence in demand from China and, whilst being extremely volatile, have fluctuated between levels more in accordance with historic norms.
The peaks in prices seen at various times in recent years, and particularly during 2008, were caused by shortages in capacity, resulting from congestion at ports, on top of a rapid growth in the market both in terms of volumes and distances travelled. It is important to note that bulk carriers are used both for coal and for iron ore, for example with Chinese demand for iron ore relies heavily, for example, on long-distance deliveries from Brazil.
7. LIGNITE AND PEAT –PRODUCTION AND CONSUMPTION
7.1. World Context
[image:46.595.156.508.221.665.2]World production of lignite37 decreased marginally by 0.4% in 2008 to 951.4 Mt.Following its 1989 peak, lignite production declined steadily until 1999, largely as a result of contractions in demand and supply in central and Eastern Europe. Since then, production has been fairly stable. The following table shows figures for the largest producers38.
Table 8 – Major World Lignite Producers ( Mt )
2006 2007 2008
Germany 176.3 180.4 175.3
Russia 74.1 71.1 76.0
Turkey 61.9 72.9 73.1
Australia 67.7 65.6 72.4
United States 76.4 71.3 68.7
Greece 64.8 66.3 65.7
Poland 60.8 57.5 59.6
Czech Republic 55.2 55.0 52.7
Indonesia 30.7 34.5 38.0
Serbia-Montenegro 36.8 37.1 37.4
Canada 36.1 35.6 34.9
Romania 34.9 35.8 34.7
India 31.3 34.0 32.2
Bulgaria 25.7 28.4 28.7
Others* 107.4 110.2 102.0
Total 940.1 955.7 951.4
*IEA figures also include oil shale production in Estonia
Source – IEA Coal Information 2009
37
Many European nations feature among the top producing countries in the world. Europe is responsible for around 50% of world production of lignite, where it represents an energy resource of key importance.
7.2. EU Production Trends
[image:47.595.103.477.212.463.2]European production of lignite was 434.3 Mt in 2008 compared to 446.0 Mt in 2007. Production reduced by 2.6% in 2008 compared to the previous year. Production trends are illustrated by the following chart39.
Figure 28 – EU Lignite Production Trends
The average calorific value of European lignite (including peat) is estimated at 8.99 GJ per tonne40. On this basis, lignite production in 2008, expressed in standard units of coal equivalent, was 133.2 Mtce.
In 2008 Germany reduced its lignite production by 5.1 Mt (-2.8%) to 175.3 Mt as a result of reduced demand from the vertically integrated power sector. Production remained centred in four mining regions – the Rhineland around Cologne, Aachen and Mönchengladbach (95.8 Mt), the Lusatian mining area in South East Brandenburg and North East Saxony (57.9 Mt), the central German mining area in the South East of Saxony-Anhalt and in North West Saxony (19.5 Mt) and the Helmstedt mining area in Lower Saxony (2.1 Mt).41
39
For the purposes of the EU statistics in this document and the attached tables, lignite, brown coal and peat are grouped together and included in a single EU total. (Production of oil shale is not included in the solid fuel totals but figures are reported later in paragraph 0 .)
40
Greece is the EU’s second largest lignite producer, in tonnage terms, and in 2008 production reduced slightly by 1.1% to 65.7 Mt. Production comes from the West Macedonia Lignite Centre in the North of the country and from the Megalopolis Centre in the Peloponnese.
In Poland, lignite production increased by 3.7% to 59.6 Mt in 2008. Two lignite operations are located in central Poland with a third in the south-western region of the country. During 2009 the first lignite was produced from the Szczercow Field. Szczercow is one of the three fields in the Belchatow lignite deposit where resources amount to 620 Mt.
Production in the Czech Republic reduced by 3.6% to 47.5 Mt in 2008. The main lignite basin and the largest mining area is the Northern Bohemian Brown Coal Basin in the North West of the country, with production from around ten mines.
Romania also has a number of lignite mines of varying sizes, mainly in the South West of the country in the Oltenia Basin; production in 2008 reduced by 2.6% to 31.8 Mt.
In Bulgaria, most of the production comes from the Maritsa East coalfield in the South East of the country. Overall Bulgarian production in 2008 increased by 1.3%, to 28.8 Mt.
7.3. Consumption
Total EU consumption of lignite in 2008 was 440.1 Mt, a decrease of 3.1% compared to 454.2 Mt in 2007. Around 94% of lignite is used in power stations with the remainder being largely used for district heating plants and domestic heating, mainly in the form of briquettes.
There is little trade in lignite because of its low heat value and resulting high unit transportation costs. This means generally that power stations burning lignite are situated close to the mines, with supply and demand being closely matched. Total EU imports of lignite in 2008 were 1.2 Mt, only 0.3% of total supply.
7.4. Peat Production
Within the overall lignite figures, production and consumption of peat is included. Production comes mainly from Finland, Ireland, Sweden, Estonia and Lithuania. In 2008, 9.3 Mt of peat was produced, an increase of 0.7 Mt compared to production of 8.6 Mt in 2007. Consumption of peat in 2008 was 14.1 Mt, a decrease of 1.2 Mt compared to consumption of 15.3 Mt in 2007.
7.5. Oil Shale
mainly in the power generation sector where consumption was 12.1 Mt. In 2006 consumption was 17.0 Mt including 13.5 Mt in power generation.
8. STATE AID TO THE INDIGENOUS HARD COAL INDUSTRY IN THE EU
In line with Council Regulation on State aid to the coal industry42, the amount of current production aid continued to decline. At the same time, Member States continued to finance measures related to restructuring and consolidation of their coal sectors. A large part of the financing was directed to environmental clean-up measures or early retirement schemes – so called exceptional costs according to the before mentioned Regulation. When taking into account aid to cover production losses only, subsidised coal serves for only 1.4 % of the electricity production in the EU.
Table 9 – State Aid 2003 – 2008 – amounts actually granted by Member States (only for the main coal aid granters in the EU- 27) or authorised by the
Commission for the relevant year in million €.
Country 2003 2004 2005 2006 2007 2008
Germany
- current production aid
- aid related to exceptional costs 2639 780 2483 556 2114 602 1472 882 1347 994 727 1055 Spain
- current production aid
- aid related to exceptional costs 569 550 340 573 502 582 467 345 448 359 434 373 Poland
- aid related to exceptional costs
903 913 369 60 87
169
Romania
- current production aid n/a n/a n/a n/a 112 93
Hungary
- current production aid
- aid related to exceptional costs n/a n/a 44 48 39 6 38 4 36 4 34 4
9. CONCLUSIONS
9.1. World Context
steam coal showed unprecedented levels of volatility in 2008. For example the delivered price to North West Europe peaked at around $220/tonne in July 2008 before falling rapidly as a result of the world financial crisis. The price dropped below $70/tonne in January 2009, and generally traded around $70/tonne for the remainder of the year.
9.2. European Context
Europe is the third largest region worldwide in terms of coal consumption, after China and the USA. In the European Union around sixty percent of consumption is derived from indigenous production, with 146 Mt of hard coal and 434 Mt of lignite produced in 2008. The European Commission is pursuing discussion with stakeholders through the Berlin Forum, the National Coal Experts’ meetings and the Coal Dialogue, and has produced a ‘Non-Paper’ on the Best Use of EU’s Indigenous Coal Resources. This covers topics including the transparency of the EU coal inventory, regulatory frameworks related to land access and management of environmental impacts, public awareness and acceptance, research and innovation, and the continuing availability of a skilled workforce.
9.3. Coal in EU Electricity Generation
The use of coal in electricity generation varies widely across the EU member states. In Poland over 90% of electricity is generated from coal and lignite whereas in France 4% is generated from coal and 77% is nuclear (2007 data).The split of generation for the EU 27 in 2007 was coal 29%, nuclear 28%, gas 23%, renewables 17%, oil and others 3%.
9.4. EU Reserves of Coal and Lignite
Europe possesses substantial reserves of coal and lignite, which represent around 80% of Europe’s fossil fuel reserves. World Energy Council figures show EU reserves of hard coal at 8.5 Bt and lignite at 21.5 Bt. The largest hard coal reserve is in Poland, representing 70% of the EU total. In the case of lignite, reserves are present in a swathe from Germany through Central Europe and the Balkans, to Greece. Within the EU, Germany has the largest deposit, with major reserves also in Poland, Greece, Hungary, and Bulgaria.
9.5. EU Hard Coal Production and Consumption
Indigenous European production of hard coal has continued its decline, and is forecast to decline further in 2009. Production reduced by 5.7% in 2008, to 146.0 Mt. Consumption continues to be dominated by the power sector at 69%, followed by coke production at19%.
9.6. World Hard Coal Trade
international market dynamics. The major steam coal exporting nations are Indonesia, Australia, Russia, Colombia and South Africa, whereas for coking coal the major exporters are Australia, the United States and Canada.
Total world steam coal exports decreased by 8.2 Mt (1.2%) in 2008 to 676.0 Mt. The expected collapse in the steam coal market in 2009 did not materialise, mainly because of the impact of China. The world trade in coking coal increased by 6.1% to 261.8 Mt in 2008.Australia remained, by far, the largest exporter at 136.9 Mt. Early 2008 saw a dramatic tightening of the coking coal market. However, towards the end of the year a slump in coking coal demand was becoming apparent because of the impact of the worldwide recession on the steel industry. In 2009, whereas US and European steelmakers have seen severe cutbacks, China has led a significant recovery in Asia. Nevertheless, coking coal trade is expected to suffer a reduction of up to 10% over the year.
9.7. EU Hard Coal Imports
Imports of hard coal to the EU in 2008 of 210.6 Mt reduced by 3.2% compared to 217.7 Mt in the previous year and represented 59% of total supply. The major exporting countries to the EU were Russia (25.8%), South Africa (17.2%), the USA (14.9%), Colombia (12.8%), Australia (12.2%), Indonesia (7.2%) and Canada (2.9%).
9.8. International Coal Prices
The very high spot price levels seen in mid 2008 were completely unprecedented in international coal markets and bore no relationship to underlying costs of production and transportation. The rapid fall in coal prices as a result of the economic downturn was even more marked than the increase earlier in the year. During 2009 prices hovered around $60/tonne in the earlier part of the year but then showed a generally upward trend as demand recovered in the Pacific market, ending the year towards $80/tonne. The benchmark freight rate from Richards Bay to Rotterdam ended 2008 around 10% of its peak value in the middle of the year, as a result of the initial impact of the financial crisis. During 2009 prices have responded to a resurgence in demand from China and, whilst being extremely volatile, have fluctuated between levels more in accordance with historic norms.
9.9. Lignite and Peat
Annex 1 – Summary of EU-27 Data
2007 2008 % Change
Hard Coal
Availabilities
Production 154.8 146.0 -5.7
Recoveries 2.0 1.8 -10.0
Imports from third countries 217.7 211.0 -3.1
Total 374.5 358.8 -4.2
Deliveries
Power Stations* 257.2 236.4 -8.1
Coking Plants 65.5 63.9 -2.4
Others 53.4 42.5 -20.4
Exports to third countries 1.1 0.6 -47.1
Total 377.2 343.4 -8.9
Coke
Availabilities
Production 51.0 48.8 -4.5
Imports from third countries 5.3 5.5 4.2
Total 56.3 54.2 -3.7
Deliveries
Steel Industry 43.6 43.2 -0.9
Others 10.0 7.9 -20.9
Exports to third countries 1.5 1.4 -8.9
Total 55.1 52.5 -4.8
Lignite
Availabilities
Imports from third countries 1.3 1.3 -2.0
Total 447.3 435.5 -2.6
Deliveries
Power Stations* 430.4 414.2 -3.8
Briquetting Plants 14.3 16.0 12.1
Others 9.6 10.2 6.5
Total 454.2 440.4 -3.1
Annex 2 - Supplies and deliveries in the EU of Hard Coal, Coke and Lignite in 2007 and 2008
Annex - National Coal Experts' Figures European Commission
Directorate General for Energy and Transport
Member State Austria Belgium Bulgaria Cyprus Czech Denmark Estonia Finland France Germany Greece Hungary Ireland Italy
Republic
1. Production (t=t) 18 12,882 24,185 158
of which :
A - Underground 18 12,874 24,185 158
B - Opencast 8
2. Recoveries 315 422
3. Receipts from other EU Countries 3,614 193 284 2,404 520 284 2,367 6,685 816 310 761
4. Total imports from Third Countries 564 7,223 2,244 35 133 7,603 176 6,386 16,592 38,926 605 1,184 1,942 24,195
of which :
A - USA 377 1,729 544 40 6 354 1,862 3,265 486 73 3,053
B - Canada 186 529 583 1,760 1,084
C - Australia 45 2,321 35 144 559 6,082 5,626 64 387 3,086
D - South Africa 1,642 6 2,099 3,971 7,689 36 488 5,178
E - Russian Federation 103 1,009 386 29 90 2,267 176 4,824 1,111 8,976 412 545 804
F - China 15 3 2 263
G - Colombia 28 2,475 88 1,805 5,923 72 322 2,112
H - Indonesia 288 36 18 633 7,886
I - Venezuela 277 477 340
J - Others 39 17 1,278 324 30 402 5,687 67 89 38 652
5. Total Availabilities (1+2+3+4) 4,178 7,416 2,547 35 15,734 8,123 176 6,670 19,380 69,796 605 2,000 2,252 25,114
6. Gross Inland Consumption* 4,201 6,504 2,547 49 9,908 7,907 131 6,898 20,866 70,212 711 1,965 2,351 25,118
A - Power Stations (public & mine) 1,920 2,192 1,880 3,854 7,522 5,462 8,993 52,296 1 282 1,815 16,254
B - Coking Plants (coal input) 1,917 3,426 667 4,110 1,241 5,951 10,501 1,458 6,197
C - Iron and Steel Industry** 446 715 3,110 3,115 1,740
D - Other Industries 340 271 49 1,138 214 121 189 2,320 2,935 708 149 211 918
of whichPower Stations 288 309 2,924
E - Domestic Heating 24 165 91 171 10 480 1,185 2 63 244 1
F - Miscellaneous (Total (i)+(ii)+(iii)) 4 6 12 180 13 81 8
(i) Issue to Workers 90
(ii) Patent Fuel Plants 4 12 88 8 43
(iii) Others 6 2 5 38 8
7. Deliveries to Other EU Countries 1 1,484 5,676 109 182 96 57
8. Exports to Third Countries 2 150 81 31 2 16
9. Total Deliveries (6+7+8) 4,203 7,990 2,547 49 15,734 8,097 131 6,898 21,079 70,310 727 1,965 2,351 25,175
[image:56.842.64.776.94.399.2]* Including transformation for coke ** PCI Coal
Table 1
Supplies and Deliveries of Hard Coal in 2007 (Part 1)