T E C H N I C A L N O T E
Open Access
MethVisual - visualization and exploratory
statistical analysis of DNA methylation profiles
from bisulfite sequencing
Arie Zackay
1,2, Christine Steinhoff
1*Abstract
Background:Exploration of DNA methylation and its impact on various regulatory mechanisms has become a very active field of research. Simultaneously there is an arising need for tools to process and analyse the data together with statistical investigation and visualisation.
Findings:MethVisual is a new application that enables exploratory analysis and intuitive visualization of DNA methylation data as is typically generated by bisulfite sequencing. The package allows the import of DNA methylation sequences, aligns them and performs quality control comparison. It comprises basic analysis steps as lollipop visualization, co-occurrence display of methylation of neighbouring and distant CpG sites, summary statistics on methylation status, clustering and correspondence analysis. The package has been developed for methylation data but can be also used for other data types for which binary coding can be inferred. The application of the package, as well as a comparison to existing DNA methylation analysis tools and its workflow based on two datasets is presented in this paper.
Conclusions:The R package MethVisual offers various analysis procedures for data that can be binarized, in particular for bisulfite sequenced methylation data. R/Bioconductor has become one of the most important environments for statistical analysis of various types of biological and medical data. Therefore, any data analysis within R that allows the integration of various data types as provided from different technological platforms is convenient. It is the first and so far the only specific package for DNA methylation analysis, in particular for bisulfite sequenced data available in R/Bioconductor enviroment. The package is available for free at http://methvisual. molgen.mpg.de/ and from the Bioconductor Consortium http://www.bioconductor.org.
Findings Motivation
DNA Methylation is a biochemical modification of DNA which occurs in vertebrates almost exclusively at CpG sites, e.g. a methyl group is added at the 5’C position of cytosines. Recently, exploration of DNA methylation and its impact on various regulatory mechanisms has become a very active field of research. Specific DNA methylation patterns and/or their impact on a number of regulatory processes have been described for cancer [1,2], silencing of repetitive elements [3-5], ageing, development and embryonic stem cell profiling [6-8],
correlation with chromatin remodeling, X chromosome inactivation [9], RNA interference [10]; imprinting [11,12], tissue specific expression profiles [13] and evo-lutionary mutation processes [14]. The variety of regula-tory mechanisms for which involvement of methylation has been reported demonstrates its high impact. Furthermore, recent results suggest a very close func-tional relationship between DNA methylation and his-tone modification [15]. Thus, in combination with other epigenetic events, DNA methylation might have an important regulatory impact.
While a number of technologies for quantitative and qualitative analysis of CpG methylation have been pub-lished over the last years, the most accurate experimen-tal procedures are still based on bisulfite treatment followed by conversion of non methylated cytosines to * Correspondence: [email protected]
1
Department of Computational Biology, Max Planck Institute for Molecular Genetics, Ihnestr 73, 14195 Berlin, Germany
Full list of author information is available at the end of the article
uracil and sequencing. Analyzing this kind of data is complicated. Several steps, like alignment of bisulfite treated sequence to reference sequence, detection of low conversion rates of C to T in the bisulfite treatment or the conversion process and quality control, are necessary before actually extracting methylation profiles for further statistical analysis. However, this procedure is a prerequi-site for the investigation of functionality of DNA methy-lation. Tools that allow appropriate processing of this kind of data are needed and currently being developed with different focuses [16-21]. The exploration of combi-natorially acting factors for the determination of epige-netic features is a field of current research [22].
Bisulfite based DNA methylation data can be pro-duced in a high throughput fashion and on the basis of single gene investigation. While high throughput DNA methylation profiling is a very new technological appli-cation and to date only few datasets are available single gene investigations are well established and have been proven as a gold standard in the field of epigenetics research [23,24]. Computationally processing of both kinds of data will be an importent ability in the future. This is because high throughput data will serve as a first step to identify candidate regions that will later be veri-fied independently in single gene approaches. In this application we will focus on the single gene approaches, although in principle high throughput data can be pro-cessed and the package is open for further development in terms of more efficient analysis of high throughput data. In future versions one would allow for the assess-ment of both single gene investigations and high throughput data. Actually, Bioconductor offers a number of packages for analyzing high throughput data, like the SNPchip Package for SNP chip analysis [25]. In fact, SNPchip has been used for methylation analysis [26]. Using packages that are capable for analyzing large data-sets in combination with statistical analysis and visuali-zation implemented in MethVisual could be a powerful strategy for the analysis of DNA methylation data.
Over the last decade the open source and open develop-ment software platform R/Bioconductor has evolved and nowadays displays one of the most important software platforms for statistical investigations in biological and medical informatics. Thus, any package that is added to this software pool has the advantage that it can be easily combined and integratively used with other existing appli-cations. In doing so, there is no need for performing ana-lyses using separate tools within one investigative pipeline. Currently, there is no package in the R/Bioconductor environment that allows for preprocessing, statistical ana-lysis and visualization of DNA methylation data apart from MethVisual. However, there are few software tools outside R/Bioconductor that allow for bisulfite sequenced data analysis: MethTools [18] comprises a set of perl
scripts and allows for estimation of systematic experimen-tal errors and display of methylation data. A tool for com-prehensive statistical investigation is not included and the program requires pre-aligned sequences as input. The Java program BiQ-Analyzer [17] overlaps with respect to align-ment, quality check and basic plotting functions with the proposed MethVisual tool. Further statistical investigation and the integrative analysis of covariate data (for example patient information on tumor staging, survival, etc) are implemented in BIQ-Analyzer but cannot be performed within that tool. The most recent program, QUMA [16] is an interactive web based tool, also allowing testing inde-pendence of each CpG site methylation between two groups (Fisher’s exact test) or of entire sets of CpG sites (Mann-Whitney U test).
Here we present a new R/Bioconductor package that is the first DNA methylation processing tool within R/Bio-conductor. As we show, it is comparable with tools such as BIQAnalyzer and QUMA; we have added some explora-tory statistics features, for example, principle component analysis related methods. Even though MethVisual has been developed for DNA methylation data it can be used in a straightforward manner for various other types of data that can be in a first step discretized and then binarised for example by indicator matrix coding. Another possibility to apply the package is data concerning the binding of speci-fic transcription factors or histone modispeci-fication.
MethVisual package description
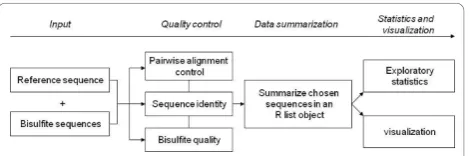
The MethVisual R package performs alignment, quality control, visualization and statistical analysis. A workflow of the software demonstrating data processing steps is shown in Figure 1. The individual processing steps are introduced here. For closer details we refer to the vignette [27].
Reading Sequences (Reference Sequence and Bisulfite Sequence)
[image:2.595.306.541.626.704.2]The input data can be provided as multiple or separate FASTA files [28] or gff files [29]. Furthermore, the reference DNA sequence, which is used as a reference to determine the genomic location of DNA methylation, has to be pro-vided by the user in FASTA format. Due to the fact that for some experimental methods the data is continuous we
implemented a function for the discretization of continuous data into binary coding which is based on thresholding. This function can be used for various kinds of data as well, for example if one wishes to discretize expression data based only on thresholding. More sophisticated discretized expression data might be processed by applying other tools within R/Bioconductor, for example POE [30].
Quality Control
The alignment control (AC) procedure comprises a com-parison to the reference sequence and is performed to pre-vent false alignment during further analysis. False alignment can occur for three reasons: sequences that are 1) reversed, 2) complement or 3) reversed-complement to the reference sequence. MethVisual compares the score result computed by the pairwise Needleman-Wunsch Algorithm for global alignment implemented in the Biostrings package [31] and selects the alignment variant with the highest score among these three possibilities mentioned above for each bisulfite sequence involved. The alignment score is calculated due to DNA alphabet substitution matrix (IUPAC code). Because of the special characteristic of the bisulfite sequences the substitution matrix tolerates the alignment of T in bisulfite sequences to C in reference sequence.
Bisulfite conversion, which involves conversion of non methylated cytosines (Cs) to uracil (Us) upon bisulfite treat-ment and subsequent amplification, can be an incomplete process where non methylated Cs have not been converted. MethVisual measures the bisulfite treatment quality by cal-culating this conversion ratio which is defined as the ratio between the number of unconverted Cs within non CpG sites and the sum of all Cs outside CpG sites. MethVisual computes sequence identity rate of the bisulfite sequences to the reference sequence by calculating the nucleotide matches and mismatches in a local pairwise alignment. The usage of this procedure is motivated by Kumaki et al. [4] restricting the comparison of sequenced sample - thus the bisulfite treated clone sequence - versus reference sequence to the three bases A, G and T.
Data Summary
In order to analyze and visualize the DNA methylation pattern we need to summarize data in the next step. We save the data information consisting of: (i) bisulfite sequence name, (ii) methylation matrix, e.g. clone sequences times CpG positions binary coded matrix for indications of methylation and non methylation, (iii) positions of CpG sites in the reference sequence and start and end position of the pairwise alignments as an R object for further analysis.
Statistics and Visualization
For straightforward visualization of the processed methylation profiles we implemented lollipop plots as
well as neighbouring and distant co-occurrence display. Neighbouring co-occurrence display shows the common methylation patterns between neighbouring CpG sites. This can be displayed as percentage or correlation of sharing methylation events between two neighbouring CpG sites. Frequently one would also like to know whether any two non-directly neighbouring CpG sites display a relatively high or low common methylation pattern across experiments. Therefore, we also included the new option to display the co-occurrence between any two CpGs under study. In fact, for structure analysis of Dnmts Jia et al. [32] showed that there is a periodicity for which the 10 bps apart located CpG is preferentially methylated. Analyzing the functional relevance of methylation patterns depending on their relative posi-tion is an interesting open quesposi-tion.
We also included a number of statistical applications. These options include (i) percentage of methylated and non methylated sites in sets of experiments (ii) testing for independence of each CpG site between two groups (Fisher’s exact test) or (iii) of entire sets of CpG sites (Mann-Whitney U test). Furthermore, (iv) we provide a hierarchical bi-clustering option based on the quality-checked methylation data matrix. Due to the fact that we analyze binarized rather than continuous data the default option between two binarized methylation patterns is the Hamming distance rather than the euclidean distance. One has to keep in mind, that this method does not take into account the genomic ordering of CpG sites.
Furthermore, we implemented correspondence analy-sis [33] for the intuitive visualization of the methylation matrix. This method allows for studying associations between CpG sites and subclones. Briefly, correspon-dence analysis is applied to a two way table which in our case are DNA methylation values of CpG sites mea-sured in clones. The analysis is used for describing cor-respondence between columns (here CpG sites) and rows (here experiments/clones). First, we describe how to read a given display as for example shown in Figure 2c. In a second step we briefly describe the mathemati-cal basis. However, for closer detail we refer to [34,35].
Figure 2c, each point, i.e. CpG site (red triangle) or clone (black dot), marks the direction and distance of a vector originating from the centroid. The appearance of vectors in the same quadrants and a closer angle distance between vectors reflects their relative association. Follow-ing the example, CpG sites 1 and 2 and clone 1 and 2 show a small angle. That means clone 1 and 2 are mainly determined by their CpG profile in position 1 and 2. In fact, exactly in these positions the clones are methylated. This feature distinguishes them from the other two clones. While correspondence analysis allows us to visua-lize associations in complex matrices, it should be noted that there is no threshold to decide whether an associa-tion is strong or weak, the vectors describe relative asso-ciations, i.e. stronger or weaker.
Originally, the method was described by Berzerci [36]. In biological data analysis context, correspondence ana-lysis has been used for the first time for the anaana-lysis of microarray data in [35]. Correspondence analysis pro-cesses cross-tabulations of categorical data (contingency tables) by projecting the data vectors on the directions maximizing the total chi-square distance instead of the total variance, used for singular value decomposition and continuous data. Theoretically speaking, rotating the high dimensional data, each data point is projected onto a 2-dimensional planar in a way that maximal var-iance can be seen according to the first and second dimension. In our application, this allows for studying associations between clones and CpG sites.
Computational processes
All calculations have been performed using R 2.11.0 ver-sion and Bioconductor 2.6 which was the latest verver-sions at the time of writing the paper under Windows and Unix systems. The package MethVisual is currently avail-able under Bioconductor 2.6 and has been checked under R version R 2.11.0. Any calculations within BIQAnalyzer and QUMA have been performed with default settings.
Demonstration of pipeline
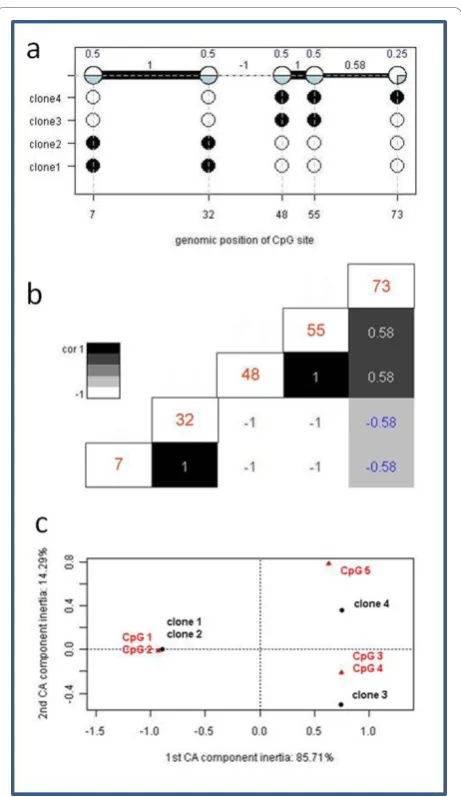
We produced a very simple methylation profile, consist-ing of four clones measurconsist-ing 5 CpG sites at hypothetical basepair positions 7, 32, 48, 55 and 73. While two clones show identical methylation profiles, namely being methylated at CpG sites 1 and 2, and otherwise are non methylated, one clone is methylated at CpG sites 3 and 4, whereas for another clone methylation has been determined for CpG sites 3, 4, and 5. First, we demon-strate visualization based on the example data. Three important figures are summarized in an overview repre-sentation in Figure 2.
In Figure 2a the summary display at the top of the figure does not only display the relative amount of methylated
clones for each CpG site (above the circles), but also shows the correlation between neighbouring CpG sites. Correlation can be visualized as the relative amount of shared methylation patterns or as a correlation coefficient using Hamming distance. CpG sites 1 and 2 are perfectly correlated, they are either both methylated (clones 3 and 4) or both unmethylated (clones 1 and 2). CpG sites 2 and 3 are perfectly anti-correlated. This means, if one site is methylated the other one always is not and vice versa. However, correlation between distant CpG sites, as for example CpG site 1 and 3 - which should be the same as CpG sites 2 and 3 - are more difficult to see. This can be omitted by using a matrix display as is provided by the function matrixSNP. An example is shown in Figure 2b. Here, a comprehensive graphical representation has been produced applying lollipop plots combined with neigh-bouring and distant co-occurrence. For space reasons we omitted the lollipop display which is already displayed (even though not equidistant) in the figure part above (Figure 2a) and only show the distant co-occurrences. Basically, this is a colour coded distance matrix which in this intuitive case can easily be compared with the sum-mary plot in Figure 2a. In more complicated data struc-tures the colour coded matrix might be easier to access and thus is a more appropriate display.
In Figure 2c we apply correspondence analysis [33]. This allows us to study associations between CpG sites 1-5 and subclones 1-4. Objects (CpG sites, clones) with similar correlations cluster together resulting in small angles, whereas dissimilar objects are separated from each other by a large angle, e.g. different quadrants. In this very sim-ple examsim-ple, one expects, that clones 1 and 2 should group together and CpG sites 1 and 2 should display a small angle to clones 1 and 2 because their methylation characterizes the two clones. On the other hand, clones 3 and 4 should separate strongly from clones 1 and 2 since they show opposite patterns and are mostly determined by their methylation pattern in CpG site 3, 4 and 5. In fact inertia of the first correspondence component is 85.71% whereas the second comprises 14.29%. Thus the two dimensions displayed in Figure 2c explain a large majority of variety captured in this data example.
DNA methylation data processing: artificial data
BiQ-Analyzer offers the user a tutorial dataset. We use the tutorial datasets that includes one reference sequence (223 bps) and ten artificial clone sequences (seqA, seqB,.., seqJ) in FASTA format corresponding to the reference sequence. Basically, in this subsection we want to demonstrate that MethVisual gives similar results as BIQAnalyzer and QUMA. We would like to stress that we do not aim at providing a completely new tool but rather the first Bioconductor tool that can be used integratively with existing statistical applications in
R but have added some new features that are useful for visualizing DNA methylation data and are not present in other DNA methylation tools.
We processed the BIQAnalyzer dataset with BIQAna-lyzer and MethVisual R package in parallel to compare alignment and quality control. Analyzing the data in MethVisual showed how the program deals with proble-matic data in the context of false alignments, low clone sequence quality and problems with cytosine conversion due to bad bisulfite treatment. Analyzing the data in MethVisual and comparing the results with those in BIQAnalyzer confirmed the MethVisual alignment and conversion correctness as shown in additional file 1. The identity control value calculated by MethVisual and BIQAnalyzer differ in 3 out of 10 cases. This is due to different alignment calculations.
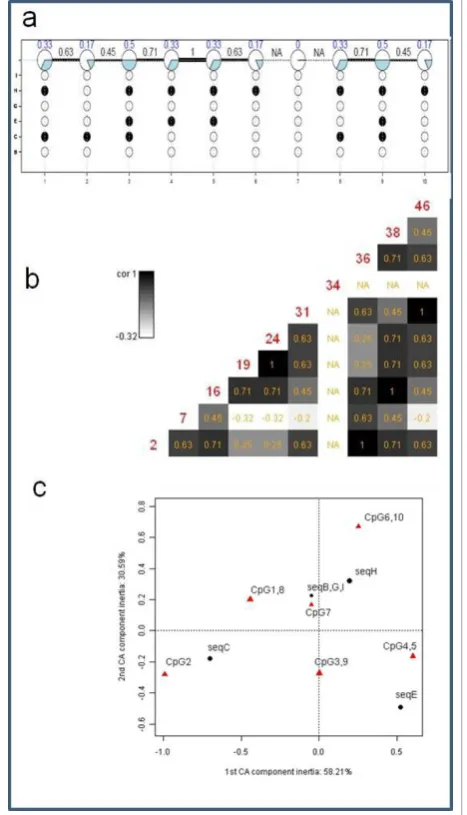
In order to clearly represent the results we restrict our comparison and visualization to the central 10 CpGs located at relative genomic positions 2, 7, 16, 19, 24, 31, 34, 36, 38 and 46. As for the data above we produce an overview figure showing lollipop plot with neighbouring correlations (Figure 3a), distant co-occurrence plot (Fig-ure 3b) and correspondence analysis plot (Fig(Fig-ure 3c). In Figure 3a we chose an equidistant display for space rea-sons. Figure 4 shows the respective overview plots as provided from the BIQ Analyzer software, whereas Fig-ure 5 displays outputs from QUMA. Comparing displays of Figure 3a and Figure 4 there is much information directly accessible that is not included in the BIQAnaly-zer display. For example, neighbouring correlations can be seen, e.g. CpG sites 4 and 5 are perfectly correlated. At the same time the percentage of methylated clones which the correlation is based on can be read as 33%. In BIQAnalyzer two plots have to be generated to see clo-newise methylation and correlation characteristics. We further show a display of distant correlation produced by MethVisual (Figure 2b). For example, CpG sites 3 and 9 at basepair positions 16 and 38 are perfectly cor-related based on the methylation of three clones but interrupted by 5 CpG sites. Thus, looking only at the Lollipop plot as shown in Figure 3a, distant correlation features are harder to see.
circles in a lollipop plot (Figure 5 upper part). The figure demonstrates comparable results as for MethVisual and BIQAnalyzer. In addition, the program offers statistical tests as Mann-Whitney U test and Fisher’s exact test and a diagram of comparative methylation; this feature has been implemented in MethVisual as well. The lower part of Fig-ure 5 is comparable with the summary part of FigFig-ure 3a (upper part) and displays the relative amount of methyla-tion for each CpG site. The user might decide which kind of display he prefers.
[image:6.595.306.543.86.249.2]Coming back to the MethVisual display in Figure 3c we show a correspondence analysis plot, that cannot be offered by BIQ Analyzer and QUMA. The plot is very
[image:6.595.59.293.96.504.2]Figure 3 MethVisual BIQAnalyzer study data. (a) Lollipop displays for reduced BIQ Analyzer study dataset as in figure 2a (b) BIQ Analyzer study dataset distant co-occurrence plot as in figure 2b (c) BIQ Analyzer study dataset correspondence analysis plot as in figure 2c
Figure 4BIQAnalyzer study data. (a) The reduced BIQAnalyzer tutorial dataset was processed within BIQAnalyzer with default settings and a lollipop display was produced. Filled (methylated) and empty (non methylated) circles mark relative genomic positions of CpG sites under study. Each row shows one clone that was analyzed, providing the clone name beside (left). The line break was produced automatically by the tool. (b) The reduced BIQAnalyzer tutorial dataset was processed within BIQAnalyzer with default settings and a summary display was produced. The boxes display a summary of relative amount of clones being methylated (yellow) or non methylated (blue) at a specific CpG site. Between neighbouring CpG sites genomic distances (not correlation) are displayed. The rows below the boxes show the genomic basepair position, the absolute amount of methylated, non methylated and not present clones for each site.
[image:6.595.305.537.321.639.2]intuitive. For example, CpG 2 is mainly determined by its methylation profile of sequence C which is -going back to the lollipop display in Figure 3a - reasonable. Only sequence C shows a methylation in CpG site 2. Even though features like this can also be observed in the lollipop display, correlated features as CpG site 2 and sequence C are easier to see from the correspon-dence analysis plot. Also, the relative strength of corre-lation which is given by the vector lengths and angles is easier to investigate. Overall the two dimensional display captures 88.88% of total inertia (58.21% in the first com-ponent and 30.59% in the second).
DNA methylation data processing: biological data
In order to include an experimental dataset we analyzed a published bisulfite sequence dataset starting with the sequencer output as provided by the authors [37]. Dokun et al. [37] investigated the relationship between SNCG, S100A4, S100A9 and LNC2 gene expression and DNA methylation in bladder cancer. SNCG is 4.7 fold stronger expressed in tumor culture and SNCG down regulation is associated with hypermethylation. The results also indicate that the SNCG methylation pattern is cell type specific [37]. We analyzed this bisulfite sequencing data using the MethVisual pipeline. All processing steps like alignments, quality control were done automatically without any man-ual intervention. All bisulfite sequences passed the QA and QC procedures of the package, showing high quality in all aspects. The quality controlled bisulfite sequences were analyzed with the methVisual and lollipop figures and clustering analysis are demonstrated below. Sequences reading, data processing and all statistical analysis and graphs took approximately 15 seconds on a Windows 32 bit operating system.
The lollipop plot shows similar results as shown by Dokun et al [37] (additional file 2) apart from two features. The first difference is the number of CpG sites that are aligned to the reference sequence. In the Dokun et al [37] there are 14 CpG sites, whereas methVisual found 16 sites. In fact we processed the data also in BIQAnalyzer and in QUMA and got the same results as with MethVisual. We conclude that there are 16 sites. The second difference is the amount of CpG methylation in three out of five cell lines (RT4, Umuc3 and BFTC909). This is due to the align-ment gap penalty. Depending on the usage of the penalty, especially in case of Ns appearing in the sequence, the result differs slightly.
Since the dataset is obtained from different cell cul-tures it is of interest to see whether the single bisulfite sequences can be clustered into subsets. Clustering the data, the hypermethylated BFTC909 and Umuc3 bisul-fite sequences are clearly clustered together. Also the hypomethylated bisulfite sequences HT1376 and VmCub1 are classified together (additional file 3). The
RT4 bisulfite sequences are the only ones which are divided between the hypo- and hypermethylated classes. That can be explained by looking at the RT4 methyla-tion pattern in the lollipop plot, where the two bisulfite sequences are poorly methylated and the other two are non methylated over all CpG sites.
Concluding remarks
The visualization and exploratory statistical analysis of genome wide DNA methylation profiles is a fundamen-tal step for the investigation of the regulatory impact of epigenetic processes. Currently bisulfite sequencing serves as a gold standard for DNA methylation profiling. We have shown that MethVisual comprises processing of non high throughput DNA methylation data and furthermore allows for several visualization and basic statistical application steps. Existing tools [16-18] - even though not in R/Bioconductor - show few of these fea-tures, thus MethVisual is the first comprehensive DNA methylation processing and analysis tool in R. In this work we describe the package and demonstrate the workflow. We compare alignment and quality check with existing tools (BIQAnalyzer [17] and QUMA [16]) based on the dataset that has been published along with BIQAnalyzer [17] and a biological dataset [37]. We show in a very simple case how intuitive visualization works. We point out that the tool can be used in a straightforward way to analyze high throughput DNA methylation data and expression data integratively by combining existing packages within Bioconductor. High throughput DNA methylation data is at an early stage of production. In the future the package might be broa-dened to allow high throughput DNA methylation data as derived from second generation sequencing to be processed efficiently within MethVisual.
Additional material
Additional file 1: Comparison of BIQAnalyzer and methVisual data processing.
Additional file 2: Lollipop display of SNCG dataset.
Additional file 3: Biclustering diagram of SNCG dataset generated by MethVisual R package. On the y axis bisulfite sequence names are shown. On the x axis CpG positions are displayed numbered according to their relative position on the reference sequence. The clustering is visualized by showing a dendrogram on the upper left side according CpG positioning and bisulfite sequences. The red colored squares mark non methylated CpG sites while the light colored squares mark methylated sites.
Acknowledgements
Author details
1Department of Computational Biology, Max Planck Institute for Molecular
Genetics, Ihnestr 73, 14195 Berlin, Germany.2Dept. Microbiology and Molecular Genetics, IMRIC, Hebrew University-Hadassah Medical School, Jerusalem, Israel.
Authors’contributions
CS designed the project, selected the data and wrote the manuscript. AZ programmed the package and processed and analyzed the data. All authors have read and approved the final manuscript.
Competing interests
The authors declare that they have no competing interests.
Received: 15 July 2010 Accepted: 15 December 2010 Published: 15 December 2010
References
1. Feinberg AP, Tycko B:The history of cancer epigenetics.Nat Rev Cancer
2004,4:143-153.
2. Schulz WA, Steinhoff C, Florl AR:Methylation of endogenous human retroelements in health and disease.Curr Top Microbiol Immunol2006,
310:211-250.
3. Yoder JA, Walsh CP, Bestor TH:Cytosine methylation and the ecology of intragenomic parasites.Trends Genet1997,13:335-340.
4. Fazzari MJ, Greally JM:Epigenomics: beyond CpG islands.Nat Rev Genet
2004,5:446-455.
5. Steinhoff C, Schulz WA:Transcriptional regulation of the human LINE-1 retrotransposon L1.2B.Mol Genet Genomics2003,270:394-402. 6. Li E, Bestor TH, Jaenisch R:Targeted mutation of the DNA
methyltransferase gene results in embryonic lethality.Cell1992,
69:915-926.
7. Reik W, Santos F, Dean W:Mammalian epigenomics: reprogramming the genome for development and therapy.Theriogenology2003,59:21-32. 8. Meissner A, Mikkelsen TS, Gu H, Wernig M, Hanna J, Sivachenko A, Zhang X,
Bernstein BE, Nusbaum C, Jaffe DB,et al:Genome-scale DNA methylation maps of pluripotent and differentiated cells.Nature2008,454:766-770. 9. Chow JC, Yen Z, Ziesche SM, Brown CJ:Silencing of the mammalian X
chromosome.Annu Rev Genomics Hum Genet2005,6:69-92. 10. Hawkins PG, Morris KV:RNA and transcriptional modulation of gene
expression.Cell Cycle2008,7:602-607.
11. Morison IM, Ramsay JP, Spencer HG:A census of mammalian imprinting. Trends Genet2005,21:457-465.
12. Steinhoff C, Paulsen M, Kielbasa S, Walter J, Vingron M:Expression profile and transcription factor binding site exploration of imprinted genes in human and mouse.BMC Genomics2009,10:144.
13. Rakyan VK, Down TA, Thorne NP, Flicek P, Kulesha E, Graf S, Tomazou EM, Backdahl L, Johnson N, Herberth M,et al:An integrated resource for genome-wide identification and analysis of human tissue-specific differentially methylated regions (tDMRs).Genome Res2008,18:1518-1529. 14. Arndt PF:Reconstruction of ancestral nucleotide sequences and
estimation of substitution frequencies in a star phylogeny.Gene2007,
390:75-83.
15. Cedar H, Bergman Y:Linking DNA methylation and histone modification: patterns and paradigms.Nat Rev Genet2009,10:295-304.
16. Kumaki Y, Oda M, Okano M:QUMA: quantification tool for methylation analysis.Nucleic Acids Res2008,36:W170-175.
17. Bock C, Reither S, Mikeska T, Paulsen M, Walter J, Lengauer T:BiQ Analyzer: visualization and quality control for DNA methylation data from bisulfite sequencing.Bioinformatics2005,21:4067-4068.
18. Grunau C, Schattevoy R, Mache N, Rosenthal A:MethTools-a toolbox to visualize and analyze DNA methylation data.Nucleic Acids Res2000,
28:1053-1058.
19. Harris EY, Ponts N, Levchuk A, Roch KL, Lonardi S:BRAT: bisulfite-treated reads analysis tool.Bioinformatics26:572-573.
20. Yang CH, Chuang LY, Cheng YH, Gu DL, Chen CH, Chang HW: Methyl-Typing: an improved and visualized COBRA software for epigenomic studies.FEBS Lett584:739-744.
21. Rohde C, Zhang Y, Jurkowski TP, Stamerjohanns H, Reinhardt R, Jeltsch A:
Bisulfite sequencing Data Presentation and Compilation (BDPC) web
server–a useful tool for DNA methylation analysis.Nucleic Acids Res2008,
36:e34.
22. Ahmed R, Vingron M, Steinhoff C:Statistical Exploration of Genomewide DNA Methylation Profiling; Shaker2009.
23. Bock C, Lengauer T:Computational epigenetics.Bioinformatics2008,
24:1-10.
24. Frommer M, McDonald LE, Millar DS, Collis CM, Watt F, Grigg GW, Molloy PL, Paul CL:A genomic sequencing protocol that yields a positive display of 5-methylcytosine residues in individual DNA strands.Proc Natl Acad Sci USA1992,89:1827-1831.
25. Classes and Methods for high throughput SNP chip data.[http://www. bioconductor.org/help/bioc-views/release/bioc/html/SNPchip.html]. 26. Xin Y, Chanrion B, Liu MM, Galfalvy H, Costa R, Ilievski B, Rosoklija G,
Arango V, Dwork AJ, Mann J, Tycko B, Haghighi F:Genome-Wide Divergence of DNAMethylation Marks in Cerebral and Cerebellar Cortices.PLoS ONE2007,5:e11357.
27. MethVisual, Methods for visualization and statistics on DNA methylation data.[http://www.bioconductor.org/packages/2.6/bioc/html/methVisual. html].
28. [http://www.ncbi.nlm.nih.gov/blast/fasta.shtml]. 29. [http://www.sanger.ac.uk/resources/software/gff/].
30. Parmigiani G, Garrett E, Anbazhaghan R, Gabrielson E:A statistical framework for expression-based molecular classification in cancer.JRSS
2002,64:717-736.
31. Gentleman R, Carey V, Bates D, Bolstad B, Dettling M, Dudoit S, Ellis B, Gautier L, Ge Y, Gentry J,et al:Bioconductor: Open software development for computational biology and bioinformatics.Genome Biology2004,5: R80.
32. Jia D, Jurkowska R, Zhang X, Jeltsch A, Cheng X:Structure of Dnmt3a bound to Dnmt3L suggests a model for de novo DNA methylation. Nature2007,449:248-251.
33. Greenacre M, Blasius J:Multiple Correspondence Analysis and Related Methods
London: Chapman & Hall/CRC; 2006.
34. Nenadic O, Greenacre M:Multiple Correspondence Analysis and Related MethodsLondon: Chapman & Hall/CRC; 2006.
35. Fellenberg K, Hauser NC, Brors B, Neutzner A, Hoheisel JoD, Vingron M:
Correspondence analysis applied to microarray data.Proceedings of the National Academy of Sciences2001,98:10781-10786.
36. Benzecri J:L’analyse des donnees 1. La Taxinomie 2. L’analyse des correspondances.Dunod1973.
37. Dokun O, Florl A, Seifert H, Wol I, Schulz WA:Relationship of sncg, s100a4, s100a9 and lcn2 gene expression and DNA methylation in bladder cancer.Int J Cancer2008,123:2798-2807.
doi:10.1186/1756-0500-3-337
Cite this article as:Zackay and Steinhoff:MethVisual - visualization and exploratory statistical analysis of DNA methylation profiles from bisulfite sequencing.BMC Research Notes20103:337.
Submit your next manuscript to BioMed Central and take full advantage of:
• Convenient online submission
• Thorough peer review
• No space constraints or color figure charges
• Immediate publication on acceptance
• Inclusion in PubMed, CAS, Scopus and Google Scholar
• Research which is freely available for redistribution