This is a repository copy of
Viscoelastic granular dampers under low amplitude vibration
.
White Rose Research Online URL for this paper:
http://eprints.whiterose.ac.uk/103090/
Version: Accepted Version
Article:
Darabi, B., Rongong, J.A. orcid.org/0000-0002-6252-6230 and Zhang, T. (2016)
Viscoelastic granular dampers under low amplitude vibration. Journal of Vibration and
Control. JVC-15-0803. ISSN 1077-5463
https://doi.org/10.1177/1077546316650098
[email protected] https://eprints.whiterose.ac.uk/ Reuse
Unless indicated otherwise, fulltext items are protected by copyright with all rights reserved. The copyright exception in section 29 of the Copyright, Designs and Patents Act 1988 allows the making of a single copy solely for the purpose of non-commercial research or private study within the limits of fair dealing. The publisher or other rights-holder may allow further reproduction and re-use of this version - refer to the White Rose Research Online record for this item. Where records identify the publisher as the copyright holder, users can verify any specific terms of use on the publisher’s website.
Takedown
If you consider content in White Rose Research Online to be in breach of UK law, please notify us by
Page 1 of 25
Viscoelastic granular dampers under low amplitude vibration
B Darabi1, J A Rongong2 and T Zhang2
1 Department of Mechanical Engineering, Islamic Azad University Central Tehran Branch, Iran.
2 Department of Mechanical Engineering, The University of Sheffield, UK.
Corresponding Author
Jem A Rongong
The University of Sheffield, Department of Mechanical Engineering, Mappin Building, Mappin Street,
Sheffield, S1 3JD, UK.
Abstract
This paper considers dampers comprising collections of viscoelastic particles that are subjected to
vibrations whose amplitude is such that slip between particles is negligible. Energy dissipation occurs
primarily by viscoelastic processes within each particle and is maximised when standing waves are set
up in the granular medium. In this work, the medium is represented as an equivalent viscoelastic solid
and predictions of performance employ models constructed using standard finite element software. Two
numerical approaches are considered: one uses the Direct Frequency Response and the other uses
standard modal analysis in conjunction with analytical expressions for energy dissipation based on the
wave equation. The performance of these prediction techniques is compared with measured behaviour
from experiments on a box-shaped structure and a hollow composite tube assembly. The computational
efficiency of the modal technique allowed a brief investigation of the effects of uncertainties in the
actual nature of the granular arrangement. Results show that both prediction methods give a reasonable
level of accuracy. Differences between predicted and measured behaviour are shown to be of the same
order as the uncertainty in the prediction itself. For the systems considered, it is shown that the methods
are appropriate for acceleration amplitudes up to almost that of gravity.
Keywords
Page 2 of 25
1
Introduction
When a granular medium is subjected to vibration, energy is dissipated through inelastic deformation
and friction between individual particles. If the granular medium is placed in a cavity that is integral to
or attached to a vibrating structure, it can provide useful levels of damping. Performance depends on
many parameters including vibration frequency and amplitude.
One type of granular damper that has been studied extensively is the particle damper. Here the particles
are small and hard, often metallic or ceramic, and the important energy dissipation mechanisms are
friction and inelastic losses at the interface. This type of granular system, is not discussed here. Instead,
this paper considers the damping obtained from granular systems where loss of contact or slip between
particles is rare and damping arises from energy dissipation within the particle. Under such conditions,
it has been shown that a granular medium consisting of relatively large and flexible polymeric spheres
can provide very high levels of structural damping. This occurs for vibration modes of the host structure
that occur in frequency ranges where standing waves are present within the granular medium. Under
these conditions, excitation of the host structure leads to significant interaction with the vibration modes
within the granular medium which act in a similar way to tuned mass dampers.
Granular dampers employing standing waves in a collection of viscoelastic particles were first described
publicly in a patent application by House and Hilliar (1990). Subsequently experimental studies were
used to demonstrate the effectiveness of the method on hollow beams (Oyadiji, 1996; Pamley et al,
2001; Rongong and Tomlinson, 2002). Theoretical methods, based on representing the granular
medium as an equivalent solid, have been used to provide estimates of modal damping (Pamley et al,
2001; Rongong and Tomlinson, 2002) and frequency response (Varanasi and Nayfeh) of hollow beams.
These analyses were inspired by the original work of Ungar and Kerwin (1964) who derived expressions
for the energy loss in thick viscoelastic layers bonded to metal plates.
At very high levels of excitation, even for highly damped soft particles, the equivalent solid assumption
becomes invalid. The amplitude at which particles begin to separate is related to the ratio of vibration
acceleration to gravitational acceleration. It has been shown that separation first starts to occur under
conditions where an internal resonance occurs in the granular medium and the location of the separation
is at the maximum deflection point of the internal wave (Poschel et al 2000). For motion parallel to
gravity, separation can occur when the acceleration ratio is less than unity.
Numerical studies involving the Discrete Element Method have also been carried out for granular
dampers consisting of soft, high loss particles (Darabi and Rongong, 2012). In this approach, the
properties of individual particles (including mass, complex stiffness and friction) were defined and the
energy dissipation estimated for large collections of these particles subjected to prescribed vibration.
While this type of analysis gives considerable insight into the effects of individual parameters affecting
Page 3 of 25
because of the high computational cost involved. There is currently need for a prediction method for
viscoelastic granular dampers that is compatible with large finite element models of irregular structures.
This aim of this paper is to develop and evaluate approaches that are appropriate for high loss particles
subjected at low amplitude vibrations (where inter-particle separation and slip are minimal) and energy
dissipation is dominated by viscoelastic losses in the particles. These approaches provide predictions of
energy loss in the medium and the resulting frequency response of the damped host structure. As the
prediction methods model the granular medium as an equivalent viscoelastic solid, the paper considers
the limits of applicability of such an approximation as the amplitude increases.
2
Methodology and Objectives
The focus of this work was to develop straightforward approaches for predicting the performance of
granular dampers in engineering structures at low amplitude using computational resources normally
available to practising engineers. The fundamental assumption used was that at low vibration levels,
the majority of the particles would not separate and therefore their behaviour could be represented by a
viscoelastic solid. While a procedure that couples the vibration of the flexible host structure to a
viscoelastic discrete element code is likely to provide a more physically representative (and therefore
possibly more general) solution, such tools are currently not widely available and the computational
cost would be prohibitively high for design optimisation studies. Instead, the approach taken was to
provide closed-form equations that can be used alongside standard finite element analysis procedures.
The work presented here uses one granular system involving relatively large spheres made of an
elastomeric material. Experimental and numerical studies are carried out when granules are used to fill
two different types of structure: a rigid box and a hollow cylindrical beam. The similarity between the
experimental and numerical results is used to validate the prediction procedures discussed in the paper.
While, in the studies carried out, excitation is applied in a direction perpendicular to gravity, significant
differences in results for excitation in other directions are not expected as the vibration amplitude
remains small.
The finite element models employed, for both the equivalent viscoelastic solid and the host structure,
were constructed using quadratic brick elements with reduced integration. The mesh density was set in
each direction such that there were at least 8 elements to approximate the shortest wavelengths
considered. While in this work the commercial software Abaqus was used, any other code that could
run elastic natural frequency extraction routines and frequency domain forced vibration analysis would
have given the same results.
The paper is structured around the need to achieve four principal objectives which are described briefly
Page 4 of 25
1. To obtain properties of an equivalent viscoelastic solid from tests on the bulk material from which
the granules are made. This includes efforts to account for uncertainty arising from the variable
nature of typical granular arrangements and is discussed in Section 3.
2. To evaluate methods to predict the energy dissipation within a granular medium subjected to low
amplitude vibration. This is carried out using a rigid box filled with viscoelastic particles and is
presented in Section 4.
3. To develop and validate methods for predicting the damped frequency response of structures that
are more complicated than rectangular beams. This activity is described in Section 5, where a
composite tube with heavy metal end caps is subjected to transverse vibrations.
4. To explore the limits to which predictions based on the equivalent solid approximation are valid.
This was investigated experimentally by altering the vibration amplitude of the composite tube
assembly and is described in Section 6.
3
Equivalent viscoelastic solid
As the vibration amplitude considered in this work is relatively low, it was possible to consider the
granular medium as an equivalent viscoelastic solid. This is an important simplification as it allows
predictions to be made using standard finite element software. For consistency, the granular medium
considered here was composed of nominally identical spheres (each 15.1 mm in diameter) made from
an elastomeric polymer selected to have its transition zone near room temperature. The procedure
undertaken to obtain equivalent properties is described here including efforts to account for
uncertainties arising from the precise nature of the granular arrangement.
3.1
Viscoelastic behaviour
As this work concentrated on frequency domain behaviour, the complex modulus approach was
considered adequate. This is written as,
*
1
v v
E E j
(1)where
E
v is the elastic modulus,
v is the loss factor and j 1. Note that causality is satisfied ifthe loss factor tends to zero at low frequency.
For the polymeric material used, information regarding the temperature and frequency dependence of
the complex modulus was condensed into its viscoelastic master curve. This curve was constructed by
applying the temperature-frequency superposition principle (Ferry, 1980) to measured data obtained
using Dynamic Mechanical Thermal Analysis (DMTA) equipment. The method assumes that the
modulus and loss factor at temperature
T
can be obtained from known frequency dependent propertiesPage 5 of 25
that material at that particular temperature. To account for the increase in stored energy with
temperature, and additional scaling is required for the elastic modulus such that,
r v
r T
E E
T
(2)
where
E
r is sometimes referred to as the reduced modulus. Thus the complex modulus at anytemperature and frequency can be recovered if curves defining the reduced modulus and loss factor
against frequency are constructed and a suitable curve linking temperature and frequency shift is
specified.
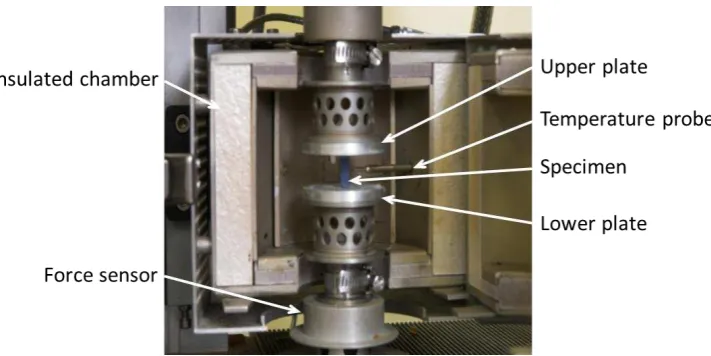
For the material considered here, a cuboid specimen (11.54.53.5 mm) was cut from one of the
polymer spheres. It was bonded between two parallel plates on the DMTA machine, as shown in Figure
1, and excited in a tension-compression mode. The upper plate was controlled to move sinusoidally
with amplitude 9.2 m and the resulting force signal was used to find the complex stiffness of the
specimen and hence the Young’s modulus and the loss factor for the material. Characterisation was
carried out at a number of frequencies between 1 and 30 Hz over a temperature range 60 to 60 C.
[image:6.595.121.477.373.551.2]Figure 1: DMTA characterisation of polymer specimen using Metravib VA2000 equipment
The frequency dependent reduced modulus and loss factor curves were obtained at a reference
temperature
T
r
17
C, by defining and optimising the shift factor for each temperature. Theoptimisation routine used the Differential Evolution algorithm and aimed to minimise the distance from
individual data points to smooth, spline-based curves. The resulting curves are presented in tabular form
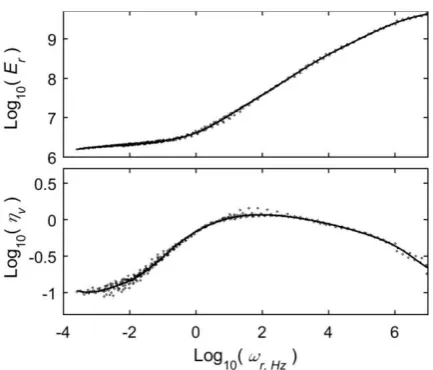
in Table 1. The quality of fit of individual points to the master curves can be seen in Figure 2 from
Page 6 of 25
Figure 2: Fit of individual data points to complex modulus curves presented in Table 1
Note that to recover properties at a desired frequency
Hz and temperatureT
, first the reducedfrequency should be found by applying the correct frequency shift. The shift factor for the desired
temperature is found by interpolation of the shift curve in Table 1. Thus,
10 , 10 10
log (
r Hz)log (
Hz) log ( )
(3)Reduced modulus and loss factor are be obtained by interpolation of the complex modulus curve in
Table 2 after which the actual elastic modulus is calculated using Equation 2.
Table 1: Viscoelastic properties of polymeric material
Frequency / temperature shift curve
Complex modulus curve
[image:7.595.94.504.461.721.2]Page 7 of 25
3.2
Equivalent properties for a granular system
The average density of a granular system is,
v
(4)where
v is the mean density of each particle and is the packing fraction. As the energy dissipationcontribution of inter-particle friction is ignored, the loss factor for the equivalent solid can be assumed
to be the same as the loss factor for the original viscoelastic material, hence,
v
(5)The effective Young’s modulus and Poisson’s ratio of a granular system are known to be much lower
than that of the bulk material. The approach taken in this paper was to use expressions for an equivalent
solid based on randomly packed identical spheres derived by Walton (1987). For rough spheres
subjected to an applied hydrostatic pressure
p
, the effective Poisson’s ratio for the equivalent solid is given by,
2(5 3 ) v v
(6)
and the associated Young’s modulus,
1 2 2 2 3
2 2
3
1 2
2
(1
)
v
E
N p
E
(7)where
v andE
v are the Poisson’s ratio and the elastic part of the Young’s modulus of the materialthat the spheres are formed of, and N the average number of contact points per particle (the
coordination number). From Equation 7 it can be seen that in addition to the properties of the polymer
material itself, there are three parameters that control behaviour: the packing fraction, the coordination
number and the confining pressure. These are discussed briefly in the following sections.
Packing fraction and coordination number
The specific way in which the particles are ordered within a cavity affects the packing ratio and the
coordination number. For regular arrangements, this can be calculated theoretically: for example, a
face-centred cubic (FCC) arrangement has a packing factor
0.74
and coordination number N12while for a cubic arrangement
0.524
and N6. Random arrangements have been studiednumerically and experimentally by many researchers (Iwata and Homma, 1974; Nolan and Kavanagh,
1992; Zamponi, 2008). It has been shown that packing is affected by factors such as friction, applied
pressure and size ratio between particle and container. Quoted values for mono-sized, randomly packed
Page 8 of 25
Confining pressure
In a cavity filled with particles, even under static conditions, the pressure (and hence the deflection)
varies with depth because of gravity loading. The granular system redirects some of the load to the
cavity walls so that the pressure in a deep fill is less than would be in an equivalent fluid. One of the
earliest models linking pressure to depth was provided by Janssen (1895) and the subject has remained
an active area of research since. For the purposes of this work, Janssen’s approach was considered
adequate to provide the confining pressure (in Equation 7) and therefore,
(1
Shg)
g
p
e
S
(8)where
g
is the acceleration due to gravity, hg is the depth in the direction of gravity, and
is anempirical load redirection factor that depends on the granular medium itself. S is the shape factor of
the container and is the ratio of the perimeter to the area of the container cross-section perpendicular to
gravity.
3.3
Specification of parameters
The equations in Section 3.2 show that even with considerable simplification, there remain a significant
number of parameters required to obtain an equivalent solid model. As some of these can vary
depending of the exact nature of the packing and others are not straightforward to measure exactly, an
attempt was made to take into account the resulting uncertainty. The field of uncertainty quantification
is extensive but is not discussed in detail here. Instead, a brief justification is provided for the approach
employed. From the literature and qualitative observations, it was clear that the parameters affecting
the arrangement of particles lie within typical ranges with more results near the mean value and a
relatively small number of outliers. For this reason the distribution was assumed Gaussian and the
range of values based on 2 standard deviations (approximately 95% of all results). Uncertainty was
then accounted for using 1000 different simulations with parameters selected randomly assuming a
Gaussian distribution. Alternatives to this approach would be to assume random distribution within a
range whose endpoints are uncertain, or to approach the problem from an info-gap theory perspective
(Ben-Haim, 2001). However, as the purpose of this exercise was to help judge the accuracy of
modelling approaches against inherent variability in the system rather than a dedicated evaluation of
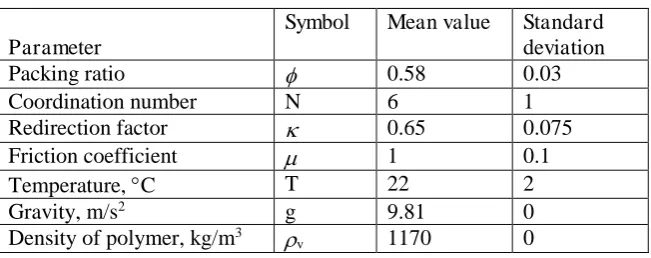
uncertainty, the method used was considered adequate. Values selected for parameters are given in
Page 9 of 25
Table 2: Parameters used to define the granular material
Parameter
Symbol Mean value Standard deviation
Packing ratio 0.58 0.03
Coordination number N 6 1
Redirection factor 0.65 0.075
Friction coefficient 1 0.1
Temperature, C T 22 2
Gravity, m/s2 g 9.81 0
Density of polymer, kg/m3
v 1170 0
It can be seen in Table 2 that the temperature is also taken as a variable parameter. While this is not a
specific property of the granular medium, the properties of the viscoelastic material were very sensitive
to temperature it and it was not possible to define it more precisely in the laboratory conditions. Other
parameters including dimensions were given crisp values. It was assumed that the ranges considered
for coordination number and packing fraction would account for variations in the depth caused by the
randomness of the particle locations.
4
Energy dissipation
This section reports a comparison between experimentally measured and numerically predicted energy
dissipation provided by a granular medium. In this study, the viscoelastic spheres discussed in Section
2 were placed in an open sided box and vibrated perpendicular to gravity over a relatively wide
frequency range at low overall amplitude. The test configuration was the same as used elsewhere to
characterise moderately low frequency, high amplitude damping in granular systems (Darabi and
Rongong, 2012). The suspension arrangement minimises energy losses from sources other than the
granular material.
4.1
Rigid box
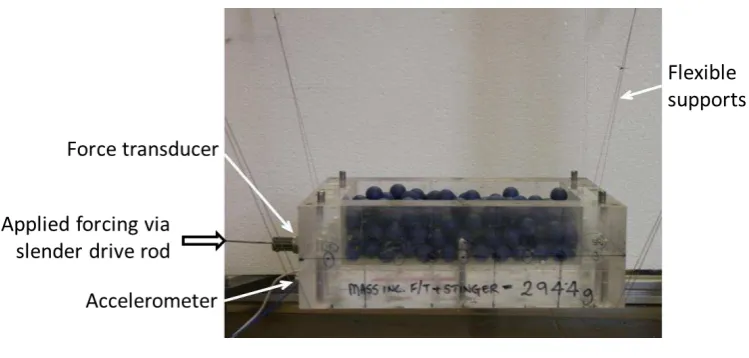
The open-sided box was constructed using polymethyl methacrylate (PMMA) blocks, each of thickness
30 mm, to create a cavity with dimensions 18012040 mm. The box was suspended with the open
side facing upwards using supports with sufficient flexibility to approximate free boundary conditions.
Excitation was applied horizontally in line with the longest dimension of the cavity as shown in Figure
Page 10 of 25
Figure 3: Rigid box configuration
The design of the box ensured that its fundamental resonance was much higher than the frequency range
of interest for this study (between 10 and 400 Hz). This allowed investigation of the performance of the
granular medium itself as the vibration of the boundaries did not change with position. Additionally,
as the box was shallow and had an open face, the level of confinement experienced by the particles was
relatively low.
4.2
Physical experiment
The box was suspended using nylon line and light metal springs in series. The suspension modes were
found to occur at frequencies below 5 Hz. Sinusoidal excitation was provided via an electrodynamic
exciter attached to one end of the box through a slender drive rod. The applied force was measured with
a piezoelectric transducer and the acceleration near the excitation point measured with a small
piezoelectric accelerometer. Force and acceleration signals were obtained for excitation amplitudes of
10, 1 and 0.1 m over a range of frequencies between 10 and 400 Hz. The experiment was first
conducted with the container empty in order to find the phase error due to the boundary conditions and
electronics. This error, although relatively small (5% at 350 Hz), was subtracted from measurement to
provide the corrected contribution of the granular medium. The container was filled with 260 randomly
placed particles and tests repeated. The dissipated power was obtained from,
1
|
||
| cos
2
real F V
P
F V
(9)where
F
and
F are respectively the amplitude and corrected phase angle of the force signal and Vand
V the amplitude and corrected phase angle of the velocity. Note that the frequency domain velocityPage 11 of 25
Figure 4: Measured power dissipation at different vibration amplitudes
As the dissipated power spans a very wide range of values, the final comparison between experiment
and prediction was made using an equivalent viscous damper (that is, a grounded viscous damper that
would dissipate power at an equivalent rate) so that results at different frequencies could be
conveniently plotted on the same figure. The equivalent viscous damper is defined as,
2 2 real eq
P c
V
(10)
4.3
Properties of equivalent solid
One of the parameters affecting the Young’s modulus of the equivalent solid is the confining pressure:
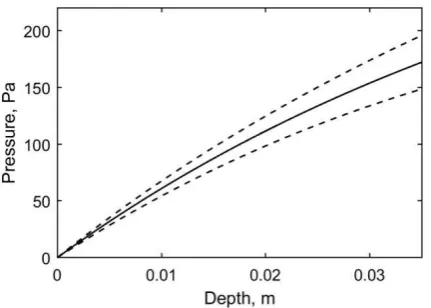
the relationship is described in Equation 7. The Janssen estimation for pressure using Equation 8 and
properties defined in Table 2 for this container is shown in Figure 5. Uncertainty bounds of two standard
deviations (approximately 95%) are also shown.
Figure 5: Pressure distribution in the box configuration (dashed lines show 2 bound)
[image:12.595.189.405.530.684.2]Page 12 of 25
in this experiment, the viscoelastic spheres were of significant size in comparison to the container depth
resulting in a variation of true depth across the surface. Thus, considering Equations 7 and 8 together,
the equivalent modulus of the granular medium varied throughout its volume and could vary depending
on the exact arrangement of particles. As such a variation in depth and modulus was inconvenient for
use with standard finite element analyses, the approach taken was to use properties at a depth of 18.7
mm – the mean depth obtained from the number of spheres and the fill ratio. Based on this
approximation, an average pressure of 103.7 Pa and standard deviation 6.7 Pa were used in subsequent
calculations.
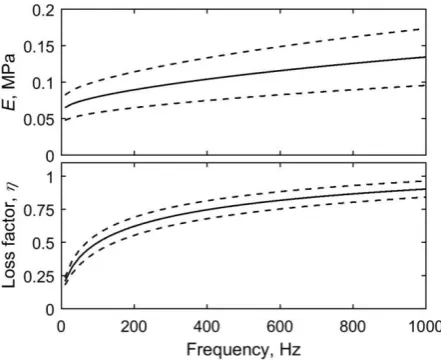
The equivalent complex modulus for the granular fill, obtained using Equations 5 to 7 is shown in
Figure 6. Note that the equivalent density had a mean value of 679 kg/m3 and a standard deviation of
[image:13.595.186.407.304.484.2]35 kg/m3.
Figure 6: Equivalent properties of granular fill in the open-sided box (dashed lines show 2
bounds)
4.4
Direct frequency response
With the complex modulus specified, one way to estimate the energy dissipation was to calculate the
dissipated power when the system is subjected to sinusoidal base motion. To account for frequency
dependence in the viscoelastic material, a Direct Frequency Response (DFR) calculation was performed
on a finite element model of a block representing the equivalent viscoelastic material. The block was
restrained on the five faces that would have contacted the inside of the box. Base motion was then
prescribed at this boundary. The reaction force for displacement amplitude vector
X
was,2
Page 13 of 25
where
K
,K
andM
are the complex stiffness and mass matrices of the finite element model. The equivalent viscous damper was obtained from this information using Equations 9 and 10. Note that inthe frequency domain V j X
.The direct frequency response is computationally expensive as it requires the inversion of the
impedance matrix for the full system at every desired frequency. Calculations were only attempted
using the mean value for modulus rather than for all 1000 variations.
4.5
Modal approach
A procedure using properties of the vibration modes of the granular medium was also investigated.
Normal eigenvalue analysis routines do not allow for frequency dependence of the modulus. As the
finite element model involved a single material only – the equivalent solid – it was reasonable to assume
that mode shapes were not affected by modulus and the natural frequencies varied according to,
, n re re f f f e n r
E
E
(12)where
n ref, is the natural frequency for a reference condition where the Young’s modulus was Erefand the density
ref . With this assumption, the vibration due to the base excitation of each mode couldbe summed. Hence, the force required to produce a given base motion amplitude
X
can be obtainedfor
A
modes using,2 2 1
1
2
1
2
A a a aa a a a
j
r
F
X
m
r
j
r
(13)where
m
a is the effective modal mass,r
a the ratio of the excitation frequency to the natural frequencyof each mode and
a the modal damping. Note that the modal damping in this case can be obtainedfrom the material loss factor using,
2
a
(14)In the work reported here, the first 1000 vibration modes of the block were found to span the desired
frequency range 0 to 400 Hz. Because of Equations 12 and 14, only one eigenvalue extraction
calculation was necessary. Subsequently, predictions were made for each of the 1000 variations in
material property. Power and hence equivalent viscous damper values were then found.
4.6
Results
The equivalent dampers for experiment, DFR and modal methods are presented in Figure 7. It can be
Page 14 of 25
lies within the uncertainty bound of the modal method but it lies towards the lower boundary. The
sudden rise in damping above approximately 60 Hz relates to the presence of the first wave mode in the
granular material. Predictions above 400 Hz were not attempted as more modes would have been
[image:15.595.187.409.170.324.2]required from the eigenvalue extraction routine.
Figure 7: Equivalent damper for box subjected to horizontal excitation
Deformed shapes, from the DFR calculation, are presented in Figure 8 to show the increasing
complexity of the standing waves as the frequency increases. It is interesting to note that significant
vertical movement of the granular material occurs for this configuration.
Figure 8: Section views of deformations within the granular medium at different frequencies
5
Composite tube assembly
In the previous section, it was shown that the equivalent solid model could be used in conjunction with
standard finite element analysis to predict energy dissipation in granular materials subjected to low
amplitude vibration. In this section, efforts are made to predict the frequency response of a typical
engineering structure damped using a granular fill.
5.1
Composite tube assembly
This configuration involved a circular-section, roll-wrapped, carbon fibre composite tube fitted with
[image:15.595.152.444.466.536.2]Page 15 of 25
mean wall thickness of 1.8 mm. Push-fitting solid aluminium caps, whose dimensions are shown in
Figure 9, were attached to the ends. The entire system was suspended vertically from the upper end cap
[image:16.595.219.384.151.316.2]while excitation was applied horizontally on the lower cap.
Figure 9: Composite tube assembly
Features of this configuration that made it interesting for this study include:
1. Non-parallel walls in the direction of forcing,
2. A deep cavity allowing for a significant build-up of static pressure within the granular medium,
[image:16.595.191.410.454.578.2]3. A multi-part structure with different materials – specified in Table 3.
Table 3: Properties of composite tube assembly
Part Property Unit Value Tube E (along tube) GPa 85
E (other directions) GPa 19 Shear modulus GPa 4.6 Poisson’s ratio 0.14 Density kg/m3 1600
End cap E GPa 70
Density kg/m3 2700 Poisson’s ratio 0.33
This configuration was intended to provide suitably challenging conditions for the prediction methods
to be tested under.
5.2
Experimental results
The composite tube assembly was suspended vertically using similar nylon line and helical springs as
the box described in Section 3. As with the box, suspension modes were found to occur below 5 Hz.
Vibration input was supplied by an electrodynamic exciter capable of delivering 100 N peak sine force.
Page 16 of 25
was measured at both end caps at positions diametrically opposite the force transducer using miniature
accelerometers.
Low amplitude, band-limited random excitation was applied to the structure and the acquisition system
was set to obtain the frequency response function (FRF) based on 100 averages using a Hann window.
For conciseness, results presented here focus on results obtained using the accelerometer attached to
the same end cap as which forcing was applied. However, it was verified that measurements taken at
the other end cap would have provided the same conclusions.
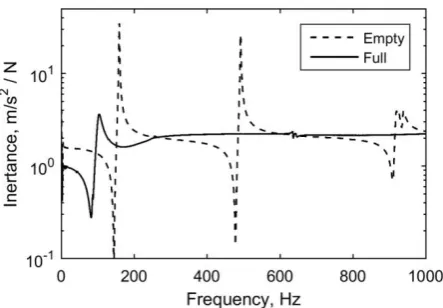
FRFs for the composite tube assembly empty and full of the granular material are presented in Figure
10. For the empty system, lightly damped resonances can be seen at 159, 492 and 921 Hz. When
approximately 1.7 kg of spherical particles was used to fill the tube, the higher frequency resonances
vanished while the damping ratio of the first resonance increased from 0.001 to 0.064. This level of fill,
where the added mass of particles is approximately the same as the mass of the host structure, is not
often practical for use. However, it was considered useful for this study as it provided an extreme case
[image:17.595.187.409.365.519.2]for the simulation methods to deal with.
Figure 10: Measured frequency response of composite tube assembly
5.3
Predicted results
The frequency response of the tube was predicted using FE analysis and employing the equivalent solid
assumption. Responses were calculated using both the DFR routine and a modal approach which is
described below.
Material properties
The depth of the tube and the high coefficient of friction between particles meant that the pressure
reached a limiting value at depths exceeding 0.1 metres – see Figure 11. Hence most of the granular
material was at uniform pressure. For subsequent calculations therefore a nominal value of pressure
was used for each simulation. This was defined as the average pressure through the volume after
Page 17 of 25
Figure 11: Pressure distribution in tube with depth (dashed lines show the 2 bounds)
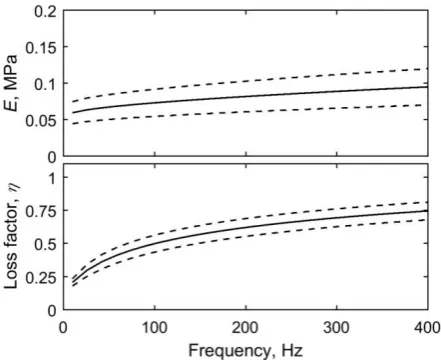
Complex modulus data were obtained for each of the 1000 variations of material properties using
Equation 7. The mean and range of these properties with frequency is shown on Figure 12.
Figure 12: Equivalent properties of granular fill in the composite tube assembly (dashed lines
show the 2 bounds)
Response prediction
Because of computational expense, the DFR calculation was only carried out for one set of material
properties – the average values. A modal approach was developed to allow faster evaluation of the
results. Unlike the box discussed in the previous section, it was not possible to extract the vibration
modes of a filled tube directly and adjust values according to exact modulus and density. This was
because the size of the cavity meant that there were a very large number of wave modes in the granular
medium: the 1500th vibration mode had a natural frequency below 300 Hz. Also, because the structure
[image:18.595.187.408.335.515.2]Page 18 of 25
approach taken here involved combining analysis originally developed for thick, soft viscoelastic layers
with FE based modal analysis of the empty structure.
Ungar and Kerwin (1964) were the first to show that vibration levels in a metal-viscoelastic structure
can be reduced if standing waves are induced within the viscoelastic portion. They developed
expressions for the energy stored and dissipated in a thick viscoelastic layer attached to a flat metal
plate subjected to out-of-plane vibrations. Defining
x
andu
to be the position and displacementperpendicular to the plate surface, they represented the motion within the layer using the wave equation,
2 2
2
0
d u
k u
dx
(15)where at frequency , the complex wavenumber is,
1 2
(1
)(1 2 )
(1
)
k
k
jk
E
(16)For a layer of thickness
h
2 subjected to base plate motion ofu
0, noting that the strain at the free surfaceis zero, they showed that the deflection in the layer is given by,
0 2 2cos
cos(
)
kx kh
u
u
kh
(17)from which they derived expressions for peak kinetic energy and work done per cycle. These
expressions were defined per unit area of the plate i.e. the area perpendicular to the direction of motion.
Subsequently, House and Hilliar (1990) recognised that the deflection of material enclosed between
face plates could be represented by the same equation because of symmetry, provided that
h
2 was setas the distance from one wall to the centreline and the face plates did not move relative to one another.
For these conditions, the average energy dissipation per radian is given by,
2 2
0 2
2 2
sinh(
)
sin(
)
4
1
cos
sinh
2
2
k h
k h
h
k h
k h
D
u
k h
k h
(18)where h the full depth of the granular medium in the direction of motion. In the same way, the peak
kinetic energy in the granular medium is,
2 2 0
2 2
sinh(
)
sin(
)
4
cos
sinh
2
2
k h
k h
h
k h
k h
T
u
k h
k h
Page 19 of 25
While previous studies have generally focused on systems with parallel faces such as layered plates and
box section beams, it is possible to approximate behaviour for cavities with non-parallel faces because
the energy expressions are defined per unit area. Consider a segment depth h through the entire
structure in line with the applied excitation which has area
s perpendicular to the excitation. If thewalls at each end move by the same amount, Equations 18 and 19 can be applied to that segment.
Summing over the entire area perpendicular to the excitation, the system loss factor can be defined as,
energy dissipated per radian
peak strain energy
s s b
D
T
T
(20)where
T
b is the kinetic energy in the host structure.In the most general case, the host structure is subject to resonant vibration. If the cavity is extensive,
different parts may move by significantly different amounts. To keep the analysis simple, it was
assumed in this work that the walls of the cavity directly opposite each other did not move relative to
one another, effectively neglecting squashing or stretching of the cavity. The average motion of a unit
segment of the cavity is therefore given as,
0 T
u q
(21)where is the vector of average mode shapes of the cavity walls and
q
is the vector of coefficientsdescribing the participation of individual modes in a particular vibration. Also, noting that at resonance
the damping ratio is half the value of the loss factor, it can be expressed as,
2
2 2
1
2
A s s s b b
D
T
T
(22)where
s is the specific mode shape at the cavity segment considered and
b2 is the average squaredmode shape of the entire host structure.
In this way, it was possible to account for the damping from the granular material using the finite
element model for the empty host structure. However, as the added mass of the granular material was
significant, natural frequencies, modal masses and mode shapes of the host structure would have been
changed considerably. In this work, to account for this, the mass of the granular fill was distributed
evenly around the boundary of the cavity by increasing the density of the composite material to account
for the added particles. The mass of the segment of composite tube encasing the particles was 0.579 kg.
To account for the addition of 1.7 kg of particles, the density of these elements was raised to 6224
kg/m3.
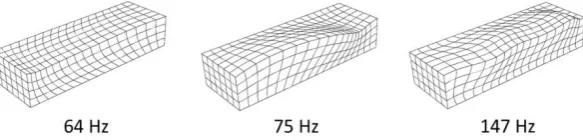
Within the frequency range of interest, the tube displayed three types of vibration mode: flexure (similar
Page 20 of 25
Examples of these mode types are presented in Figure 13 while natural frequencies of the lower modes
[image:21.595.217.365.123.290.2]are presented in Table 4.
Figure 13: Mode types for the tube assembly
Table 4: Natural frequencies of the tube assembly
Mode Number
Mode type Natural frequency, Hz
Empty Full
1,2 Flexure 156 101
3 Torsion 272 227
4,5 Flexure 489 278
6 Torsion 797 494
7,8 Flexure 936 510
9,10 Tube wall 1164 590
11,12 Tube wall 1191 604
13,14 Tube wall 1259 638
15,16 Tube wall 1380 701
17,18 Flexure 1382 766
The frequency response was then calculated from the modal data using,
2 ,2 ,
1 , 2 ,
A
a in a out
a a n a a n a
X
F m j
(23)where
m
a is the modal mass,
a in, and
a out, are the mode shape at forcing and measurement pointrespectively. Frequency responses for the 1000 variations in material properties calculated using this
[image:21.595.166.426.358.535.2]Page 21 of 25
Figure 14: Predicted FRF curves modal data (all 1000 variations)
5.4
Comparison between measured and predicted behaviour
Frequency responses produced from the two numerical approaches are compared with the
experimentally obtained response in Figure 15. For clarity, only the average modal response curve is
shown on this plot.
Figure 15: Comparison of FRF prediction methods against measured
It can be seen that all three curves lie relatively close to one another – particular if one considers the
response before the granular fill was added (Figure 10). The DFR result is somewhat closer to the
experiment. However, this is not wholly surprising considering the simplifications involved in the
modal approach. Careful observation shows that the largest errors in the modal method occur at
frequencies near the torsion modes (227 and 494 Hz) that involve significant deformation of the tube
cross-section which makes the average motion assumption less accurate.
It is interesting to observe what is happening inside the granular medium as the tube vibrates. Cross
sectional views of the tube at different frequencies are shown in Figure 16. Note that the excitation
[image:22.595.187.407.374.532.2]Page 22 of 25
Figure 16: Section view of filled tube at different frequencies taken from DFR analysis
At low frequencies, the centre of the granular medium moves more or less in phase with the walls. As
the frequency increases, the centre tends to deflect more than the walls and the phase difference
increases. At 170 Hz, the frequency at which the loss factor is maximised according to Equation 20, the
motion of the centre is 180 out of phase with the walls and of a similar magnitude. As the frequency
increases further, the motion of the centre reduces towards zero and deformation of the granular fill
involves higher order waves in the radial direction.
6
Limits of applicability
The work has shown that the prediction methods discussed in this work provide good estimates of
energy dissipation and host structure vibration. For the box structure, it can be seen from Figure 7 that
the prediction remains accurate for acceleration levels as high as 6 m/s2. It was considered important to
investigate the acceleration amplitude to which such methods are valid. The composite tube assembly
was used for this experimental study.
The main difference between the testing done here and that reported in Section 5 was that
amplitude-controlled sinusoidal forcing was used instead of random. As only the first resonance near 100 Hz was
detectable, stepped-sine testing was concentrated around this frequency. Results for natural frequency
and modal damping ratio are presented in Figures 17 and 18.
[image:23.595.190.403.578.733.2]Page 23 of 25
Figure 18: Damping ratio of first mode
It can be seen from the results that when the acceleration increases beyond approximately 4 m/s2, results
start to deviate from the prediction: natural frequencies drop at higher amplitudes and damping ratios
increase due to the added contribution of friction at the interfaces. For this mode, vibration at the tube
midpoint is around 16% higher than at the measurement point. Also, from Equation 17, it can be found
that the ratio of the motion at the centre of the fill to the tube wall is approximately 2.2. The condition
under which the equivalent solid approximation begins to fail is therefore approximately the point at
which the largest motion in the bulk of the granular material exceeds gravity. This is consistent with
the findings of Poschel et al (2000).
7
Conclusions
This paper set out to develop and evaluate prediction methods for viscoelastic granular dampers under
low amplitude vibrations that are compatible with commercial finite element analysis software and can
be used for irregular cavities. The work has demonstrated two methods that achieve this to reasonable
accuracy. Both rely on modelling the medium as a solid and on obtaining equivalent elastic properties.
One method uses the Direct Frequency Response and although computationally expensive, will provide
reliable predictions. The other approach involves combining standard eigenvalue-based mode
extraction routines with theoretical approximations that yield modal damping ratios. This approach is
inexpensive in terms of computing effort.
The effectiveness of these methods was demonstrated by comparing predictions with experimental
results from two very different experimental configurations. An rigid open box was used to study the
energy dissipation over a range of frequencies. This showed that dissipation increased once standing
waves were generated in the granular medium. A composite tube with heavy metallic ends was used to
show the effectiveness of the methods in the predicting frequency response of a structure damped using
viscoelastic granules. In both cases, the predictions matched the measured results with reasonable
Page 24 of 25
A numerical study showed that while the arrangement of the granular system could vary significantly,
the overall effect on the energy dissipation and damping were not dramatic. Experiments also showed
that for the particles considered, equivalent solid type behaviour was observed up to approximately the
acceleration due to gravity. Damping tended to increase as the amplitude rose beyond this. This result
shows that in this type of granular system, energy is dissipated primarily within the particles at low
amplitudes however frictional losses become significant when the bulk acceleration levels within the
granular medium approach that of gravity.
References
Ben-Haim Y (2001) Information-Gap Theory: Decisions under severe uncertainty. Academic Press,
London.
Darabi B and Rongong JA (2012) Polymeric particle dampers under steady-state vibrations. Journal of
Sound and Vibration, 313, 3304-3316.
Ferry JD (1980) Viscoelastic properties of polymers. John Wiley & Sons.
House JR and Hilliar AE (1990) Vibration Damping Materials. WIPO International Patent
Classification F16F7/00, G10K11/16. International Publication Number WO90/01645.
Iwata H and Homma T (1974) Distribution of coordination numbers in random packing of
homogeneous spheres. Powder Technology, 10, 79-83.
Janssen HA (1895) Experiments on grain pressure in silos. Transactions of the Association of German
Engineers, 39, 1045–1049.
Nolan GT and Kavanagh PE (1992) Computer simulation of random packing of hard spheres, Powder
Technology, 72, 149-155.
Oyadiji SO (1996) Damping of vibration of hollow beams using viscoelastic spheres. Proceedings of
Smart Structures and Materials: Damping and Isolation, San Diego, SPIE Vol. 2720, 89-98.
Pamley RJ, House JR and Brennan MJ (2001) Comparison of passive damping treatments for hollow
structures. Proceedings of Smart Structures and Materials: Damping and Isolation, Newport
Beach, SPIE Vol. 4331, 455-467.
Rongong JA, Tomlinson GR (2002) Vibration damping using granular viscoelastic materials.
Proceeding of ISMA 27, Noise and Vibration Engineering Conference, Leuven, Belgium,
431-440.
Ungar EE and Kerwin EM (1964) Plate damping due to thickness deformations in attached viscoelastic
layers. Journal of the Acoustical Society of America, 36(2), 384-392.
Varanasi KK and Nayfeh SA (2006) Damping of flexural vibration using low-density, low-wave-speed
Page 25 of 25
Poschel T, Schwager T and Saluena C (2000) Onset of fluidization in vertically shaken granular
material, Physical Review E, 62 (1), 1361-1367.
Walton K (1987) The effective elastic moduli of a random packing of spheres. Journal of the Mechanics
and Physics of Solids, 35 213-26.