Deep Analytical Study of Free Space and Under
Water Optical Wireless Communication Systems
Performance Parameters Estimation
Ahmed Nabih Zaki Rashed
1*, Abd El-Naser A. Mohammed
2, and Ehab Salah
El-dien
31,2,3
Electronics and Electrical Communications Engineering Department
Faculty of Electronic Engineering, Menouf 32951, Menoufia University, EGYPT
Abstract— This paper has presented the deep analytical study of free space and under water optical wireless communication systems performance parameters estimation over wide range of the affecting parameters. The effect of fog attenuation on optical wireless communication link is deeply investigated. Scattering coefficient, signal attenuation, receiver signal power, signal transmission, optical thickness or optical depth, link margin, data rate, signal to noise ratio (SNR), and bit error rate (BER) are the major interesting performance parameters in the current study for free space optics. On the other underwater optical wireless communication systems are also deeply investigated. Due to its high attenuation in water, a radio frequency (RF) carrier is not the optimum choice. Acoustic techniques have made tremendous progress in establishing wireless underwater links, but they are ultimately limited in bandwidth. In traditional communication systems, constructing a link budget is often relatively straight forward. In the case of underwater optical systems the variations in the optical properties of sea water lead to interesting problems when considering the feasibility and reliability of underwater optical links. The main focus of this paper is to construct an underwater link budget which includes the effects of scattering and absorption of realistic sea water.
Index Terms— Free space optics, Under Water optical wireless, Fog attenuation, Link margin, Data rate, and Performance parameters.
I. INTRODUCTION
An optical wireless (OW) or Free Space Optics (FSO) link can be established using Lasers or light emitting diode (LED) between any two line of sight points in free space for a certain link distance, enabling point-to-point data links at rates exceeding 1 Gbit/sec. Lasers work in the visible and near infrared spectrum of the electromagnetic radiations. The inherent advantage of using lasers for establishing connection between two geographically separated line of sight points provides a well-focused narrow beam that on one hand is secured and on the other hand is less scattered as it traverses the free space mostly the earth atmosphere [1, 2]. OW is now finding niche applications both in military as well as commercial services sectors and is being researched for scenarios involving communication between fixed as well as mobile platforms. Few of the potential application scenarios of OW links are transmission links between satellites, links for deep space missions, links between unmanned aerial vehicles (UAV), high altitude platforms (HAP), data links from earth to satellites and reestablishing high speed connections in case of emergency or disaster recovery situations [2]. The optical beam traversing through the earth atmosphere is attenuated by absorption and scattering of radiation from fog, clouds, snow, rain, sleet and dust etc. This attenuation is typically dominated by fog, clouds and snow. However, the attenuation due to snow, rain and sleet etc., is generally less significant as compared to signal transmission through fog and clouds, such that the optical signal becomes weak enough that the communication system will cease to operate [3]. The real challenge to these optical wireless links arise in the presence of different fog conditions: as the size of the fog particles is comparable to the optical wavelengths used for transmission [4]. The most commonly used wavelengths (850 nm, 1300 nm, 1550 nm) in FSO fall inside the transmission window such that the contribution of attenuations from phenomena like absorption to total extinction are almost negligible as compared to scattering, the most dominant factor of optical signal attenuation in free space[5]. A resurgence is occurring in the area of underwater laser communications. While acoustic systems are currently the more mature technology, they are ultimately band-limited to sub MHz type data rates due to the frequency dependent absorption of acoustic energies in water [6]. Advances in fiber optic and free space links have shown promise for optical links to provide data
rates in excess of a gigabit per second. It is not surprising then, that laser links are being considered for Naval applications involving high bandwidth communications undersea. A major challenge in implementing optical links underwater arises from the spatial dispersion of photons due to scattering. Spatial spreading of the optical beam reduces the photon density at the receiver position. A such [7], optical links are only expected to be of greatest utility in links <100 m. Nonetheless, it appears that end users may accept limited link range in exchange for the gain in information bandwidth that optical links may provide. Additionally, researchers continue to study how spatial spreading affects the time encoded portion of the transmitted optical signal. Temporal dispersion arising from multiple scattering events may result in inter-symbol interference (ISI), further limiting link range and/or capacity [8]. The challenges of underwater communication while at speed and depth are widely known in Naval communities. Despite rapid growth in radio frequency (RF) wireless technologies, undersea applications were relatively unaffected, as radio frequencies do not penetrate the sea surface and are highly absorbed by water. RF communication from land to submarines, but it is terribly inefficient due to the large ground stations required and results in dreadfully low bandwidths compared to today‘s communication standards. Acoustic techniques on the other hand have enjoyed large success in providing moderate data rates undersea [9].
II. MATHEMATICAL MODELING ANALYSIS
II. 1. FREE SPACE OPTICS MODEL
Fogs are composed of very fine water droplets of water, smoke, ice or combination of these suspended in the air near the Earth's surface [10]. The presences of these droplets act to scatter the light and so reduce the visibility near the ground. A fog layer is reported whenever the horizontal visibility at the surface is less than 1 km [7, 8]. Normally, after sunset a strong cooling takes place near the earth surface through the divergence effect of long wave radiation. As the cooling increases, the relative humidity (the ratio of absolute humidity to saturation) increases until fog droplets are activated. Typically, fog formation takes place as the difference between temperature and dew point becomes (5 °F) 3 °C, or less and as a result water vapors in the air begin to condense into liquid
water form while relative humidity reaches to 100% [11]. The scattering coefficient can be expressed as a function of the visibility and wavelength. The scattering coefficient in hazy days can be determined by using the following formula [12]:
q nm V 3.912 550 (1)
Where V is the visibility in meters, λ is the optical signal wavelength in nanometers and q is the size distribution of the scattering particles (0.16 V+0.34 if 1 km < V < 6 km, q=V-0.5 for 0.5 km < V < 1 km, and q=0 for V < 0.5 km). The atmospheric attenuation is described by the following Beer‘s Law equation [13]:
) ( exp log 10 L (2)
Where L is the optical path length. As well as the signal transmission, T can be described by the following equation:
L
T exp (3) It is possible to identify a fog condition with a visibility range and relate it to the optical attenuation by using the Kruse formula. However, this formula is inapplicable to fog because the wavelength dependence of fog is too small in the visible and infrared range [14]. The parameter that indicates the thickness of fog is the optical depth. Optical depth generally indicates the average number of interactions that light will incur when propagating through a multiple-scatter channel. The optical depth τ is defined as a function of atmosphere attenuation and optical path length as follows: 343 . 4 L (4)
Advection fog is formed by the movement of wet and warm air masses above colder maritime or terrestrial surfaces. It is characterized by liquid water content higher than 0.20 g/m3 and a
particle diameter close to 20 μm [16]. Therefore the advection fog attenuation coefficients is given as [15]:
V
adv 0.114783.8367
(5)
Radiation fog is related to the ground cooling by radiation. It appears when the air is sufficiently cool and becomes saturated. This fog generally appears during the night and at the end of the day. Particle diameter is around 4 μm and the liquid water content varies between 0.01 and 0.1 g/m3 [16]. Therefore the radiation fog attenuation coefficients is described by:
V rad 0.18127 0.13709 3.7502 2 (6)Consider a laser transmitting a total signal power PS at the
specified wavelength. The signal power received at the communications detector can be expressed as [16]:
R T L rad adv R S R L D P P ) /10 ( 210 (7)
Where DR is the receiver diameter, θ is the transmitter divergence
angle, α is the atmospheric attenuation factor (dB/m), ηT, ηR are the
transmitter and receiver optical efficiency respectively. As well as the achievable data rate R can be obtained from [16]:
b P R L rad adv R S N E L D P P R 2 2 2 10 / ) ( 2 10 (8)
Where EP=hc/λ is the photon energy at wavelength λ and Nb is the
receiver sensitivity. Another important parameter in optical communications link analysis is "Link Margin", which is the ratio of available received power to the receiver power required to achieve a specified bit error rate (BER) at a given data rate. Note that the required power at the receiver to achieve a given data rate, R (Tb/s), we can define the link margin LM as [16]:
R T L rad adv R b S L D c h R N P LM ( ) /10 2 2 2 10 (9)
By using the least squares method, a simple quadratic relationship between the time delay spread, D and the optical depth, τ is expressed as the following formula [17]:
9 9 2 11 1.4 10 1.9 10 10 9 . 9 x x x D (10)
Noise in the system depends on the characteristics of a receiver. A receiver is basically composed of photodetector and detection components. A photodetector changes the optical signal to an electrical signal. Detection components process and demodulate an electrical signal. A simple OOK system with an integrate and dump receiver, so that the transmitter and receiver filters are identical and its behavior is similar to a band pass filter. The optical signal with OOK encoding carries no negative power, but when optical signal is converted to an electrical signal, both DC and AC components occur. The DC component is filtered out before the detection process and that only the AC component undergoes maximum-likelihood detection [11, 12]. The background power noise can be defined by:
2 R Fexp KBG BG H FOV A T P (11)Where HKBG is the background radiance, FOV is the receiver field
of view, AR is the receiver area defined as AR= π(DR/2)2, Δλ is
fiber optic bandwidth, and TF is the filter transmissivity. For noise
consideration, the variances in detected current resulting from background radiation, thermal and shot noise are defined [14, 15]:
B P q BG BG 2 ,TH
4kTeFB
/RL , B P q R SS 2 (12)Where F is the noise figure, k is the Boatmen's constant, Te is the
equivalent temperature, q is the electron charge, B is the detector electronic bandwidth, and ζ is the responsivity (in amperes per watt) is used to characterize the efficiency of a photodiode in converting light to an electrical signal. However, interested in correlating the Q-factor for a range of transmittance of the received signal and for different fog conditions. The Q-factor, which represents the signal to noise ratio (SNR) at the receiver with no fog, is given as:
1 0 0 1 0 T I I Q (13)
Where T0 is the maximum transmittance and is equal to the unity.
I1 and I0 are the average detected signal current for bit ‗1‘ (on state)
and ‗0‘ (off state) where as σ0 and σ1 are the standard deviation of
the noise values for bit ‗1‘ and ‗0‘ which are defined by [13, 14]:
, 1 PR PBG I 2 2 2 1 SS TH BG (14) , 0 PBG I 2 2 0 TH BG (15) However, with fog and assuming the ambient noise level does not change with fog density, the Q-factor in dB Units can be approximated as [14]:
dB T QQ 10log10 (16) The connection between BER and SNR or Q-factor is given by the following equation [15]: ) 4 ( exp 1 Q Q BER (17)
II. 2. UNDER WATER OPTICAL WIRELESS COMMUNICATION
SYSTEMS MODELIn the design of optical fiber systems, one computes a link budget to determine if information can be successfully transmitted over the desired distance [16]. Typically one considers an optical power budget and a bandwidth budget. The power budget is to determine that there is sufficient signal to noise for a specific bit error rate. The bandwidth budget determines the rate at which bits can be distinguished from adjacent bits in the bit stream and is a function of the rise and fall times of the light source and receiver, which are typically fast, and the dispersion of the optical pulse introduced by the fiber which depends on the information channel.
Typically the dispersion of the information channel is the limiting factor of the bandwidth budget [17].
II. 2. 1. WIRELESS POWER LINK BUDGET
The basic formula for a typical optical link is an exponential decaying as function of the optical path length L as the following expression [18]:
, 2 L T r T R e L D D P P (18)Where PR is the received power after traveling the optical path
length L through the lossy medium, PT is the initial transmitted
signal power, and α is the total attenuation coefficient of the medium, Dr is the diameter of the receiver aperture, DT is the
diameter of the transmitter lens, θ is the transmitter divergence of the beam in mradians, and θ is the transmitter divergence of the beam which can be given by:
, 720 2 T D (19)
II. 2. 2. UNDERWATER OPTICAL LINK BUDGET MODEL
II. 2. 2. 1. ABSORPTION MODEL
The absorption as the spectral absorption coefficient, a(λ), which is the change in the beam of light due to the absorption by the medium per meter of path length [19]. The total absorption is a linear combination of the absorption properties of pure seawater, chlorophyll absorption as a function of wavelength and concentration, and the two components colored dissolved organic materials (CDOM). The splitting of the yellow substance into two components allows the model to be universal for all biologically stable waters and it permits models in the future to include the effects of fluorescence in a more consistent manner. The absorption coefficient a(λ) is given by:
a(λ)=aw(λ)+acl(λ)+af(λ)+ah(λ) , (20)
Where aw(λ) is the absorption coefficient of water as a function of
wavelength (m-1), a
cl(λ) is the absorption chlorophyll acid
coefficient as a function of wavelength, af(λ) is the fulvic acid
absorption coefficient and ah(λ) is the humic acid absorption
coefficient both as a function of wavelength. The absorption coefficient for sea water type, aw(λ), was interpolated from data
from [20] with respect to water concentration of w = 1 mg/mc0 3,
and water concentrations 0 ≤ wc ≤ 15 mg/m3. It then became:
, 0 0 0 w a c c w w w w a a (21)For sea water aw0
aw00.0405.As well as the absorption coefficient for chlorophyll, acl(λ), was interpolated from data from[21] with respect to a chlorophyll concentration of C = 1 mg/mc0 3
and chlorophyll concentrations 0 ≤Cc ≤ 12 mg/m3. It then became:
, 0602 . 0 0 0 w D c c c cl C C a a (22)For a0c
0.0602, Dw is the water depth then next, theabsorption coefficient of the yellow substance which is broken into two separate components: humic, ah(λ), and fulvic, af(λ) acid.
h0 hexp
h
, h a C k a (23)
0f fexp
f
, f a C k a (24) Where kh= 0.01105/nm,a =18.828 mh0 2/mg is the specificabsorption coefficient of humic acid, the first component of CDOM and kf= 0.0189/nm, a = 35.959 m0f 2/mg is the specific
absorption coefficient of fulvic acid, the second component of
CDOM. Also, Ch and Cf are the concentration of humic acids and
fulvic acids in mg/m3, respectively and can be expressed [22]:
, 12327 . 0 exp 74098 . 1 0 c c c f C C C C (25) , 12343 . 0 exp 19334 . 0 0 c c c h C C C C (26)
II.
2.
2.
2.
S
CATTERING MODELThis phenomenon as called the spectral beam scattering coefficient, b(λ), which describes the loss of flux due to the redirection of photons by means of total scattering. The total scattering is a linear combination of the scattering coefficient of water, bw(λ), scattering from small particles, b (λ) as a function of s0
wavelength and concentration, and scattering form large particle,
0
l
b (λ) as a function of wavelength and concentration. From Ref.
[23] b(λ) is given by:
b
b0
C b0
C1,b w s s l (27) The equation for bw(λ) is derived by interpolating the data
published by Ref. [24] to get:
0.005826 0.4 , 322 . 4 P w b m-1 (28)Where P is the water pressure, the spectral dependencies for scattering coefficients of small and large particulate matter are given by the formulas below:
, 4 . 0 151302 . 1 7 . 1 0 s b m2/g (29) , 4 . 0 3411 . 0 3 . 0 0 l b m2/g (30)
Where Cs and Cl are the total concentration of small and large
particles in g/m3, respectively given by:
, 11631 . 0 exp 01739 . 0 0 c c c s C C C C g/m3 (31) , 03092 . 0 exp 76284 . 0 0 c c c l C C C C g/m3 (32)
The total spectral attenuation coefficient, α(λ) is defined as the sum of the spectral absorption coefficient and spectral scattering coefficient:
α(λ)=a(λ)+b(λ) , (33) Then the total attenuation can be expressed in dB/m as the following expression:
/ 10log
10log
, dBm a b (34)
II.
2.3.
O
PTICAL WIRELESS COMMUNICATION LINKTo consider the design of underwater optical communications systems for propagation of light in water, the light noise, and the basic light in water attenuation parameters as analyzed above. The main parameters in underwater communications are shown in the evaluation criterion for optical communication, Signal-to-noise (SNR), noise equivalent power (NEP) and bit rate (BR). The SNR is defined as the ratio of a signal power to the noise power corrupting the signal [25]:
2
2 2 cos 4 3 exp tan RX R medium TX T NEP FOV D L L P SNR (35)This equation assumes the beam pattern of the transmitter is a constant for angles up to the 3-dB (halfway) point and zero beyond
that angle. Where PT is the transmitter power in mWatt, θ half
angle transmitter beamwidth in degree, α(λ) is the signal attenuation as a function of wavelength, L is the transmission distance in km, DR is the receiver a aperture diameter in meter,
FOV is the receiver field of view which is defined as the angle between the optical axis of the receiver and the line of sight between transmitter and receiver, noise equivalent power (NEP) is defined as the incident optical power at a particular wavelength or with a specified spectral content required to produce a
photodetector current equal to the root mean square noise current and can be [26]: , 2 c h NEP (36)
Where h is the Planck's constant (6.02x10⁻³⁴ J/sec), c is the velocity
of light (3x10⁸ m/sec), η is the quantum efficiency, and λ is the
operation optical signal wavelength. The basic components of optical wireless communication system links are shown in Fig. 1, to Illustrate of signal to noise ratio equation concept [27, 28].
Fig. 1. Block diagram of under optical wireless communication model. By using MATLAB curve fitting program, the fitting the
relationship between the optical received power and bit error rate (BER) can be expressed as [29]:
, 001 . 0 1077 . 0 10 4969 . 0 x 9 PR PR2 BER (37)
III. SIMULATION RESULTS AND PERFORMANCE ANALYSIS
The model has been investigated to enhance the high signal quality and best performance of wireless optical under water and free space communication networks for different visibility line of sight between transmitter and receiver to upgrade signal to noise ratio, received power, link margin, transmission bit rate and decreased BER and then to upgrade the transmission bit distance product over wide range of the affecting parameters al listed in Tables 1, 2.
Table 1: List of operating parameters used in the simulation for free space optics system [1, 5, 9, 12].
Operating parameter Value and unit
Transmitted signal power, PT 100 mW Operating signal wavelength, λ 1300 ≤ , nm ≤ 1550 Visibility range with thick fog, VThick 0.07 ≤ VThick, km ≤ 0.25 Visibility range with moderate fog, VModerate 0.25 ≤ VModerate, km ≤ 0.5 Visibility range with light fog, VLight 0.5 ≤ VLight, km ≤ 1 Low visibility, VLow 1 ≤ VLow, km ≤ 6
Transmitter efficiency, ηT 0.9
Receiver efficiency, ηR 0.9
Receiver diameter, DR 10 cm
Transmitter divergence angle, θ 2 mrad
Receiver sensitivity, Nb -30 dBm
Optical path length, L 0.5 ≤ L, km ≤ 5 Background radiance, HKBG 0.2 Wm−2 nm−1 sr−1 Receiver field of view, FOV 5 mrad
Filter optic bandwidth, Δλ 10 nm
Filter transmissivity, TF 0.5
Electron charge, q 1.6x10⁻¹⁹ C
Detector electronic bandwidth, B 10 MHz
Receiver responsivity, ζ 0.9 A/W
Noise figure, F 2.5 dB
Boltzmann‘s constant, k 1.381×10⁻²³ J/K
Equivalent temperature, Te 300 K
Table 2: List of operating parameters used in the simulation for under water optical wireless system [18, 20, 23, 27].
Operating parameter Value and unit
Transmitted signal power, PT 100 mW Operating signal wavelength, λ 1300nm-1550 nm Transmitter lens diameter, Dt 20 cm Receiver aperture diameter, Dr 10 cm
Receiver angle, υ 60 degree
Pure sea water Cc=0.03 mg/m3, wc=0.035 mg/m3
Quantum efficiency, η 0.9
Receiver diameter, DR 10 cm
Transmitter divergence angle, θ 2 mrad Optical path length, L 0.5 ≤ L, km ≤ 5 Receiver field of view, FOV 5 mrad
Water depth, Dw 0 km-10 km
Water pressure, P 10 MN/m2
III. 1. FREE SPACE OPTICS COMMUNICATIONS
Based on the modeling equations analysis and the assumed set of the operating system parameters as shown in Table 1, the following facts are assured as shown in the series of Figs. (2-21):
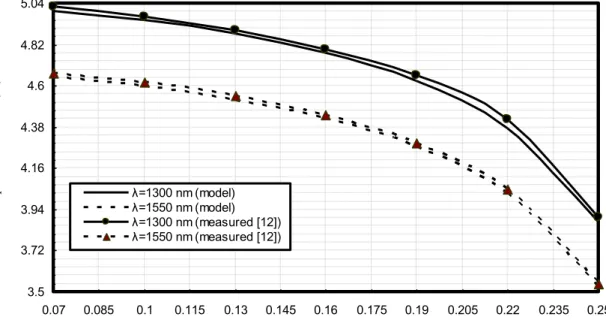
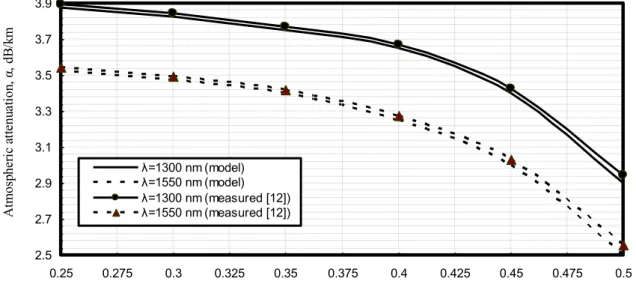
i) Figs. (2-7) have assured that allowable signal attenuation decreases for increasing of both operating optical signal wavelength and visibility range. It is observed that the lowest allowable signal attenuation verified with the highest visibility range under the same operating conditions and different fog density level weather. ii) Figs. (8-10) have indicated that the allowable signal
transmission increases for increasing of both operating optical signal wavelength and visibility range. It is observed that the highest allowable signal transmission verified with the highest visibility range under the same operating conditions and different fog density level weather.
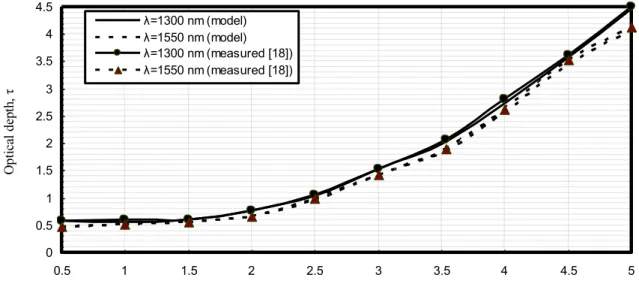
iii) Figs. (11-13) have assured that allowable optical depth increases for increasing of optical path length and decreasing of operating optical signal wavelength for different visibility range. It is observed that the lowest allowable optical depth verified with the highest visibility range and the lowest optical path length under
Tx
2θFOV
Optical path length, L
Rx Under water wireless medium
2825
ISSN: 2278 – 7798 All Rights Reserved © 2014 IJSETR
the same operating conditions and different fog density level weather.
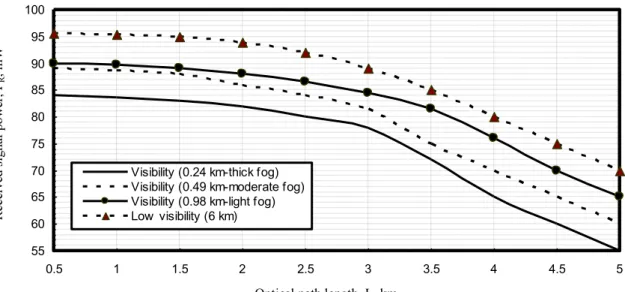
iv) Figs. (14-16) have assured that received signal power, link margin, and transmission data rates decrease with increasing optical path length for different visibility ranges. It is observed that with low visibility has presented the highest received signal power, link margin, and transmission data rates in comparison with other visibilities depend on different fog density levels. v) Figs. (17-19) have indicated that signal propagation
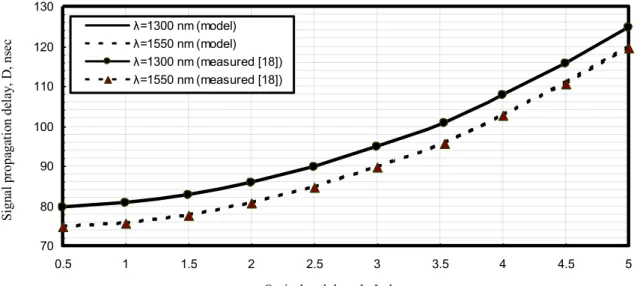
delay increases with increasing optical path length and decreasing operating optical signal wavelength. It is observed that with low visibility has presented the lowest signal propagation delay in comparison with other visibilities depend on different fog density levels. vi) As shown in Figs. (20, 21) have indicated that signal
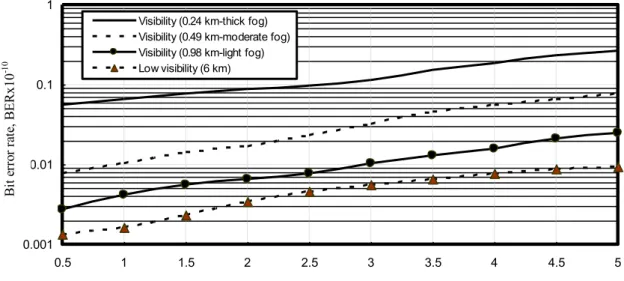
transmission quality decreases and bit error rate increases with increasing optical path length and decreasing operating optical signal wavelength. It is observed that with low visibility has presented the highest signal transmission quality and the lowest bit error rate in
comparison with other visibilities depend on different fog density levels.
III. 2. SUBMARINE WIRELESS OPTICS COMMUNICATIONS
Also in the same way, based on the modeling equations analysis and the assumed set of the operating system parameters as shown in Table 2, the following facts are assured as shown in the series of Figs. (22-30):
i) Figs. (22-24) have demonstrated that for submarine wireless communication systems in wireless medium, the increased of both water depth and optical path length, leads to the decreased received signal power.
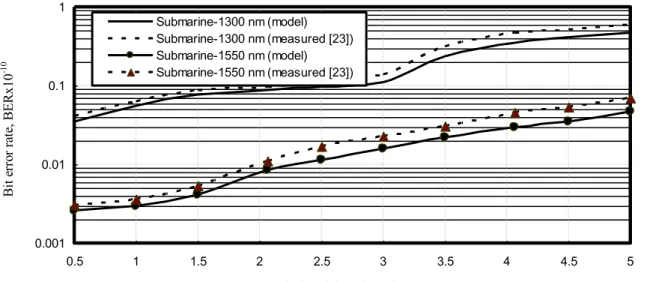
ii) Figs. (25-30) have indicated that that for submarine wireless communication systems in wireless medium, the increased of both actual water depth and optical path length, leads to the decreased signal to noise ratio and the increased bit error rate. It is also observed that the recommend operation at third optical transmission spectrum region with λ=1550 nm to give the best signal to noise ratio and the lowest bit error rate.
3.5 3.72 3.94 4.16 4.38 4.6 4.82 5.04 0.07 0.085 0.1 0.115 0.13 0.145 0.16 0.175 0.19 0.205 0.22 0.235 0.25 λ=1300 nm (model) λ=1550 nm (model) λ=1300 nm (measured [12]) λ=1550 nm (measured [12])
Visibility with thick fog, VThick, km
Fig. 2. Specific atmospheric signal attenuation in relation to visibility with thick fog, optical path length L=5 km and operating optical signal wavelengths at the assumed set of the operating parameters.
A tm os phe ri c at te nu at ion , α , dB /k m
2826
2.5 2.7 2.9 3.1 3.3 3.5 3.7 3.9 0.25 0.275 0.3 0.325 0.35 0.375 0.4 0.425 0.45 0.475 0.5 λ=1300 nm (model) λ=1550 nm (model) λ=1300 nm (measured [12]) λ=1550 nm (measured [12])Visibility with moderate fog, VModerate, km
Fig. 3. Specific atmospheric signal attenuation in relation to visibility with moderate fog, optical path length L=5 km and operating optical signal wavelengths at the assumed set of the operating parameters.
1.5 1.7 1.9 2.1 2.3 2.5 2.7 2.9 3.1 0.5 0.55 0.6 0.65 0.7 0.75 0.8 0.85 0.9 0.95 1 λ=1300 nm (model) λ=1550 nm (model) λ=1300 nm (measured [12]) λ=1550 nm (measured [12])
Visibility with light fog, VLight, km
Fig. 4. Specific atmospheric signal attenuation in relation to visibility with light fog, optical path length L=5 km and operating optical signal wavelengths at the assumed set of the operating parameters.
10.4 10.6 10.8 11 11.2 11.4 11.6 11.8 12 12.2 0.07 0.085 0.1 0.115 0.13 0.145 0.16 0.175 0.19 0.205 0.22 0.235 0.25 advection fog (λ=1550 nm-model)
radiation fog (λ=1550 nm-model)
advection fog (λ=1550 nm-measured [14]) radiation fog (λ=1550 nm-measured [14])
Visibility with thick fog, VThick, km
Fig. 5. Specific attenuation in relation to visibility with thick fog, optical path length L=5 km and operating optical signal wave lengths at the assumed set of the operating parameters.
A tm os phe ri c at te nu at ion , α , dB /k m A tm os phe ri c at te nu at ion , α , dB /k m Spe ci fi c at te nu at ion , γ , dB /k m
2827
ISSN: 2278 – 7798 All Rights Reserved © 2014 IJSETR
9.5 9.7 9.9 10.1 10.3 10.5 10.7 10.9 11.1 0.25 0.275 0.3 0.325 0.35 0.375 0.4 0.425 0.45 0.475 0.5
advection fog (λ=1550 nm-model) radiation fog (λ=1550 nm-model)
advection fog (λ=1550 nm-measured [14]) radiation fog (λ=1550 nm-measured [14])
Visibility with moderate fog, VModerate, km
Fig. 6. Specific attenuation in relation to visibility with moderate fog, optical path length L=5 km and operating optical signal wavelengths at the assumed set of the operating parameters.
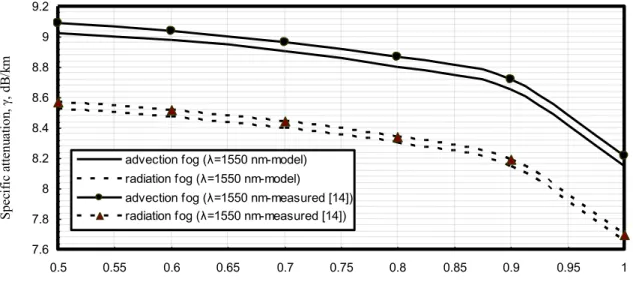
7.6 7.8 8 8.2 8.4 8.6 8.8 9 9.2 0.5 0.55 0.6 0.65 0.7 0.75 0.8 0.85 0.9 0.95 1
advection fog (λ=1550 nm-model) radiation fog (λ=1550 nm-model)
advection fog (λ=1550 nm-measured [14]) radiation fog (λ=1550 nm-measured [14])
Visibility with light fog, VLight, km
Fig. 7. Specific attenuation in relation to visibility with light fog, optical path length L=5 km and operating optical signal wave lengths at the assumed set of the operating parameters.
0.27 0.29 0.31 0.33 0.35 0.37 0.39 0.07 0.09 0.11 0.13 0.15 0.17 0.19 0.21 0.23 0.25 λ=1300 nm (model) λ=1550 nm (model) λ=1300 nm (measured [12]) λ=1550 nm (measured [12])
Visibility with thick fog, VThick, km
Fig. 8. Signal transmission in relation to visibility with thick fog, optical path length L=5 km and operating optical signal wavel engths at the assumed set of the operating parameters.
Spe ci fi c at te nu at ion , γ , dB /k m Spe ci fi c at te nu at ion , γ , dB /k m Si gn al tr ans m is si on , T
2828
0.325 0.35 0.375 0.4 0.425 0.45 0.475 0.25 0.275 0.3 0.325 0.35 0.375 0.4 0.425 0.45 0.475 0.5 λ=1300 nm (model) λ=1550 nm (model) λ=1300 nm (measured [12]) λ=1550 nm (measured [12])Visibility with moderate fog, VModerate, km
Fig. 9. Signal transmission in relation to visibility with moderate fog, optical path length L=5 km and operating optical signal wavelengths at the assumed set of the operating parameters.
0.4 0.44 0.48 0.52 0.56 0.6 0.64 0.68 0.5 0.55 0.6 0.65 0.7 0.75 0.8 0.85 0.9 0.95 1 λ=1300 nm (model) λ=1550 nm (model) λ=1300 nm (measured [12]) λ=1550 nm (measured [12])
Visibility with light fog, VLight, km
Fig. 10. Signal transmission in relation to visibility with light fog, optical path length L=5 km and operating optical signal wavel engths at the assumed set of the operating parameters.
0 0.5 1 1.5 2 2.5 3 3.5 4 4.5 0.5 1 1.5 2 2.5 3 3.5 4 4.5 5 λ=1300 nm (model) λ=1550 nm (model) λ=1300 nm (measured [18]) λ=1550 nm (measured [18])
Optical path length, L, km
Fig. 11. Optical depth in relation to optical path length, visibility with thick fog (VThick=0.24 km), and operating optical signal wavelengths
at the assumed set of the operating parameters.
Si gn al tr ans m is si on , T Si gn al tr ans m is si on , T O pt ic al de pt h, τ
2829
ISSN: 2278 – 7798 All Rights Reserved © 2014 IJSETR
0 0.5 1 1.5 2 2.5 3 0.5 1 1.5 2 2.5 3 3.5 4 4.5 5 λ=1300 nm (model) λ=1550 nm (model) λ=1300 nm (measured [18]) λ=1550 nm (measured [18])
Optical path length, L, km
Fig. 12. Optical depth in relation to optical path length, visibility with moderate fog (VModerate=0.49 km), and operating optical signal
wavelengths at the assumed set of the operating parameters.
0.25 0.5 0.75 1 1.25 1.5 1.75 2 2.25 2.5 0.5 1 1.5 2 2.5 3 3.5 4 4.5 5 λ=1300 nm (model) λ=1550 nm (model) λ=1300 nm (measured [18]) λ=1550 nm (measured [18])
Optical path length, L, km
Fig. 13. Optical depth in relation to optical path length, visibility with light fog (VLight=0.98 km), and operating optical signal wavelengths
at the assumed set of the operating parameters.
55 60 65 70 75 80 85 90 95 100 0.5 1 1.5 2 2.5 3 3.5 4 4.5 5
Visibility (0.24 km-thick fog) Visibility (0.49 km-moderate fog) Visibility (0.98 km-light fog) Low visibility (6 km)
Optical path length, L, km
Fig. 14. Variations of Received signal power against variations of optical path length and different visibilities with operating optical signal wavelength λ=1550 nm at the assumed set of the operating parameters.
O pt ic al de pt h, τ O pt ic al de pt h, τ R ec ei ve d si gna l p ow er , PR , m W
2830
25 30 35 40 45 50 0.5 1 1.5 2 2.5 3 3.5 4 4.5 5Visibility (0.24 km-thick fog) Visibility (0.49 km-moderate fog) Visibility (0.98 km-light fog) Low visibility (6 km)
Optical path length, L, km
Fig. 15. Variations of link margin against variations of optical path length and different visibilities with operating optical signa l wavelength λ=1550 nm at the assumed set of the operating parameters.
30 40 50 60 70 80 90 100 110 120 0.5 1 1.5 2 2.5 3 3.5 4 4.5 5
Visibility (0.24 km-thick fog) Visibility (0.49 km-moderate fog) Visibility (0.98 km-light fog) Low visibility (6 km)
Optical path length, L, km
Fig. 16. Variations of transmission data rate against variations of optical path length and different visibilities with operating optical signal wavelength λ=1550 nm at the assumed set of the operating parameters.
70 80 90 100 110 120 130 0.5 1 1.5 2 2.5 3 3.5 4 4.5 5 λ=1300 nm (model) λ=1550 nm (model) λ=1300 nm (measured [18]) λ=1550 nm (measured [18])
Optical path length, L, km
Fig. 17. Signal delay in relation to optical path length, visibility with thick fog (VThick=0.24 km), and operating optical signal wavelengths
at the assumed set of the operating parameters.
L ink m ar gi n, L M , m W D at e ra te , R , G bi t/ se c Si gn al p ropa ga ti on de la y, D , ns ec
2831
ISSN: 2278 – 7798 All Rights Reserved © 2014 IJSETR
55 65 75 85 95 105 115 0.5 1 1.5 2 2.5 3 3.5 4 4.5 5 λ=1300 nm (model) λ=1550 nm (model) λ=1300 nm (measured [18]) λ=1550 nm (measured [18])
Optical path length, L, km
Fig. 18. Signal delay in relation to optical path length, visibility with moderate fog (VModerate=0.49 km), and operating optical signal
wavelengths at the assumed set of the operating parameters.
35 40 45 50 55 60 65 70 75 80 85 90 0.5 1 1.5 2 2.5 3 3.5 4 4.5 5 λ=1300 nm (model) λ=1550 nm (model) λ=1300 nm (measured [18]) λ=1550 nm (measured [18])
Optical path length, L, km
Fig. 19. Signal delay in relation to optical path length, visibility with light fog (VLight=0.98 km), and operating optical signal wavelengths
at the assumed set of the operating parameters.
1.5 3 4.5 6 7.5 9 10.5 12 0.5 1 1.5 2 2.5 3 3.5 4 4.5 5
Visibility (0.24 km-thick fog) Visibility (0.49 km-moderate fog) Visibility (0.98 km-light fog) Low visibility (6 km)
Optical path length, L, km
Fig. 20. Variations of signal transmission quality against variations of optical path length and different visibilities with operati ng optical signal wavelength λ=1550 nm at the assumed set of the operating parameters.
Si gn al p ropa ga ti on de la y, D , ns ec Si gn al p ropa ga ti on de la y, D , ns ec Si gn al tr ans m is si on qu al ity, Q , dB
2832
0.001 0.01 0.1 1 0.5 1 1.5 2 2.5 3 3.5 4 4.5 5Visibility (0.24 km-thick fog) Visibility (0.49 km-moderate fog) Visibility (0.98 km-light fog) Low visibility (6 km)
Optical path length, L, km
Fig. 21. Variations of bit error rate against variations of optical path length and different visibilities with operating optical si gnal wavelength λ=1550 nm at the assumed set of the operating parameters.
45 50 55 60 65 70 75 80 85 90 95 100 0.5 1 1.5 2 2.5 3 3.5 4 4.5 5 Submarine-1300 nm (model) Submarine-1300 nm (measured [23]) Submarine-1550 nm (model) Submarine-1550 nm (measured [23])
Optical path length, L, km
Fig. 22. Variations of received signal power against variations of optical path length and different operating optical signal wavele ngths through the surface of the water (D=0 km) at the assumed set of the operating parameters.
40 45 50 55 60 65 70 75 80 85 90 0.5 1 1.5 2 2.5 3 3.5 4 4.5 5 Submarine-1300 nm (model) Submarine-1300 nm (measured [23]) Submarine-1550 nm (model) Submarine-1550 nm (measured [23])
Optical path length, L, km
Fig. 23. Variations of received signal power against variations of optical path length and different operating optical signal wavele ngths through the actual water depth (D=5 km) at the assumed set of the operating parameters.
B it er ro r ra te , B E R x10 -10 R ec ei ve d si gna l p ow er , PR , m W R ec ei ve d si gna l p ow er , P R , m W
2833
ISSN: 2278 – 7798 All Rights Reserved © 2014 IJSETR
35 40 45 50 55 60 65 70 75 80 85 90 0.5 1 1.5 2 2.5 3 3.5 4 4.5 5 Submarine-1300 nm (model) Submarine-1300 nm (measured [23]) Submarine-1550 nm (model) Submarine-1550 nm (measured [23])
Optical path length, L, km
Fig. 24. Variations of received signal power against variations of optical path length and different operating optical signal wavele ngths through the actual water depth (D=10 km) at the assumed set of the operating parameters.
1 2 3 4 5 6 7 8 9 10 0.5 1 1.5 2 2.5 3 3.5 4 4.5 5 Submarine-1300 nm (model) Submarine-1300 nm (measured [23]) Submarine-1550 nm (model) Submarine-1550 nm (measured [23])
Optical path length, L, km
Fig. 25. Variations of signal to noise ratio against variations of optical path length and different operating optical signal wavele ngths through the surface of the water (D=0 km) at the assumed set of the operating parameters.
0.001 0.01 0.1 1 0.5 1 1.5 2 2.5 3 3.5 4 4.5 5 Submarine-1300 nm (model) Submarine-1300 nm (measured [23]) Submarine-1550 nm (model) Submarine-1550 nm (measured [23])
Optical path length, L, km
Fig. 26. Variations of bit error rate against variations of optical path length and different operating optical signal wavelengths through the surface of the water (D=0 km) at the assumed set of the operating parameters.
Si gn al to noi se r at io , S N R , dB B it er ro r ra te , B E R x10 -10 R ec ei ve d si gna l p ow er , PR , m W
2834
0 1 2 3 4 5 6 7 8 0.5 1 1.5 2 2.5 3 3.5 4 4.5 5 Submarine-1300 nm (model) Submarine-1300 nm (measured [23]) Submarine-1550 nm (model) Submarine-1550 nm (measured [23])Optical path length, L, km
Fig. 27. Variations of signal to noise ratio against variations of optical path length and different operating optical signal wavelengths through the actual depth of the water (D=5 km) at the assumed set of the operating parameters.
0.001 0.01 0.1 1 0.5 1 1.5 2 2.5 3 3.5 4 4.5 5 Submarine-1300 nm (model) Submarine-1300 nm (measured [23]) Submarine-1550 nm (model) Submarine-1550 nm (measured [23])
Optical path length, L, km
Fig. 28. Variations of bit error rate against variations of optical path length and different operating optical signal wavelengths through the actual depth of the water (D=5 km) at the assumed set of the operating parameter.
0 1 2 3 4 5 6 0.5 1 1.5 2 2.5 3 3.5 4 4.5 5 Submarine-1300 nm (model) Submarine-1300 nm (measured [23]) Submarine-1550 nm (model) Submarine-1550 nm (measured [23])
Optical path length, L, km
Fig. 29. Variations of signal to noise ratio against variations of optical path length and different operating optical signal wavelengths through the actual depth of the water (D=10 km) at the assumed set of the operating parameters.
Si gn al to noi se r at io , S N R , dB B it er ro r ra te , B E R x10 -10 Si gn al to noi se r at io , S N R , dB
2835
ISSN: 2278 – 7798 All Rights Reserved © 2014 IJSETR
0.01 0.1 1 0.5 1 1.5 2 2.5 3 3.5 4 4.5 5 Submarine-1300 nm (model) Submarine-1300 nm (measured [23]) Submarine-1550 nm (model) Submarine-1550 nm (measured [23])
Optical path length, L, km
Fig. 30. Variations of bit error rate against variations of optical path length and different operating optical signal wavelengths t hrough the actual depth of the water (D=10 km) at the assumed set of the operating parameters.
IV. CONCLUSIONS
In a Summary, we have investigated the deep analytical study of free space and under water optical wireless communication systems performance parameters estimation over wider range of the affecting parameters. It is observed that the dramatic effects of fog density levels, and optical path length on the received signal power, ,ink margin, transmission data rates, signal transmission quality or signal to noise ratio, and finally bit error rates. It is recommended for transmission at operating optical signal wavelength with λ=1550 nm near infrared transmission spectrum region to overcome the allowable signal attenuation and signal scattering. While in submarine wireless transmission medium for transmitting near the surface to overcome signal attenuation under water sea. It is theoretically found that the dramatic effects of water depth on the underwater optical wireless communication systems that upgrade bit error rate and degrade signal to noise ratio and received signal power. Thus the selection of best operating optical signal wavelength for transmission and optical path length results in the increased optical free space and underwater wireless communication systems transmission performance efficiency.
REFERENCES
[1] Abd El-Naser A. Mohammed, Mohamed M. E. El-Halawany, Ahmed Nabih Zaki Rashed, and Mohammed S. F. Tabour ―High Transmission Performance of Radio over Fiber Systems over Traditional Optical Fiber Communication Systems Using Different Coding Formats for Long Haul Applications,‖ Nonlinear Optics and Quantum Optics, Vol. 44, No. 1, pp. 41–63, 2012.
[2] H. Manor and S. Arnon, ―Performance of an Optical Wireless Communication System As A function of Wavelength,‖ Applied Optics , Vol. 42, No. 21, pp. 4285–4294, July 2003. [3] C. C. Davis, I. I. Smolyaninov and S. D. Milner, ―Flexible
Optical Wireless Links and Networks‖, IEEE Communication Magazine, Vol. 3, No. 2, pp. 51-57, Mar. 2003.
[4] Abd El-Naser A. Mohammed, Ahmed Nabih Zaki Rashed, and Mohammed S. F. Tabour ―Transmission Characteristics of Radio over Fiber (ROF) Millimeter Wave Systems in Local Area Optical Communication Networks,‖ International Journal of Advanced Networks and Applications, Vol. 2, No. 6, pp. 876-886, May/June 2011.
[5] J. C. Juarez, A. Dwivedi, A. R. Hammons, S. D. Jones, V. Weerackody and R. A. Nichols, ―Free Space Optical Communications for Next Generation Military Networks‖,
IEEE Communication Magazine, Vol. 2, No. 1, pp. 46-51, November 2006.
[6] D. Giggenbach, J. Horwath and B. Epple, ―Optical Satellite Downlinks to Optical Ground Stations and High-Altitude Platforms,‖ IST Mobile & Wireless Communication Summit, Budapest, Hungary, July 2007.
[7] M. Aliba, K. Oawa, and S. Ito, ―Measurement and Simulation of the Effect of Snow Fall on Free Space Optical Propagation,‖ Applied Optics, Vol. 47, No. 31, pp. 5736-5743, 2008.
[8] H. Hemmati, ―Deep Space Optical Communications‖, John Wiley & Sons, 2006.
[9] A. K. Majumdar and J. C. Ricklin, ―Free Space Laser Communications, Principles and advantages‖, Springer Science 2008.
[10] Z. Kolkai, V. Biolkova, and D. Biolek, ―Model of Atmospheric Optical Channel with Scattering,‖ Latest Trends on Communications, vol. 5, no. 4, pp. 141-144, 2004. [11] M. S. Awan, L. C. Horwath, S. S. Muhammad, E. Leitgeb, F. Nadeem, M. S. Khan, ―Characterization of Fog and Snow Attenuations for Free-Space Optical Propagation,‖ Journal of Communications, Vol. 4, No. 8, pp. 533-445, Sep. 2009. [12] U. Ketprom, S. Jaruwatanadilok, Y. Kuga, A. Ishimaru, and J.
A. Ritcey, ―Channel modeling for optical wireless communication through dense fog,‖ Journal of Optical Networking, Vol. 4, No. 6, pp. 291-299, June 2005.
[13] Mazin Ali A. Ali, ―Charactriazn of Fog Attenuation for Free Space Optical Communication Link,‖ International Journal of Electronics and Communication Engineering &Technology, Vol. 4, No. 3, pp. 244-255, 2013.
[14] M. Aharonovich and S. Arnon, ―Performance improvement of optical wireless communication through fog with a decision feedback equalizer,‖ J. Opt. Soc. Am. A/Vol. 22, No. 8, pp. 1646-1654, Aug. 2005
[15] E. Ferdinandov, and T. Mitsev, ―Link Range of Free Space Laser Communication System,‖ Microwave Review Journal, Vol. 9, No. 2, pp. 41-42, Dec. 2003.
[16] S. Arnon,and D. Kedar, ―Non Line of Sight Underwater Optical Wireless Communication Network,‖ J. Opt. Soc. Am. A, Vol. 26, No. 3, pp. 530-539, March 2009.
[17] N. Ehrich Leonard, D. A. Paley, F. Lekien, R. Sepulchre, D. M. Fratantoni, and E. Russ, ―Collective motion, sensor networks, and ocean sampling,‖ Proc. IEEE 95, 48–74, 2007. [18] J. Heidemann, W. Ye, J. Wills, A. Syed, and Y. Li, ―Research challenges and applications for free space and underwater sensor networking,‖ in Proceedings of IEEE Wireless Communications and Networking Conference, WCNC (IEEE, 2006) pp. 228–235. B it er ro r ra te , B E R x10 -10
2836
[19] C. Detweiller, I. Vasilescu, and D. Rus, ―An underwater sensor network with dual communications, sensing and mobility,‖ in Proceedings of IEEE Oceans Conference 2007— Europe (IEEE, 2007).
[20] I. Vasilescu, K. Kotay, D. Rus, P. Corke, and M. Dunbabin, ―Data collection, storage and retrieval with an underwater sensor network,‖ in Proceedings of the 3rd International Conference on Embedded Networked Sensor Systems, (ACM, 2005), pp. 154–165.
[21] F. Hanson and S. Radic, ―High bandwidth underwater optical communication,‖ Appl. Opt., Vol. 47, No. 2, pp. 277–283, 2008.
[22] J. H. Smart, ―Underwater Optical Communication systems Part 1: variability of water optical parameters,‖ in Proceedings of IEEE Military Communications Conference, MILCOM (IEEE, 2005).
[23] P.Vijaya Kumar, S.S.K.Praneeth, Romarsha.B.Narender, ―Analysis of Optical Wireless Communication for Underwater Wireless Communication ,‖ International Journal of Scientific & Engineering Research, Vol. 2, No. 6, pp. 1-9, June-2011 [24] X. Quan and E. S. Fry, ―Empirical equation for the index of
refraction of seawater,‖ Appl. Opt., Vol. 34, No. 5, pp. 3477– 3480, 1995.
[25] Milica Stojanovic ―Wireless underwater communication system and networks: current achievements and future research challenges‖ 1994.
[26] B. Cochenour, L. Mullen, and A. Laux, ―Spatial and temporal dispersion in high bandwidth underwater laser communication links,‖ in Proc. IEEE Military Communications Conf., pp. 1– 7, 2008.
[27] J. H. Smart, ―Underwater optical communication systems part 1: variability of water optical parameters,‖ in Proc. IEEE Military Communications Conf., pp. 1140–1146, 2005. [28] J. W. Giles and I. N. Bankman, ―Underwater optical
communications systems part 2: basic design considerations,‖ in Proc. IEEE Military Communications Conf., pp. 1140– 1146, 2005.
[29] S. Jaruwatanadilok, ―Underwater wireless optical communication channel modeling and performance evaluation using vector radiative Transfer theory,‖ IEEE J. Sel. Areas Commun., Vol. 26, No. 9, pp. 1620–1627, 2008.
Author’s Profile
Dr. Ahmed Nabih Zaki Rashed was born in
Menouf city, Menoufia State, Egypt country in 23 July, 1976. Received the B.Sc., M.Sc., and Ph.D. scientific degrees in the Electronics and Electrical Communications Engineering Department from Faculty of Electronic Engineering, Menoufia University in 1999, 2005, and 2010 respectively. Currently, his job carrier is a scientific lecturer in Electronics and Electrical Communications Engineering Department, Faculty of Electronic Engineering, Menoufia university, Menouf. Postal Menouf city code: 32951, EGYPT.
His scientific master science thesis has focused on polymer fibers in optical access communication systems. Moreover his scientific Ph. D. thesis has focused on recent applications in linear or nonlinear passive or active in optical networks. His interesting research mainly focuses on transmission capacity, a data rate product and long transmission distances of passive and active optical communication networks, wireless communication, radio over fiber communication systems, and optical network security and management. He has published many high scientific research papers in high quality and technical international journals in the field of advanced communication systems, optoelectronic devices, and passive optical access communication networks. His areas of interest and experience in optical communication systems,
advanced optical communication networks, wireless optical access networks, analog communication systems, optical filters and Sensors, digital communication systems, optoelectronics devices, and advanced material science, network management systems, multimedia data base, network security, encryption and optical access computing systems. As well as he is editorial board member in high academic scientific International research Journals. Moreover he is a reviewer member and editorial board member in high impact scientific research international journals in the field of electronics, electrical communication systems, optoelectronics, information technology and advanced optical communication systems and networks. His personal electronic mail ID (E-mail:[email protected]). His published paper under the title "High reliability optical interconnections for short range
applications in high speed optical communication systems" has
achieved most popular download articles in Optics and Laser Technology Journal, Elsevier Publisher in year 2013
![Table 1: List of operating parameters used in the simulation for free space optics system [1, 5, 9, 12]](https://thumb-us.123doks.com/thumbv2/123dok_us/8223351.2180151/4.892.447.832.440.765/table-list-operating-parameters-used-simulation-space-optics.webp)