1
Pupils educated other than at school, 2014/15
This annual Statistical First Release reports on the number of pupils receiving education outside of school funded by Welsh local authorities and the number of pupils receiving elective home education in Wales. The information relates to the number of pupils receiving these forms of education during a census week in January for the academic years 2010/11 to 2014/15. During the 2014/15 academic year the census week was 12th to 16th January 2015.
Key Results
Chart 1: Rate of EOTAS pupils whose main education is other than at school
2.2 2.2 2.6 2.6
3.0 0.0 0.5 1.0 1.5 2.0 2.5 3.0 3.5
2011 2012 2013 2014 2015
R at e p e r 1, 00 0 p u p ils
In 2014/15
The rate of EOTAS pupils receiving their main education other than at school increased in 2014/15.
Statistician: Stephen Hughes Tel: 029 2082 3599 E-mail: [email protected]
Next update: July 2016 (provisional)
Twitter: www.twitter.com/statisticswales | www.twitter.com/ystadegaucymru
SDR 112/2015 29 July 2015
EOTAS pupils are pupils who receive
education outside of school funded by Welsh local authorities.
2,157 the number of EOTAS pupils.
1,387
the number of EOTAS pupilsreceiving their main education other than at school (Table 1).
3.0
out of 1,000 pupils in Walesreceived their main education other than at school (Table 2).
Flintshire had the
highest rate of pupils whose main education is other than at school (Table 2).7 out of 10 pupils
whose main education is other than at school wereboys (Table 3).
Pupil referral units
were the most popular form of EOTAS education (Table 7).592 the number of pupils who
were registered at a single pupil referral unit (Table 8).2
Contents
PageChart 1 Rate of EOTAS pupils whose main education is other than at school 1
Local authority analysis of EOTAS pupils
Table 1 Number of pupils educated other than at school, by local authority, 2014/15 4 Table 2 Pupils whose main education is other than at school, by local authority,
2010/11-2014/15 6
EOTAS pupils whose main education is other than at school, by pupil characteristics
Table 3 Pupils whose main education is other than at school, by age and gender,2010/11-2014/15
7 Table 4 Pupils whose main education is other than at school, by Special Educational Need
(SEN) provision, 2010/11-2014/15 8
Table 5 Pupils whose main education is other than at school, by free school meal (FSM)
entitlement, 2010/11-2014/15 8
Table 6 Pupils whose main education is other than at school, by ethnic background, 2010/11-2014/15
9
Educational provisions given to EOTAS pupils
Table 7 Pupils whose main education is other than at school, by educational provision,
2014/15 10
Chart 2 Number of pupil enrolments, by educational provision, 2014/15 11 Chart 3 Percentage of pupil enrolments, by educational provision, 2010/11-2014/15 11
Number of pupils attending pupil referral units
Table 8 Number of pupils attending Pupil Referral Units in Wales, by age, 2014/15 13 Table 9 Number of pupils attending Pupil Referral Units in Wales, by local authority,
2014/15 14
Pupils electively educated at home
Table 10 Number of pupils of compulsory school age electively educated at home, by local
authority, 2010/11-2014/15 15
Additional information
3
Introduction
Chart 1 shows how the rate of EOTAS pupils whose main education is other than at school has changed over the years.
Table 1 shows a breakdown of the number of EOTAS pupils in each local authority by enrolment status in PLASC for the 2014/15 academic year.
Tables 2 and 3 show the number of EOTAS pupils whose main education is other than at school by local authority, gender and age for academic years 2010/11 to 2014/15 and show the rate per 1,000 pupils of these data, giving a more reliable measure of differences between groups of pupils.
Tables 4 to 6 break down the number and percentage of pupils whose main education is other than at school by special educational need, free school meal entitlement and ethnic background.
Table 7 shows the types of education being provided for pupils whose main education is other than at school. Chart 2 ranks these data by the number of enrolments and Chart 3 shows how the percentage of enrolments at different educational provisions have changed over the years.
Tables 8 and 9 display the number of pupils who are registered at a single pupil referral unit or who are dual registered at a pupil referral unit by age, gender and local authority.
4
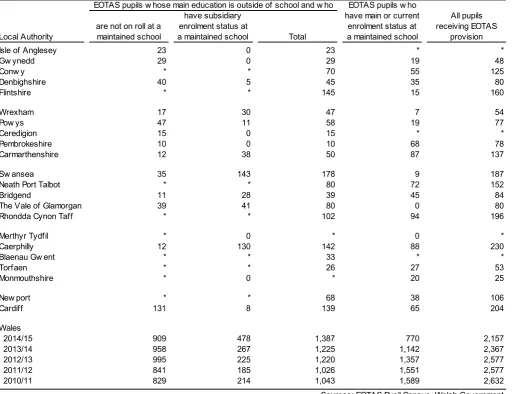
Table 1: Number of pupils educated other than at school, by local authority, 2014/15
EOTAS pupils w hose main education is outside of school and w ho EOTAS pupils w ho
have subsidiary have main or current All pupils
are not on roll at a enrolment status at enrolment status at receiving EOTAS
Local Authority maintained school a maintained school Total a maintained school provision
Isle of Anglesey 23 0 23 * *
Gw ynedd 29 0 29 19 48
Conw y * * 70 55 125
Denbighshire 40 5 45 35 80
Flintshire * * 145 15 160
Wrexham 17 30 47 7 54
Pow ys 47 11 58 19 77
Ceredigion 15 0 15 * *
Pembrokeshire 10 0 10 68 78
Carmarthenshire 12 38 50 87 137
Sw ansea 35 143 178 9 187
Neath Port Talbot * * 80 72 152
Bridgend 11 28 39 45 84
The Vale of Glamorgan 39 41 80 0 80
Rhondda Cynon Taff * * 102 94 196
Merthyr Tydfil * 0 * 0 *
Caerphilly 12 130 142 88 230
Blaenau Gw ent * * 33 * *
Torfaen * * 26 27 53
Monmouthshire * 0 * 20 25
New port * * 68 38 106
Cardiff 131 8 139 65 204
Wales
2014/15 909 478 1,387 770 2,157
2013/14 958 267 1,225 1,142 2,367
2012/13 995 225 1,220 1,357 2,577
2011/12 841 185 1,026 1,551 2,577
2010/11 829 214 1,043 1,589 2,632
Sources: EOTAS Pupil Census, Welsh Government Pupil Level Annual School Census, Welsh Government
In 2014/15, 2,157 pupils were reported to be receiving education other than at school funded by their local authority during the census week (12th to 16th January 2015). In this statistical release such
pupils will be referred to as ‘EOTAS pupils’.
Not all EOTAS pupils receive their education solely outside of the maintained school environment. In fact, many of them are still on roll at maintained schools. Of the 2,157 EOTAS pupils,
909 pupils were not on roll at a maintained school in the January 2015 Pupil-Level Annual School Census (PLASC), so they only received education ‘other than at school’;
2,157
the number of EOTAS pupils.1,387
the number of EOTAS pupilsreceiving their main education other than at school.
64.3% the percentage of EOTAS
pupils receiving their main education other than at school.5
478 pupils had ‘subsidiary’ enrolment status in maintained schools in the January 2015 PLASC, meaning that their main education was ‘other than at school’; and;
770 pupils had ‘main’ or ‘current’ enrolment status in maintained schools in the January 2015 PLASC, which means that their main education was in a maintained school.
This breakdown can be seen in the following diagram. The circle on the left represents the EOTAS pupils who were on roll at a maintained school, while the circle on the right shows the EOTAS pupils whose main education was other than at school. The section where the circles overlap shows the number of EOTAS pupils whose main education was other than at school who had ‘subsidiary’ enrolment status in a maintained school.
Since pupils with ‘main’ or ‘current’ enrolment status in the January 2015 PLASC are included in the Schools’ Census publication, the main focus of this statistical release will be on the EOTAS pupils whose main education is other than at school – the pupils represented by the circle on the right. EOTAS pupils whowere also on roll at a maintained school.
EOTAS pupils whose main education was other than at school.
6
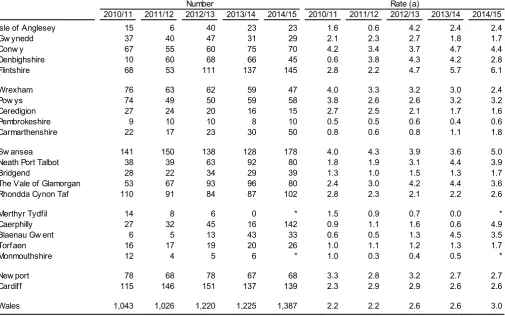
Table 2: Pupils whose main education is other than at school, by local authority,
2010/11-2014/15 (a)
Number Rate (a)
2010/11 2011/12 2012/13 2013/14 2014/15 2010/112010/11 2011/12 2012/13 2013/14 2014/15
Isle of Anglesey 15 6 40 23 23 1.6 0.6 4.2 2.4 2.4
Gw ynedd 37 40 47 31 29 2.1 2.3 2.7 1.8 1.7
Conw y 67 55 60 75 70 4.2 3.4 3.7 4.7 4.4
Denbighshire 10 60 68 66 45 0.6 3.8 4.3 4.2 2.8
Flintshire 68 53 111 137 145 2.8 2.2 4.7 5.7 6.1
Wrexham 76 63 62 59 47 4.0 3.3 3.2 3.0 2.4
Pow ys 74 49 50 59 58 3.8 2.6 2.6 3.2 3.2
Ceredigion 27 24 20 16 15 2.7 2.5 2.1 1.7 1.6
Pembrokeshire 9 10 10 8 10 0.5 0.5 0.6 0.4 0.6
Carmarthenshire 22 17 23 30 50 0.8 0.6 0.8 1.1 1.8
Sw ansea 141 150 138 128 178 4.0 4.3 3.9 3.6 5.0
Neath Port Talbot 38 39 63 92 80 1.8 1.9 3.1 4.4 3.9
Bridgend 28 22 34 29 39 1.3 1.0 1.5 1.3 1.7
The Vale of Glamorgan 53 67 93 96 80 2.4 3.0 4.2 4.4 3.6
Rhondda Cynon Taf 110 91 84 87 102 2.8 2.3 2.1 2.2 2.6
Merthyr Tydfil 14 8 6 0 * 1.5 0.9 0.7 0.0 *
Caerphilly 27 32 45 16 142 0.9 1.1 1.6 0.6 4.9
Blaenau Gw ent 6 5 13 43 33 0.6 0.5 1.3 4.5 3.5
Torfaen 16 17 19 20 26 1.0 1.1 1.2 1.3 1.7
Monmouthshire 12 4 5 6 * 1.0 0.3 0.4 0.5 *
New port 78 68 78 67 68 3.3 2.8 3.2 2.7 2.7
Cardiff 115 146 151 137 139 2.3 2.9 2.9 2.6 2.6
Wales 1,043 1,026 1,220 1,225 1,387 2.2 2.2 2.6 2.6 3.0
Sources: EOTAS Pupil Census, Welsh Government School Census, Welsh Government
(a) Rate per 1,000 pupils. Full- and part-time pupils in maintained nursery, primary, secondary and special schools and pupils w hose main education is other than at school as in the January School Census and EOTAS Pupil Census.
In 2014/15, 3.0 out of every 1,000 pupils in Wales received their main education other than at school. This value has increased over the past five years.
The rate of EOTAS pupils whose main education is other than at school is 0.7 percentage points higher than it was in 2010/11.
Flintshire had the highest rate of EOTAS pupils whose main education is other than at school in 2014/15 (6.1 per 1,000 pupils). This local authority has had the highest rate since 2012/13.
Caerphilly saw a large increase in the rate of EOTAS pupils whose main education is other than at school in 2014/15. Between 2010/11 and 2013/14 the rate had not risen above 1.6 out of 1,000 pupils. But in 2014/15 this value rose to 4.9 out of every 1,000 pupils receiving their main education other than at school.
3.0 out of every 1,000 pupils received their main
education other than at school.The rate of pupils whose main education is other than at school increased between 2013/14 and 2014/15.
Flintshire had the highest rate of pupils whose
main education is other than at school.
7
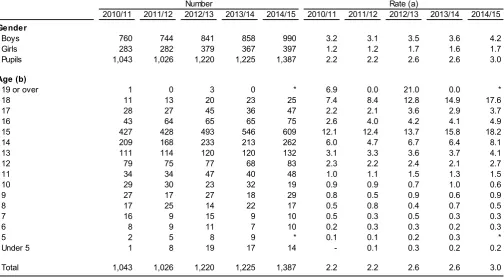
Table 3: Pupils whose main education is other than at school, by age and gender,
2010/11-2014/15 (a)
Number Rate (a)
2010/11 2011/12 2012/13 2013/14 2014/15 2010/11 2011/12 2012/13 2013/14 2014/15
Gender
Boys 760 744 841 858 990 3.2 3.1 3.5 3.6 4.2
Girls 283 282 379 367 397 1.2 1.2 1.7 1.6 1.7
Pupils 1,043 1,026 1,220 1,225 1,387 2.2 2.2 2.6 2.6 3.0
Age (b)
19 or over 1 0 3 0 * 6.9 0.0 21.0 0.0 *
18 11 13 20 23 25 7.4 8.4 12.8 14.9 17.6
17 28 27 45 36 47 2.2 2.1 3.6 2.9 3.7
16 43 64 65 65 75 2.6 4.0 4.2 4.1 4.9
15 427 428 493 546 609 12.1 12.4 13.7 15.8 18.2
14 209 168 233 213 262 6.0 4.7 6.7 6.4 8.1
13 111 114 120 120 132 3.1 3.3 3.6 3.7 4.1
12 79 75 77 68 83 2.3 2.2 2.4 2.1 2.7
11 34 34 47 40 48 1.0 1.1 1.5 1.3 1.5
10 29 30 23 32 19 0.9 0.9 0.7 1.0 0.6
9 27 17 27 18 29 0.8 0.5 0.9 0.6 0.9
8 17 25 14 22 17 0.5 0.8 0.4 0.7 0.5
7 16 9 15 9 10 0.5 0.3 0.5 0.3 0.3
6 8 9 11 7 10 0.2 0.3 0.3 0.2 0.3
5 2 5 8 9 * 0.1 0.1 0.2 0.3 *
Under 5 1 8 19 17 14 - 0.1 0.3 0.2 0.2
Total 1,043 1,026 1,220 1,225 1,387 2.2 2.2 2.6 2.6 3.0
Sources: EOTAS Pupil Census, Welsh Government School Census, Welsh Government
(a) Rate per 1,000 pupils. Full- and part-time pupils in maintained nursery, primary, secondary and special schools, independent schools and pupils w hose main education is other than at school as in the January School Census and EOTAS Pupil Census.
(b) Age as on 31 August at the start of the academic year.
Since 2010/11 there have been more boys whose main education is other than at school than girls and this continues to be the case in 2014/15. Around 7 out of 10 pupils whose main education is other than at school were boys.
The rate of boys whose main education is other than school has been increasing since 2011/12. The rate of girls, on the other hand, has risen and fallen between 2011/12 and 2014/15.
The age group with the most number of pupils receiving their main education other than at school was 15-year-olds. A little over 4 out of 10 EOTAS pupils whose main education is other than at school were aged 15.
The rate of pupils aged 11-15 whose main education is other than at school increases as the pupils’ ages increase. This trend can be seen in the ‘Rate’ section in Table 3. In 2014/15, 1.5 out of every 1,000 pupils aged 11 were receiving their main education other than at school and as pupils’ ages increase this rate also increases, to 18.2 out of every 1,000 pupils aged 15.
Pupils whose main education is other than at school:
7
out of 10
pupils were boys.Pupils aged 15 had the highest rate of EOTAS pupils.
8
Table 4: Pupils whose main education is other than at school, by special educational
need (SEN) provision, 2010/11-2014/15 (a)
Number of pupils Percentage of pupils (a)
SEN provision 2010/11 2011/12 2012/13 2013/14 2014/15 2010/11 2011/12 2012/13 2013/14 2014/15
Statement of SEN 374 365 443 424 463 35.9 35.6 36.3 34.6 33.4
School Action Plus 456 503 553 594 645 43.7 49.0 45.3 48.5 46.5
School Action 58 54 36 41 87 5.6 5.3 3.0 3.3 6.3
No SEN 155 104 188 166 192 14.9 10.1 15.4 13.6 13.8
Total 1,043 1,026 1,220 1,225 1,387 100.0 100.0 100.0 100.0 100.0
Sources: EOTAS Pupil Census, Welsh Government
(a) Percentage of pupils w hose main education is other than at school.
In 2014/15 the percentage of pupils whose main education is other than at school with special educational needs decreased very slightly. It dropped from 86.4 per cent in 2013/14 to 86.2 per cent in 2014/15. This percentage has fluctuated over the past five years. It reached its highest value of 89.9 per cent in 2011/12.
School Action Plus has been the most common SEN provision for EOTAS pupils whose main education is other than at school since 2010/11.
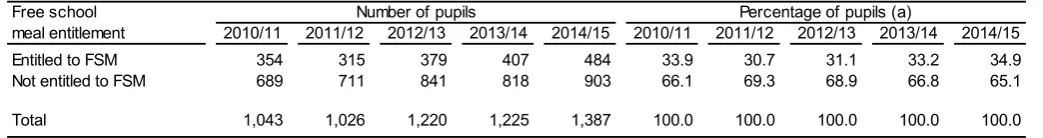
Table 5: Pupils whose main education is other than at school, by free school meal (FSM)
entitlement, 2010/11-2014/15 (a)
Free school Number of pupils Percentage of pupils (a)
meal entitlement 2010/11 2011/12 2012/13 2013/14 2014/15 2010/11 2011/12 2012/13 2013/14 2014/15
Entitled to FSM 354 315 379 407 484 33.9 30.7 31.1 33.2 34.9
Not entitled to FSM 689 711 841 818 903 66.1 69.3 68.9 66.8 65.1
Total 1,043 1,026 1,220 1,225 1,387 100.0 100.0 100.0 100.0 100.0
Sources: EOTAS Pupil Census, Welsh Government
(a) Percentage of pupils w hose main education is other than at school.
34.9 per cent (just over 1 out of 3) of pupils whose main education is other than at school were entitled to free school meals in 2014/15.
The percentage of pupils whose main education is other than at school who are entitled to free school meals dipped at 30.7 per cent in 2011/12 and has been rising since.
Pupils whose main education is other than at school:
1 out of 3 pupils are entitled to free school meals.
Key points
Pupils whose main education is other than at school:
86.2% Percentage of pupils with special educational
needs.Small decrease in the percentage of pupils with special educational needs since 2013/14.
[image:8.595.39.561.515.584.2]9
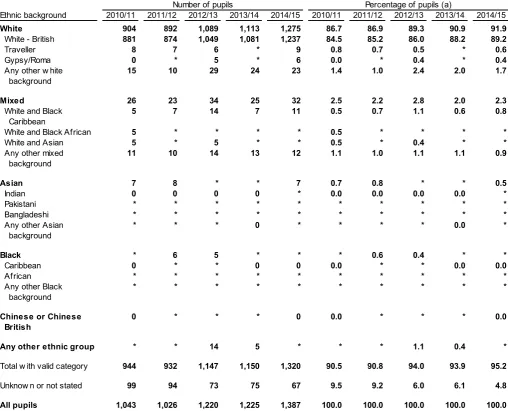
Table 6: Pupils whose main education is other than at school, by ethnic background,
2010/11-2014/15 (a)
Number of pupils Percentage of pupils (a)
Ethnic background 2010/11 2011/12 2012/13 2013/14 2014/15 2010/11 2011/12 2012/13 2013/14 2014/15
White 904 892 1,089 1,113 1,275 86.7 86.9 89.3 90.9 91.9
White - British 881 874 1,049 1,081 1,237 84.5 85.2 86.0 88.2 89.2
Traveller 8 7 6 * 9 0.8 0.7 0.5 * 0.6
Gypsy/Roma 0 * 5 * 6 0.0 * 0.4 * 0.4
Any other w hite 15 10 29 24 23 1.4 1.0 2.4 2.0 1.7
background
Mixed 26 23 34 25 32 2.5 2.2 2.8 2.0 2.3
White and Black 5 7 14 7 11 0.5 0.7 1.1 0.6 0.8
Caribbean
White and Black African 5 * * * * 0.5 * * * *
White and Asian 5 * 5 * * 0.5 * 0.4 * *
Any other mixed 11 10 14 13 12 1.1 1.0 1.1 1.1 0.9
background
Asian 7 8 * * 7 0.7 0.8 * * 0.5
Indian 0 0 0 0 * 0.0 0.0 0.0 0.0 *
Pakistani * * * * * * * * * *
Bangladeshi * * * * * * * * * *
Any other Asian * * * 0 * * * * 0.0 *
background
Black * 6 5 * * * 0.6 0.4 * *
Caribbean 0 * * 0 0 0.0 * * 0.0 0.0
African * * * * * * * * * *
Any other Black * * * * * * * * * *
background
Chinese or Chinese 0 * * * 0 0.0 * * * 0.0
British
Any other ethnic group * * 14 5 * * * 1.1 0.4 *
Total w ith valid category 944 932 1,147 1,150 1,320 90.5 90.8 94.0 93.9 95.2
Unknow n or not stated 99 94 73 75 67 9.5 9.2 6.0 6.1 4.8
All pupils 1,043 1,026 1,220 1,225 1,387 100.0 100.0 100.0 100.0 100.0
Sources: EOTAS Pupil Census, Welsh Government
10
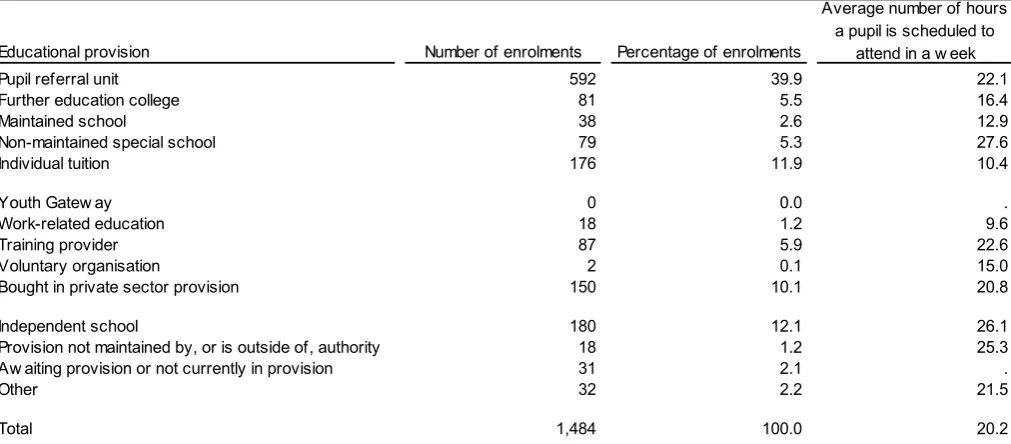
Table 7: Pupils whose main education is other than at school, by educational provision,
2014/15
Since pupils may attend more than one educational provision in a week, some pupils may be counted against more than one provision. That is why the number of enrolments is higher than the number of pupils whose main education is other than at school (1,387 pupils) in Table 1.
Educational provision Number of enrolments Percentage of enrolments
Pupil referral unit 592 39.9 22.1
Further education college 81 5.5 16.4
Maintained school 38 2.6 12.9
Non-maintained special school 79 5.3 27.6
Individual tuition 176 11.9 10.4
Youth Gatew ay 0 0.0 .
Work-related education 18 1.2 9.6
Training provider 87 5.9 22.6
Voluntary organisation 2 0.1 15.0
Bought in private sector provision 150 10.1 20.8
Independent school 180 12.1 26.1
Provision not maintained by, or is outside of, authority 18 1.2 25.3
Aw aiting provision or not currently in provision 31 2.1 .
Other 32 2.2 21.5
Total 1,484 100.0 20.2
Sources: EOTAS Pupil Census, Welsh Government Average number of hours
a pupil is scheduled to attend in a w eek
In 2014/15 there were 592 enrolments at pupil referral units, which accounted for 39.9 per cent of all EOTAS educational enrolments. Looking at Chart 2, you can see that pupil referral units were used much more frequently to educate EOTAS pupils than other provisions.
Independent schools were the next most popular educational provisions, accounting for 12.1 per cent of EOTAS educational enrolments.
Although the EOTAS data collection refers to pupils educated other than at school, in some circumstances EOTAS pupils are placed into a maintained school as part of their provision. 38 pupils received EOTAS education in a maintained school. On average, these pupils only received 12.9 hours of education each week at maintained schools. This is just over half of the standard school week of 25 hours.
The average number of hours of education provided to pupils whose main education is outside of school was 20.2 hours during the census week. Pupils enrolled at non-maintained special schools received the most number of hours of provision during the census week, with an average of 27.6 hours provided per pupil.
Pupils whose main education is other than at school:
39.9% Percentage of pupil enrolments at pupil
referral units.12.1%
Percentage of pupil enrolments at independent schools.31 Number of pupils not receiving educational
provision during the census week.11
Chart 2: Number of pupil enrolments, by educational provision, 2014/15
592 180 176 150 87 81 79 38 32 31 18 18 2 0
0 100 200 300 400 500 600
Pupil referral unit Independent school Individual tuition Bought in private sector provision Training provider Further education college Non-maintained special school Maintained school Other Awaiting provision or not currently in provision Work-related education Provision not maintained by, or is outside of, authority Voluntary organisation Youth Gateway
Number of pupil enrolments
[image:11.595.43.556.431.720.2]Chart 3: Percentage of pupil enrolments, by educational provision, 2010/11-2014/15
Table 7 shows the percentage of pupil enrolments at EOTAS provisions during the census week in 2014/15. Chart 3shows how the percentages of pupil enrolments have changed since 2010/11. All provisions have been plotted on this chart, but only the five most popular provisions in 2014/15 have been highlighted to make it easier to read.0 5 10 15 20 25 30 35 40 45 50
2010/11 2011/12 2012/13 2013/14 2014/15
P e rc e n ta g e o f p u pi l e nr ol m en ts a t E O T A S p ro vi s io n s
Pupil referral unit Independent school Individual tuition
Bought in private sector provision Training provider
Other provisions
12
The decrease in use of independent schools as EOTAS provisions in 2013/14 brought them level with individual tuition. In 2014/15, the use of independent schools increased slightly more than the use of individual tuition. This meant that independent schools are the second most popular education provision for EOTAS pupils again.
13
Table 8: Number of pupils attending pupil referral units in Wales, by age, 2014/15
Pupils w ho are registered at a single PRU (b) Pupils w ho are dually registered at a PRU (c)
Age (a) Boys Girls Pupil Boys Girls Pupil
19 or over 0 0 0 0 0 0
18 0 0 0 0 0 0
17 0 * * 0 0 0
16 * * * 0 0 0
15 164 92 256 37 20 57
14 86 46 132 57 24 81
13 60 10 70 40 13 53
12 * * 42 25 6 31
11 18 0 18 * * 19
10 * * 9 * * 28
9 17 0 17 * * 24
8 * * 8 16 0 16
7 * * 7 * * 23
6 8 0 8 * * 13
5 5 0 5 5 0 5
Under 5 * * 12 0 0 0
Total 430 162 592 273 77 350
Sources: EOTAS Pupil Census, Welsh Government Pupil Level Annual School Census, Welsh Government
(a) Age as on 31 August 2014.
(b) Figures relate to pupils educated at only one PRU and include pupils receiving other EOTAS provisions or being recorded as having ‘subsidiary’ enrolment status at a maintained or special school in the 2014/15 Pupil-Level Annual School Census (PLASC), but exclude those w ith ‘main’ or ‘current’ enrolment in a maintained or special school in PLASC.
(c) Figures relate to pupils educated at more than one PRU or educated at a PRU w hile having 'main' or 'current' enrolment status at a maintained or special school in the 2014/15 PLASC.
During the 2014/15 census week 592 EOTAS pupils were singly registered at a pupil referral unit (PRU). A little under three quarters of these pupils were boys.
In Table 3 it was seen that the rate of pupils aged 11-15 whose main education is other than at school increased as the pupils’ age increase. A similar trend can be seen in enrolments at pupil referral units. The number of pupils registered at PRUs increases with each age
group from age 11 up to age 15.
350 pupils were dually registered at a PRU during the 2014/15 census week. This means that they were either attending more than one PRU or were on roll at one PRU but receiving their main education in a maintained school.
EOTAS pupils registered at PRUs:
592
pupils were registered at a single PRU.350 pupils were dually registered at
a PRU.Key points
Around 13 out of every 30
14
Table 9: Number of pupils attending pupil referral units in Wales, by local authority,
2014/15
Pupils w ho are registered at a single PRU (b) Pupils w ho are dually registered at a PRU (c)
Local Authority (a) Boys Girls Pupil Boys Girls Pupil
Isle of Anglesey 11 5 16 0 * *
Gw ynedd * * 8 * * 6
Conw y 36 17 53 38 14 52
Denbighshire 7 13 20 29 6 35
Flintshire 72 42 114 * * 11
Wrexham 32 12 44 * * 7
Pow ys 11 9 20 * 0 *
Ceredigion * * 9 0 0 0
Pembrokeshire 0 0 0 40 10 50
Carmarthenshire 15 9 24 21 12 33
Sw ansea 65 21 86 * * 7
Neath Port Talbot 0 0 0 0 0 0
Bridgend 10 5 15 * * 12
The Vale of Glamorgan 38 11 49 0 0 0
Rhondda Cynon Taff * * 63 46 8 54
Merthyr Tydfil 0 0 0 0 0 0
Caerphilly * 0 * 19 0 19
Blaenau Gw ent * * 21 * 0 *
Torfaen * * 8 20 7 27
Monmouthshire * * * * * 10
New port * * 14 12 6 18
Cardiff 16 5 21 * * 6
Wales 430 162 592 273 77 350
Sources: EOTAS Pupil Census, Welsh Government Pupil Level Annual School Census, Welsh Government
(a) Refers to the local authority in w hich pupils attended PRUs, not the local authority funding the provision.
(b) Figures relate to pupils educated at only one PRU and include pupils receiving other EOTAS provisions or being recorded as having ‘subsidiary’ enrolment status at a maintained or special school in the 2014/15 Pupil-Level Annual School Census (PLASC), but exclude those w ith ‘main’ or ‘current’ enrolment in a maintained or special school in PLASC.
(c) Figures relate to pupils educated at more than one PRU or educated at a PRU w hile having 'main' or 'current' enrolment status at a maintained or special school in the 2014/15 PLASC.
Flintshire had the most number of pupils registered at a single pupil referral unit (114 pupils).
15
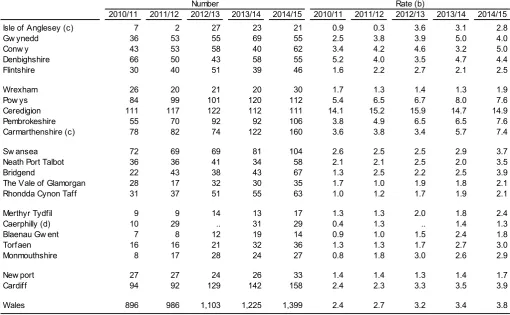
Table 10: Number of pupils of compulsory school age educated at home, by local
authority, 2010/11-2014/15 (a)
Number Rate (b)
2010/11 2011/12 2012/13 2013/14 2014/15 2010/11 2011/12 2012/13 2013/14 2014/15
Isle of Anglesey (c) 7 2 27 23 21 0.9 0.3 3.6 3.1 2.8
Gw ynedd 36 53 55 69 55 2.5 3.8 3.9 5.0 4.0
Conw y 43 53 58 40 62 3.4 4.2 4.6 3.2 5.0
Denbighshire 66 50 43 58 55 5.2 4.0 3.5 4.7 4.4
Flintshire 30 40 51 39 46 1.6 2.2 2.7 2.1 2.5
Wrexham 26 20 21 20 30 1.7 1.3 1.4 1.3 1.9
Pow ys 84 99 101 120 112 5.4 6.5 6.7 8.0 7.6
Ceredigion 111 117 122 112 111 14.1 15.2 15.9 14.7 14.9
Pembrokeshire 55 70 92 92 106 3.8 4.9 6.5 6.5 7.6
Carmarthenshire (c) 78 82 74 122 160 3.6 3.8 3.4 5.7 7.4
Sw ansea 72 69 69 81 104 2.6 2.5 2.5 2.9 3.7
Neath Port Talbot 36 36 41 34 58 2.1 2.1 2.5 2.0 3.5
Bridgend 22 43 38 43 67 1.3 2.5 2.2 2.5 3.9
The Vale of Glamorgan 28 17 32 30 35 1.7 1.0 1.9 1.8 2.1
Rhondda Cynon Taff 31 37 51 55 63 1.0 1.2 1.7 1.9 2.1
Merthyr Tydfil 9 9 14 13 17 1.3 1.3 2.0 1.8 2.4
Caerphilly (d) 10 29 .. 31 29 0.4 1.3 .. 1.4 1.3
Blaenau Gw ent 7 8 12 19 14 0.9 1.0 1.5 2.4 1.8
Torfaen 16 16 21 32 36 1.3 1.3 1.7 2.7 3.0
Monmouthshire 8 17 28 24 27 0.8 1.8 3.0 2.6 2.9
New port 27 27 24 26 33 1.4 1.4 1.3 1.4 1.7
Cardiff 94 92 129 142 158 2.4 2.3 3.3 3.5 3.9
Wales 896 986 1,103 1,225 1,399 2.4 2.7 3.2 3.4 3.8
Sources: EOTAS Pupil Census, Welsh Government
(a) Data relate to pupils aged 5 to 15 on 31 August before the start of the academic year. Where local authorities do not know a pupil's age they w ere asked to provide an estimate.
(b) Rate per 1,000 pupils aged 5-15 on 31 August before the start of the academic year. The denominator includes pupils w hose main education is other than at school, pupils w ho had 'main' or 'current' enrolment status in the January PLASC and pupils w ho are know n to be electively home educated.
(c) Isle of Anglesey did not provide the ages of elective home educated pupils for 2012/13 and Carmartheshire did not provide the ages of some pupils in 2013/14 so it is unknow n w hether their data include pupils outside of the 5-15 age range for this year. It w as not mandatory to provide such information.
(d) Caerphilly w as not able to supply data for electively home educated pupils in 2012/13. All 22 local authorities provided data in other years.
In the 2014/15 academic year 1,399 children were known to be electively home educated in Wales. This means that the parents of these pupils decided to educate their children at home instead of sending them to school.
The rate of elective home educated pupils continues to rise. In 2010/11 2.4 out of 1,000 pupils were electively home educated, but by 2014/15 this value had increased to 3.8 out of 1,000 pupils.
Caerphilly had the lowest rate of electively home educated children (1.3 per 1,000 pupils) while Ceredigion had the highest rate (14.9 per 1,000 pupils). Ceredigion has had the highest rate of electively home educated children since 2010/11.
Electively home educated pupils:
1,399 pupils were electively home educated.
Ceredigion had the highest rate of elective home
educated pupils.
16
17
18
Notes
1 Context
1.1 Policy/Operational
Local authorities are required to provide suitable education at school or otherwise than at school for those children of compulsory school age who, by reason of illness, exclusion from school or otherwise, may not for any period receive suitable education unless such arrangements are made for them. In practice, local authorities respond to that duty in widely varying ways, relating to their individual circumstances, such as their geography, socio-economic situation and educational policies. The
recommendations for Welsh Government in Edinburgh University’s Evaluation of education provision for
children and young people educated outside the school setting are being used to inform policy development
around exclusions and EOTAS. The report also contained 10 recommendations for local authorities. The report can be found here: http://wales.gov.uk/statistics-and-research/education-provision-children-young-people-educated-outside-school-setting/?lang=en.
1.2 Related Publications
England publishes the number of pupils on roll at Pupil Referral Units in the statistical release entitled ‘Schools, Pupils and their Characteristics, January 2013’. The latest available statistics can be found here: https://www.gov.uk/government/publications/schools-pupils-and-their-characteristics-january-2014.
2 Data Source
The EOTAS Pupil Census is carried out annually and collects data on pupils educated other than at school from local authorities electronically via a secure website. The collection is carried out by the school statistics team in Knowledge and Analytical Services within the Welsh Government.
3 Definitions
3.1 Coverage
The information in this Statistical First Release relates to pupils receiving local authority-funded education outside of the mainstream school environment during a census week each January and the number of pupils of compulsory school age (aged 5 to 15 on 31 August before the start of the academic year) known by local authorities to be electively home educated. For the 2014/15 academic year the census week was 12 to 16 January 2015.
In 2014/15 data were received on 2,157 pupils receiving education other than at school from all 22 local authorities in Wales. Of the 2,157 pupils receiving EOTAS provision 770 were recorded in the January 2015 Pupil-Level Annual School Census as having ‘main’ or ‘current’ enrolment status in maintained primary, secondary or special schools and were therefore considered to be receiving their main education in a maintained school. The remaining 1,387 pupils were considered to be receiving their main education other than at school. The focus of this Statistical First Release is on pupils mainly educated other than at school, but to give a complete picture it was necessary to include all pupils receiving EOTAS provision in Tables 1, 8 and 9.
Local authorities reported that in 2014/15 1,461 pupils were known to be electively home educated. Of these pupils 62 were known to not be of compulsory school age so they were excluded from the figures contained in this release, leaving a total of 1,399 pupils.
19
not. In 2012/13 Caerphilly did not provide any information regarding electively home educated pupils. It is not mandatory for local authorities to provide this information.
3.2 Definitions of Pupils Educated Other than at School
In the context of this statistical release: a pupil being educated other than at school (EOTAS) was recorded as receiving or awaiting education provision funded by the local authority otherwise than in a maintained school setting during the census week of the EOTAS Pupil Census. A pupil may also be included in this category if:
they attend an independent or non-maintained special school for which the local authority is responsible for paying all or part of the tuition fees;
they are placed in a maintained school as part of their education funded by the local authority.
the phrase EOTAS pupil is used to refer to a pupil educated other than at school as defined above.
an EOTAS pupil whose main education is other than at school is a pupil being educated other than at school who is either not on roll at a maintained school or is recorded as having a ‘subsidiary’ enrolment status at a maintained school in the January Pupil-Level Annual School Census.
an EOTAS pupil whose main education is in a maintained school is a pupil being educated other than at school with a ‘main’ or ‘current’ enrolment status in the January Pupil-Level Annual School Census.
pupils being electively home educated are children whose parents have decided to educate at home rather than at school and are not classed as EOTAS pupils. Although by definition they are educated other than at school, education for these pupils is not funded by the local authority and there is no legal basis under which the local authority can collect personal data about them. Data on electively home educated pupils are restricted to headcounts by local authority and are provided voluntarily by the local authority. Figures related to pupils electively home educated have been reported in separate tables to those relating to EOTAS pupils.
3.3 Free school meal (FSM) eligibility
Children whose parents receive the following support payments are eligible to receive free school meals in maintained schools in Wales:
Income Support.
Income Based Jobseekers Allowance Support under Part VI of the Immigration and Asylum Act 1999.
Income-related Employment and Support Allowance.
Child Tax Credit, provided they are not entitled to Working Tax Credit and their annual income does not exceed £16,190.
Guarantee element of State Pension Credit.
Working Tax Credit ‘run-on’- the payment someone may receive for a further four weeks after they stop qualifying for Working Tax Credit.
Universal Credit.
20
Pupils should only be recorded as eligible if they have applied for free school meals to the local authority and (1) the relevant authority has confirmed their eligibility, or (2) final confirmation of eligibility is still awaited but the school has seen documents that strongly indicate eligibility.
3.4 Special educational needs (SEN)
Pupils known to have special educational needs can be in one of the following categories:
School Action: When a class or subject teacher identifies that a pupil has special educational
needs they provide interventions that are additional to, or different from, those provided as part of the school’s usual curriculum.
School Action Plus: When the class or subject teacher and the SEN Co-ordinator are provided
with advice or support from outside specialists, so that alternative interventions additional to, or different from, those provided for the pupil through ‘School Action’ can be put in place.
Statement: Pupils for whom the local authority maintains a statement of special educational
needs under Part IV of the Education Act 1996. A statement may be issued by the local authority after assessment of a child’s needs.
4 Rounding and Symbols
In tables where figures have been rounded to the nearest final digit, there may be an apparent discrepancy between the sum of the constituent items and the total shown.
The following symbols have been used throughout this publication: . data item is not applicable.
.. data item is not available.
- data item is not zero, but would be rounded to zero because less than half the final digit is shown.
* data item is disclosive.
5 Key Quality Information
This section provides a summary of information on this output against five dimensions of quality: Relevance, Accuracy, Timeliness and Punctuality, Accessibility and Clarity, and Comparability.
5.1 Relevance
The statistics are used both within and outside the Welsh Government to monitor educational trends and as a baseline for further analysis of the underlying data. Some of the key users are:
Ministers and the Members Research Service in the National Assembly for Wales;
other government departments;
local authorities and schools;
Estyn, Her Majesty’s Inspectorate of Education and Training in Wales;
The Department for Education and Skills in the Welsh Government;
other areas of the Welsh Government;
the research community;
students, academics and universities;
individual citizens, private companies and the media.
These statistics are used in a variety of ways. Some examples of these are:
21
to inform the education policy decision-making process in Wales;
to inform Estyn during school inspections;
to assist in research in educational attainment.
5.2 Accuracy
The Welsh Government works closely with local authorities in order to ensure all data are validated before tables are published. Data are collated into an electronic return and submitted to the Welsh Government through DEWi, a secure online data transfer system developed by the Welsh Government. Various stages of automated validation and sense-checking are built into the process to ensure a high quality of data.
Starting in 2011/12, following the collection of the data an additional validation period was carried out in which local authorities were sent summary tables of their data and asked to check that they were correct. While most of the data were confirmed to be correct, these checking periods highlighted
problems with several local authorities’ data which were resolved, further improving the accuracy of the data.
5.3 Timeliness and Punctuality
DEWi was available for uploading files on 19 January 2015, with local authorities asked to submit data for all pupils receiving or awaiting local authority-funded education outside of the maintained school environment during the census week of 12 to 16 January 2015. Local authorities were then asked to validate their data within the validation period, which closed on 29 May 2015.
5.4 Accessibility and Clarity
This Statistical First Release is pre-announced and then published on the Statistics section of the Welsh Government’s website.
5.5 Comparability
Tables 8 and 9 contain the number of pupils only on roll at Pupil Referral Units (PRUs) in Wales by gender, age and local authority, which in previous years have been published in the Welsh
Government’s publication entitled ‘Schools in Wales: General Statistics.’ Prior to 2009/10 the figures for this table were collected directly from PRUs via the STATS1 form. Tables 8 and 9 are now based upon data from the EOTAS Pupil Census and the January Pupil-Level Annual School Census. Because of the change in methodology used, the number of pupils that would have been reported as only being on roll at a PRU in the STATS1 form may differ slightly from those that have been produced for this statistical first release.
In the 2009/10 edition of this release Table 4 presented the number of pupils only registered at a PRU (which included pupils registered at more than one PRU) and the number of pupils registered at a PRU and other educational institutions. To meet with user demand, this table (now Table 8) was changed in the 2010/11 edition to present the number of pupils only registered at a single PRU and the number of pupils dual registered at more than one PRU or at a PRU and another maintained school. The new definitions have also been used in Table 9 and match the definitions previously used when presenting the number of pupils attending PRUs. Since Table 4 in the 2009/10 release and the same table in subsequent releases have different definitions for single and dual registered pupils it is not
recommended that they be compared. Comparable data are available from the school statistics team within the Welsh Government on request.
Tables and charts in this statistical first release contain data about different groups of EOTAS pupils as defined in section 3.2. Whether the tables and charts are referring to EOTAS pupils whose main
22
clearly indicated, so before comparing two tables or charts please check that they are referring to the same group of EOTAS pupils.
Pupils by age (Table 3) and by SEN (Table 4) can be set in context by comparing to the general school population. The relevant data can be found in the publication of final school census results here: http://gov.wales/statistics-and-research/?topic=Education+and+skills.