Rochester Institute of Technology
RIT Scholar Works
Theses Thesis/Dissertation Collections
5-3-2013
Extreme Weather
Jeff Turof
Follow this and additional works at:http://scholarworks.rit.edu/theses
This Thesis is brought to you for free and open access by the Thesis/Dissertation Collections at RIT Scholar Works. It has been accepted for inclusion in Theses by an authorized administrator of RIT Scholar Works. For more information, please [email protected].
Recommended Citation
Thesis Documentation for
the Master of Fine Arts Degree
Rochester Institute of Technology College of Imaging Arts and Sciences School of Design
MFA Computer Graphics Design
Jeff Turof
Thesis Documentation
Rochester Institute of Technology College of Imaging Arts and Sciences School of Design
MFA Computer Graphics Design
Jeff Turof
Table of Contents
Abstract
4
Introduction
4
Design Process
5
3d Design
9
Audio
14
Research
14
Course Flow
16
Topic Overview
17
User Feedback
19
Programming
20
Conclusion
36
Thesis Proposal
38
Thesis Documentation
Rochester Institute of Technology College of Imaging Arts and Sciences School of Design
MFA Computer Graphics Design
Jeff Turof
Thesis Committee Approval:
Chief Advisor:
Associate Professor Daniel DeLuna, Computer Graphics Design
Signature of Chief Advisor Date
Associate Advisor:
Associate Professor Chris Jackson, Computer Graphics Design
Signature of Associate Advisor Date
Associate Advisor:
Assistant Professor Shaun Foster, Computer Graphics Design
Signature of Associate Advisor Date
Thesis Documentation
Rochester Institute of Technology College of Imaging Arts and Sciences School of Design
MFA Computer Graphics Design
Thesis Documentation
Rochester Institute of Technology College of Imaging Arts and Sciences School of Design
MFA Computer Graphics Design
Jeff Turof
Abstract
Introduction
Extreme Weather is an instructional website that pro-vides a solution for people who have an interest in the weather to learn more about the topic of extreme weather. Extreme Weather events covered include Su-percell Thunderstorms, Downbursts, Lake Effect Snow and Hurricanes. Each topic includes multiple pages of information presented through various methods includ-ing animated diagrams, photography with callouts and a variety of interactive exercises, all supported by an audio narrative.
The field of meteorology consists of an immense amount of information, but very little of that information is given in an engaging, easy-to-use or understandable format.
It’s my passion for the weather and storms that drew me to the idea of creating a learning resource about extreme weather. To me, there’s nothing like watching storm clouds building, seeing lake effect cloud bands over the lake and wondering if it will drift over my area or not. The idea of not only teaching myself more about these concepts but others as well was exciting; but how would I achieve this? Being part of an e-learning team professionally, the answer was obvious to me on the method of delivery. Using a dynamic interactive tem-plate coupled with two and three-dimensional scenes combined with photography seemed the best method to visually hold the learner’s attention. By being able to interact with each phenomena and visually seeing how different aspects of the weather interact with each other, a more rounded learning experience can be pro-vided.
To my knowledge, this type of tool has not been creat-ed in the way I intend to present it. Currently, the most common method of presentation is that of a website that provides many links to textual pages that explain the topic the links refer to. Some also add simple graphics or even hand drawn sketches to support the
Thesis Documentation
Rochester Institute of Technology College of Imaging Arts and Sciences School of Design
MFA Computer Graphics Design
Thesis Documentation
Rochester Institute of Technology College of Imaging Arts and Sciences School of Design
MFA Computer Graphics Design
Jeff Turof
Thesis Documentation
Rochester Institute of Technology College of Imaging Arts and Sciences School of Design
MFA Computer Graphics Design
Jeff Turof
Design Process
In creating this project a number of considerations had to be addressed and planned out including overall flow, navigation, page design, graphics, and user interaction.
Logo design began the process and deciding a color scheme that related to the overall topic. The original thought was a logo
that looked torn and tattered as though it had been through
one of the weather events being discussed so two grunge-style fonts were used.
Colors were determined based on common colors throughout. Being mainly gray tones, brighter support colors were chosen for callouts and animated demonstrative graphics.
Page layout went through multiple iterations with the requirement being that page real estate was used effectively. Typical e-learning courses vary
Thesis Documentation
Rochester Institute of Technology College of Imaging Arts and Sciences School of Design
MFA Computer Graphics Design
Jeff Turof
user testing, it was found to be too busy of a page, leaving the user confused as to where to look and what the central focus was.
The logo as well was found to have poor readability and was simplified with the page design to the current design as we see it today (Figure 4). The user interface became a simple box holding support text for the page
[image:7.612.229.578.96.284.2]Thesis Documentation
Rochester Institute of Technology College of Imaging Arts and Sciences School of Design
MFA Computer Graphics Design
Jeff Turof
Additionally a credits link can be found on the bottom of the page where users can find source information for content found in the training. Photography credits can also be found here for all images used internally. Future plans include a link which would take the user to the image the link represents.
As mentioned previously, demonstrative graphics are used throughout the web site. This is something I found severely
lack-ing in all of the re-sources I found online (Figure 5). Nowhere can one find websites that demonstrate concepts of airflow in any way besides a rough sketch or writ-ten description. These graphics generally show aspects such as airflow, wind
direction, warm and
cold air movement, moisture,
evaporation and more. Arrows are the common meth-od of showing airflow (Figure 6) and movement with the use of blue arrows to show cold-related subject matter and orange-ish red arrows to show warm-related subject matter. One spot utilizes a green color as well to indicate the bending of flow updraft. A gold
color is used throughout to indicate airflow in general as well as wind direction or force.
Additional to the graph-ics, interactive elements are used throughout to allow the user some form of participa-tion within the site. This is achieved in several different ways. The first interactive
ele-Figure 5
Thesis Documentation
Rochester Institute of Technology College of Imaging Arts and Sciences School of Design
MFA Computer Graphics Design
Jeff Turof
ment is called a Click and Stick in the e-learning indus-try. This consists of an element the user will click on which results in an interaction of some kind which gen-erally results in text, a graphic or an animation demon-strating or explaining something. For consistency, my click and stick elements are all laid out with three but-tons containing
photography and a roll-over state within the left text display that the user clicks on (Fig-ure 7). Once clicked, a larger instance of the photograph
in the button is shown to the right within a container of sorts with a text-based explanation of that subject above it. Click and Stick interactive can be found within the Supercell and Downburst topics.
Another inter-active element used is a drag and drop exer-cise (Figure 8), also found in the Supercell topic. In this tool, the user is given a choice of 6 words with-in the left text
box. A photograph of a supercell storm encompasses the page background and the user is instructed to drag a word from the text box to the correct area of the pho-tograph. Target areas are represented by semi-trans-parent circles on screen. If the user has paid attention throughout the topic, they will have no problems placing the word in the correct location on the image.
Figure 7
Thesis Documentation
Rochester Institute of Technology College of Imaging Arts and Sciences School of Design
MFA Computer Graphics Design
Jeff Turof
When words are placed properly, their respective circles disap-pear and when completed, the user receives feedback stat-ing he or she did a good job
and to click the Next Button to advance to continue on.
Finally a third interactive element, again found in the Supercell topic, provides a user-controlled feature where the users are presented with a three-dimen-sional model that they can rotate around and zoom in on (Figure 9). Sliders are located below it with indica-tors of which action they represent. Rotation takes the user’s view from the top-left of the model across the front and center to the lower-right position of it. Along this rotation can be found the semi-transparent circle targets that when rolled-over, display a box with more information on that specific area of the storm. As the image is rotated, the circle targets move along with the rotation staying in their correct locations. As some tar-gets move out of range, other circles associated with other targets move into view. The zoom feature switch-es views of the storm to a more distant view which the user then has the ability to zoom in for a close-up view of the wall cloud and gust front region.
Figure 9
Another huge part of this project was the need for 3d support and originally, 3d was going to be the main staple of the project with weather simulations and user-controlled activities throughout.
The main tool used to build the simulations was Au-todesk Maya, specifically Maya’s 3d fluid toolset. Flu-ids in Maya consist of a cube shaped container that is set to a specific size and resolution. It can be set
Thesis Documentation
Rochester Institute of Technology College of Imaging Arts and Sciences School of Design
MFA Computer Graphics Design
Jeff Turof
to static where the contents will simply appear in the scene or dynamic, which enables the option to animate the content generated or allow the fluid to continue evolving or growing. The main types of fluids I used was in the form of clouds and mist but two simulations contained a water simulation as well in the form of a large body of water.
Beginning this project, I had very little knowledge of how 3d fluids worked or what they were capable of---or limited to. My biggest undertaking was that of creating a 3-dimensional version of a supercell thunderstorm. The original intention was to capture the intricacies of the storm, including the updraft, inflow and outflow and mesocyclone rotation. 3d fluids are really impres-sive, but to develop something of this magnitude it became obvious that fluids have a large set of limita-tions. The biggest limitation was not the tool itself but the necessary power to generate the simulations I intended to create and it took an enormous amount of time and effort for me to make this realization. 3d flu-ids have the ability to be shaped and molded but this ability is in no way similar to how a 3d mesh can be shaped and molded.
Thesis Documentation
Rochester Institute of Technology College of Imaging Arts and Sciences School of Design
MFA Computer Graphics Design
Jeff Turof
surpassed anything I had access to and prohibited me from even producing simple rotational simulations. In order for a convincing supercell to be produced, a minimum of 20 3d fluid containers would have been needed, each containing a hi-resolution, expression-driven fluid with a minimum of 2 fields simultaneously manipulating it to achieve a believable result. Recent motion pictures depict supercell storms and are driven by several-core, multi-graphic board enabled systems driven by 100+node render farms. These requirements eclipsed the capabilities I did have at my disposal; a 3-node render farm and a 4-core system with a good amount of memory and one decent, but still inad-equate video card. My lack of programming skills also limited my ability to develop something believable. Us-ing expressions and python, it may have been possible for me to enhance the supplied toolset and give them additional capabilities as well as to allow multiple tools to work with each other instead of separately.
A third method of working with fluids never worked properly for me; working with particles and emit fluids. This is a method that would have allowed me much more control over the flow of the fluids but was a tech-nique I could not master. Ultimately, with time working against me, my quest to include a 3d fluid generated supercell storm that the user could navigate around had to be abandoned and was replaced with a cheap substitute consisting of a supercell-shaped polygonal object that was shaded using a cloud-like texture. This texture did not have the same effect as a true fluid-based texture and overall was very disappointing visu-ally. The function of the interactive worked fairly well however and achieved some of the impressiveness of the original idea.
Thesis Documentation
Rochester Institute of Technology College of Imaging Arts and Sciences School of Design
MFA Computer Graphics Design
Jeff Turof
the playblast solution. To create the protrusion, fluid was generated from an boomerang-shaped hidden ob-ject along the x-axis. An influence obob-ject in the shape of an oblong sphere was used along the lower front re-gion of the fluid to deflect it, with help from a uniform field and air field, which pushes the fluid in two oppo-site directions; one out and one down at specific loca-tions. Using the fluid’s own Shading attributes, color-ing of the fluid was provided, which sets a darker color on the bottom of the fluid and brighter colors toward the top. A gust front is usually a very ominous looking structure on any storm, so to build on that aspect, the fluid’s incandescence attribute was also implemented to provide darker, more saturated tones throughout the cloud structure. As with most of the cloud structures I built, texture was provided from the Opacity and Color values with a Perlin Noise texture type set on a grid.
Another feature I was able to simulate was a down-burst. The main cloud banks were created using two large static 3d fluid containers to create alternating altitude clouds of varying light and dark colorations. Texture types varied between the Perlin and Billow op-tions and to achieve the “puffy” appearance. Through the center a third fluid container was placed in the shape of a tall column. Inside the column, a cylindrical influence object was placed just below the fluid emit-ter. A timeline was used to animate the fluid genera-tion starting with a very slow, gradual emission, then quickly rising to a deluge of particles being shot down-ward in high concentration. The influence object acted as a funnel blowing out the fluid onto the ground plane which was set as a collision object. On impact, the fluid blew out in all directions in a circular pattern, identical to how a true downburst hits the ground.
Thesis Documentation
Rochester Institute of Technology College of Imaging Arts and Sciences School of Design
MFA Computer Graphics Design
Jeff Turof
Other features were achieved as well, but not used due to the inability to properly blend the effects together in a believable fashion. Mammatus clouds were gen-erated by inverting a 3d fluid container which had its initial state set around 150 frames into a simulation. It’s dynamic values were set to static to avoid any further simulation. A cloud bank was created with a spheri-cal drop-off to simulate the anvil of the storm and the mammatus clouds were placed under this area. Again though, the way 3d fluids within Maya work, the final piece did not appear to be bulging out of the clouds as intended, but placed in a fixed spot, looking like odd shapes on the bottom of the cloud bank.
Other areas 3d fluids were used was in the simula-tion found within the Lake Effect Snow topic. Liquid simulation was used to create a large body of water. A large 3d container was placed just over the water with a NURBs object emitting a vapor upward. An air field was created blowing the fluid away from the land form and another blowing it back the other way with an influence object creating a bubble for the fluid to travel around. When the fluid reached the right point, a Newton field was used to push the fluid downward a little before it disappeared at the top of the container. Another 3d container was then placed in the sky to simulate clouds. The 3d fluid preset, Cloud Bank, was implemented, animating its Opacity, Color Tex Gain, and Threshold values to appear as if the clouds were thickening over time. Simultaneously, the 3d container was animated slowly across the sky toward the land form object, giving the appearance of vapor rising off of the water, condensing into clouds, and moving over the land as true lake effect snow works.
Thesis Documentation
Rochester Institute of Technology College of Imaging Arts and Sciences School of Design
MFA Computer Graphics Design
Jeff Turof
Effects during post-production.
Another Lake Effect simulation was also created which showed how lake effect show occurs in a burst drop-ping snow all at once in specific areas. First, a 3d container, set to Cloud bank and animated to appear as thickening clouds, was created. For this sequence, the Density value of the clouds was also animated to enhance the appearance of the clouds thickening. This sequence was rendered and a second sequence was then built, showing the landform geometry, which appears to have snow accumulating on it. This was accomplished through the use of a layered shader, which consists of a Crater texture and a granite texture. Granite was placed over Crater in the hierarchy and its transparency was adjusted to allow only a little detail of the grain through, leaving mainly the color applied to the crater to be visibly dominant. The Shaker value and the three color channels in the crater texture was then animated to give the appearance of the ground being covered by snow, by slowly changing the values to mainly white. Both sequences were next composited in After Effects, where particles were created to simu-late the actual snow burst. The particle storm’s values were synchronized with the rate that the color in the crater texture was animating, which gives the appear-ance of falling, accumulating snow.
Thesis Documentation
Rochester Institute of Technology College of Imaging Arts and Sciences School of Design
MFA Computer Graphics Design
Jeff Turof
Thesis Documentation
Rochester Institute of Technology College of Imaging Arts and Sciences School of Design
MFA Computer Graphics Design
Jeff Turof
Research
Research was an enormous part of this project and took weeks for each subject. The supercell subject required the most effort and involved contacting dozens of peo-ple in the meteorology field including storm chasers and weather forecasters to try and learn more about the individual phenomena but also to obtain permis-sions to use their content or photography. Additional to the photography, numerous storm chasers and experts in the topic were contacted. Many, although interested, did not wish to be a part of the project. Some, however, were willing to discuss the photography I was referring to and answer some questions. Probably most notably among these sources was Reed Timmer, from the Dis-covery Channel show Storm Chasers. Reed spoke lo-cally at the Rochester Museum and Science Center and besides the wealth of information he gave during his discussion, I was able to ask him more direct questions afterward about supercell rotation, growth and suste-nance and movement. This information helped greatly with not only writing the content on Supercell storms, but also in making the realization that 3d fluids would not be able to accomplish the tasks I needed them to do.
Audio
Thesis Documentation
Rochester Institute of Technology College of Imaging Arts and Sciences School of Design
MFA Computer Graphics Design
Jeff Turof
Numerous websites were also examined for informa-tion on this project. Several stood out however from the breadth of information they offered.
The first was The Ultimate Weather Education Website from Jeff Haby. Haby’s site, as mentioned in the above literature review, contained information on all of my
topics and allowed me to gather a good deal of information in a one-stop shop sort of method. His links also provided me with links to other sites that gave me even more information.
The second was a site called
Weather-World2010, again mentioned previously, that contains an amazing smart navigation sys-tem where the user clicks on a topic in the left navigation pane and anything relevant shows up on an increasingly detailed menu. For each selection, the user is presented with a new set of topics and page results. An example of how it works is one might start by selecting Online Guides. This then pres-ents the user with 5 subjects. Upon clicking one of those subjects, for example, Meteo-rology, the user is then presented with 11 choices. Clicking on another, Severe Storms, presents the user with 6 more choices. The process continues providing the user with many options and a wealth of information. This site was a great source of basic and complex definitions as well as multiple dia-grams illustrating many concepts I needed for my background information.
Thesis Documentation
Rochester Institute of Technology College of Imaging Arts and Sciences School of Design
MFA Computer Graphics Design
Jeff Turof
As seen in the flow chart below, navigation in the course will be very simple. The user can navigate to any of the topics at any time with no limit to the num-ber of times he/she could visit. Within each topic the user will click the next or back buttons to move within that topic and will have the option to replay the current page if desired. Future plans for the website include a photo gallery and possibly a jump page to videos for each topic to see examples of these phenomena.
Introduction
Supercell
Thunder-storm
Lake Effect
Snow
Downbursts
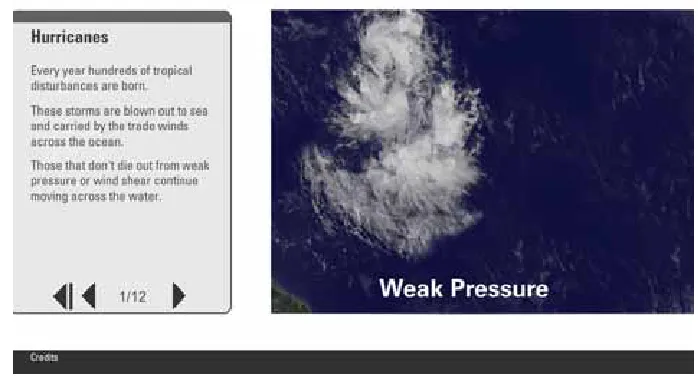
Hurricane
Definition/
Factors
Definition/
Factors
Definition/
Factors
Definition/
Factors
User-Controlled
Interactive
Drag & Drop
Simulation
Simulation
Simulation
Simulation
Credits/
Sources
Thesis Documentation
Rochester Institute of Technology College of Imaging Arts and Sciences School of Design
MFA Computer Graphics Design
Jeff Turof
Four topics were chosen to concentrate on for this project. Supercell Thunderstorms, Downbursts, Lake Effect Snow and Hurricanes. All of these topics have similar characteristics toward their formation but each have very unique characteristics that hold particular interest.
Supercell thunderstorms are awe-inspiring events with their bands of swirling eddies, their layers on layers of air-torn turbulence and majestic towering clouds. Mainly found in the central US plains and extreme southern states, supercells are essentially thunder-storms that feed off of the extreme heat and moisture commonly found in these areas during the spring, summer and autumn months. As with regular thunder-storms, they contain an updraft and a downdraft but unlike their close cousins, these storms can live for an extraordinary amount of time, feeding off of the hear and moisture in the air and building and re-building their structures. The only ways to kill a supercell storm are to disrupt the updraft or to take away their source of heat and moisture. Once established they could last for hours and with the correct conditions, could pro-duce our second topic, Downbursts.
A downburst is a possible by-product of any thunder-storm, with the right conditions. With these events, as more and more moisture evaporates and falls, it produces a cool downdraft. It’s when this moisture is evaporating faster than it can be absorbed by the storm that the cloud releases it in a ‘burst’ of precipita-tion and wind that can produce condiprecipita-tions similar to that of a tornado. There are three types of downbursts. Microbursts, Macrobursts and the most damaging, Derechos. These events are especially dangerous for aircraft as they can mislead the pilot into overcompen-sating for the wind in one direction only to be blown further in the opposite direction often leading to a crash.
Thesis Documentation
Rochester Institute of Technology College of Imaging Arts and Sciences School of Design
MFA Computer Graphics Design
Jeff Turof
Lake Effect Snow was chosen as an informational topic for the region I live. Being a common occurrence in the Great Lakes region of the US, Lake Effect Snow has the ability to drop several feet of snow on very localized areas in a very short amount of time. The Great Lakes create the perfect fuel for this event being very large areas of water in an area where the wind is funneled across them during the coldest months of the year. As the wind blows across the water, the evaporated moisture from the water is scooped up by the wind and creates clouds. The low altitude of the clouds and surface temperatures freeze this moisture which then falls back down as heavy snow. This cycle continues as long as it’s over water, commonly becoming stronger and stronger by the time land is reached and the cycle is broken. At this point, the snow dumps heavily over land. Areas common to this event are located mainly south and east of the lakes. Areas such as the upper peninsula of Michigan, Northern Ohio and Western, Central and the Tug Hill regions of New York see these amounts. The Tug Hill region of New York, because of its altitude commons see 12-18 feet of snow in a sea-son.
fric-Thesis Documentation
Rochester Institute of Technology College of Imaging Arts and Sciences School of Design
MFA Computer Graphics Design
Jeff Turof
Twelve test subjects were selected and contacted to review the work in progress and the final website. Of the twelve, four replied to the work in progress request and five replied on the final. Questions and results to the final survey are listed below.
User Feedback
What is your opinion of the overall website? Select 1 to 5 (5 being the best)
Comments:
Do you feel the navigation is effective? Select 1 to 5 (5 being the best)
If you could change it, what would you like to see?
Are the graphics effective? Select 1 to 5 (5 being the best )
If you could change them, what would you like to see?
Is the content easy to understand? (yes or no)
Comments:
Are the instructions on the interactive components easy to understand?
Select 1 to 5 (5 being the best ) Comments:
Did you learn anything? (yes or no) Comments:
Would you return? (yes or no)
1 2 3 4 5 1 4
5
5
1 1 3
1 4
5
Yes No
5 I really liked it.
Great website! Very easy to get around. The graphics were well done.
I thought there would be more to the interactives.
No comments.
I thought the graphics and photography were beautiful.
You took some complicated information and made it very easy to understand. Nice job!
I would’ve liked to see more things to do.
No comments.
Thesis Documentation
Rochester Institute of Technology College of Imaging Arts and Sciences School of Design
MFA Computer Graphics Design
Jeff Turof
Programming
The dynamic aspect of this website was accomplished through the use of xml. A very basic xml file was de-veloped with the root tag of <cgdThesis> and child tags identifying the topic swf file name and text to be embedded in succession throughout that topic <topic file=”topicX.swf”>Shelf Cloud</topic>. Originally the graphics and audio were going to be controlled by the xml as well but after several setbacks trying to load the correct lines of xml via the Actionscript, it was decided to limit the xml to text only.
Beginning by establishing an xml variable, an xml list variable and setting up a URLLoader to load the XML file; the location of which is drawn from the Shell file. Once loaded, the child line for that page is located and the text element within that line is brought into the des-ignated text boxes on that page which typically are the title and any body text boxes needed.
A few issues were encountered, the biggest of which appeared to be causing the audio voice-over to mal-function and after consultation with numerous other developers, no solution could be found. The workaroud for this resulted in the text on those pages to be static and not xml driven. A disappointing solution, but one that worked in the end. Additionally the file sizes were now much larger than what would normally be ac-ceptable due to the audio and graphics needing to be embedded in the Flash file. This is apparent in the first topic especially where the introduction screen’s audio plays before the graphics load completely.
XML
Actionscript
The Shell
Thesis Documentation
Rochester Institute of Technology College of Imaging Arts and Sciences School of Design
MFA Computer Graphics Design
Jeff Turof
import flash.events.IOErrorEvent; import flash.events.MouseEvent; // stop the main timeline
stop();
// create variables to handle xml data
var xmlData =[“data/topic1.xml”, “data/topic2.xml”, “data/topic3.xml”, “data/topic4.xml”]; var xmlTopic =[“Supercell Thunderstorm”,”Downbursts”,”Lake Effect Snow”,”Hurricanes”]; var currentTopic:Number = 0;
// create variables that allow main menu buttons to be active and clickable var topic1Active:Boolean = true;//Supercell Thunderstorms
var topic2Active:Boolean = true;//Downdrafts var topic3Active:Boolean = true;//Lake Effect var topic4Active:Boolean = true;//Hurricanes
// hide preloader art loaderText_txt.visible = false;
bar_mc.visible = false;
// define new loader object and URL request var myLoader:Loader = new Loader();
// show preloading of content
myLoader.contentLoaderInfo.addEventListener(ProgressEvent.PROGRESS, showProgress); function showProgress(e:ProgressEvent){
loaderText_txt.visible = true; bar_mc.visible = true;
var percent:int = (e.target.bytesLoaded / e.target.bytesTotal) * 100; loaderText_txt.text = String(percent + “%”);
bar_mc.width = percent; }
// load external SWF content
myLoader.contentLoaderInfo.addEventListener(Event.COMPLETE, loadImage);
myLoader.contentLoaderInfo.addEventListener(IOErrorEvent.IO_ERROR, errorHandler); function errorHandler(e:IOErrorEvent):void{
trace(e.text); }
First a shell, or container was created which housed the ‘Chrome’ which is the overall page graphics seen by the user. This includes background graphics, a pre-loader that consists of a bar that grows as the page is loaded in, a ‘holder’ for the dynamic main content which is loaded via a standard loader object and event listener sequence, the topic navigation on the top of the page, the logo and a credits page the users can jump to to see research references and photography credits. This project was a huge collaborative effort, all of whom are mentioned on the credits page of this paper.
Thesis Documentation
Rochester Institute of Technology College of Imaging Arts and Sciences School of Design
MFA Computer Graphics Design
Jeff Turof
function loadImage(e:Event):void { // hide preloader art
loaderText_txt.visible = false; bar_mc.visible = false;
holder_mc.addChild(myLoader); }
// define and load XML data var xml:XML;
var xmlList:XMLList;
var xmlLoader:URLLoader = new URLLoader;
xmlLoader.load(new URLRequest(xmlData[currentTopic])); xmlLoader.addEventListener(Event.COMPLETE, xmlLoaded); function xmlLoaded(e:Event){
xml = XML(e.target.data);
xmlList = xml.children(); //Load the opening animation and update dynamic text myLoader.load(new URLRequest(xmlList[0].attribute(“file”))); topic1_mc.buttonLabel_txt.text = xmlTopic[0];
topic2_mc.buttonLabel_txt.text = xmlTopic[1]; topic3_mc.buttonLabel_txt.text = xmlTopic[2]; topic4_mc.buttonLabel_txt.text = xmlTopic[3]; //gallery_mc.buttonLabel_txt.text = xmlList[34]; }
//credits button cHot.buttonMode=true;
cHot.addEventListener(MouseEvent.ROLL_OVER, overMe); cHot.addEventListener(MouseEvent.CLICK, hitIt);
function overMe(e:MouseEvent){
creditButton.gotoAndStop(“over”); }
function hitIt(e:MouseEvent){ gotoAndStop(“credits”); }
// enable cursor change over movie clip buttons topic1_mc.buttonMode = true;
topic2_mc.buttonMode = true; topic3_mc.buttonMode = true; topic4_mc.buttonMode = true; //gallery_mc.buttonMode = true;
Thesis Documentation
Rochester Institute of Technology College of Imaging Arts and Sciences School of Design
MFA Computer Graphics Design
Jeff Turof
topic1_mc.mouseChildren = false; topic2_mc.mouseChildren = false; topic3_mc.mouseChildren = false; topic4_mc.mouseChildren = false; //gallery_mc.mouseChildren = false;
stage.addEventListener(Event.ENTER_FRAME, checkForComplete); If topic has been visited, this indicates so.
function checkForComplete(e:Event):void { if(topic1Active == false){
topic1_mc.gotoAndStop(“complete”); topic1_mc.enabled = false;
}
if(topic2Active == false){
topic2_mc.gotoAndStop(“complete”); topic2_mc.enabled = false;
}
if(topic3Active == false){
topic3_mc.gotoAndStop(“complete”); topic3_mc.enabled = false;
}
if(topic4Active == false){
topic4_mc.gotoAndStop(“complete”); topic4_mc.enabled = false;
} }
// topic buttons code Defines the over/out states for the Topic Naviga-tion buttons.
topic1_mc.addEventListener(MouseEvent.MOUSE_OVER, onOver1); topic1_mc.addEventListener(MouseEvent.MOUSE_OUT, onOut1); topic1_mc.addEventListener(MouseEvent.MOUSE_UP, goTopic); but1.addEventListener(MouseEvent.MOUSE_OVER, onOver1); but1.addEventListener(MouseEvent.MOUSE_OUT, onOut1);
topic2_mc.addEventListener(MouseEvent.MOUSE_OVER, onOver2); topic2_mc.addEventListener(MouseEvent.MOUSE_OUT, onOut2); topic2_mc.addEventListener(MouseEvent.MOUSE_UP, goTopic); but2.addEventListener(MouseEvent.MOUSE_OVER, onOver2); but2.addEventListener(MouseEvent.MOUSE_OUT, onOut2);
Thesis Documentation
Rochester Institute of Technology College of Imaging Arts and Sciences School of Design
MFA Computer Graphics Design
Jeff Turof
topic4_mc.addEventListener(MouseEvent.MOUSE_OVER, onOver4); topic4_mc.addEventListener(MouseEvent.MOUSE_OUT, onOut4); topic4_mc.addEventListener(MouseEvent.MOUSE_UP, goTopic); but4.addEventListener(MouseEvent.MOUSE_OVER, onOver4); but4.addEventListener(MouseEvent.MOUSE_OUT, onOut4);
// add event handlers
function onOver1(e:MouseEvent):void{ but1.gotoAndStop(“over”); }
function onOut1(e:MouseEvent):void{ but1.gotoAndStop(1);
}
function onOver2(e:MouseEvent):void{ but2.gotoAndStop(“over”); }
function onOut2(e:MouseEvent):void{ but2.gotoAndStop(1);
}
function onOver3(e:MouseEvent):void{ but3.gotoAndStop(“over”); }
function onOut3(e:MouseEvent):void{ but3.gotoAndStop(1);
}
function onOver4(e:MouseEvent):void{ but4.gotoAndStop(“over”); }
function onOut4(e:MouseEvent):void{ but4.gotoAndStop(1);
}
var totalTopics:Number=1; function goTopic(e:MouseEvent):void{ // go to the normal button state e.target.gotoAndStop(“up”);
trace(“My name is “ + e.target.name); SoundMixer.stopAll();
// if the movie clip’s instance name is ‘topicX_mc’ then load data from array if(e.target.name == “topic1_mc”){
currentTopic = 0;
Thesis Documentation
Rochester Institute of Technology College of Imaging Arts and Sciences School of Design
MFA Computer Graphics Design
Jeff Turof
topic1_mc.removeEventListener(MouseEvent.MOUSE_OVER, onOver1); topic1_mc.removeEventListener(MouseEvent.MOUSE_OUT, onOut1); but1.removeEventListener(MouseEvent.MOUSE_OVER, onOver1); but1.removeEventListener(MouseEvent.MOUSE_OUT, onOut1); xmlLoader.load(new URLRequest(xmlData[currentTopic]));
myLoader.load(new URLRequest(“topic1.swf”)); }
if (e.target.name == “topic2_mc”){ currentTopic = 1;
SoundMixer.stopAll();
but2.gotoAndStop(“over”); but1.gotoAndStop(1); but3.gotoAndStop(1); but4.gotoAndStop(1);
topic2_mc.removeEventListener(MouseEvent.MOUSE_OVER, onOver2); topic2_mc.removeEventListener(MouseEvent.MOUSE_OUT, onOut2); but2.removeEventListener(MouseEvent.MOUSE_OVER, onOver2); but2.removeEventListener(MouseEvent.MOUSE_OUT, onOut2); xmlLoader.load(new URLRequest(xmlData[currentTopic]));
myLoader.load(new URLRequest(“topic2.swf”)); totalTopics++
checkFin(); }
if (e.target.name == “topic3_mc”){ currentTopic = 2;
SoundMixer.stopAll();
but3.gotoAndStop(“over”); but1.gotoAndStop(1); but2.gotoAndStop(1); but4.gotoAndStop(1);
topic3_mc.removeEventListener(MouseEvent.MOUSE_OVER, onOver3); topic3_mc.removeEventListener(MouseEvent.MOUSE_OUT, onOut3); but3.removeEventListener(MouseEvent.MOUSE_OVER, onOver3); but3.removeEventListener(MouseEvent.MOUSE_OUT, onOut3); xmlLoader.load(new URLRequest(xmlData[currentTopic]));
myLoader.load(new URLRequest(“topic3.swf”)); totalTopics++
checkFin(); }
if (e.target.name == “topic4_mc”){ currentTopic = 3;
SoundMixer.stopAll();
Thesis Documentation
Rochester Institute of Technology College of Imaging Arts and Sciences School of Design
MFA Computer Graphics Design
Jeff Turof
topic4_mc.removeEventListener(MouseEvent.MOUSE_OVER, onOver4); topic4_mc.removeEventListener(MouseEvent.MOUSE_OUT, onOut4); but4.removeEventListener(MouseEvent.MOUSE_OVER, onOver4); but4.removeEventListener(MouseEvent.MOUSE_OUT, onOut4); xmlLoader.load(new URLRequest(xmlData[currentTopic]));
myLoader.load(new URLRequest(“topic4.swf”)); totalTopics++
checkFin(); }
}
function checkFin(){
trace(totalTopics); if (totalTopics == 4){
trace(“DONE”); }
}
Each topic is encompassed in its own SWF file and each page has its own frame.
Thesis Documentation
Rochester Institute of Technology College of Imaging Arts and Sciences School of Design
MFA Computer Graphics Design
Jeff Turof
The template layer is a non-publishable layer that lays an image of the shell under the topic content to be sure things are placed properly and look alright in context with the rest of the project.
The two actionscript layers are separated for a couple of reasons. Some of the scripts might trump other scripts if the previous frames are overwritten. Thus they’re scripted on separate layers to run simultane-ously.
Actions 1 holds the main topic scripts in the first frame and continues for each change of the xml text calls. Ac-tions 2 is responsible for the navigation button
event listeners.
See the code example of the first frame below for more detail.
import flash.media.SoundMixer; This initiates the sound channel for the voice-over. import flash.media.Sound;
import flash.events.Event; import flash.net.URLRequest; // stop timeline
stop();
var myLoader:Loader = new Loader(); New Loader for dynamic content
var soundChannel:SoundChannel = new SoundChannel(); New Sound Channel
var snd:Sound = new Sound(); and variable for that sound. //xml
var xml: XML; Initiates the xml and builds the data list. var xmlList:XMLList;
var xmlLoader:URLLoader = new URLLoader;
xmlLoader.addEventListener(Event.COMPLETE, xmlLoaded); xmlLoader.load(new URLRequest(“data/topic3.xml”));
myLoader.contentLoaderInfo.addEventListener(IOErrorEvent.IO_ERROR, errorHandler); function errorHandler(e:IOErrorEvent):void{
trace(e.text); }
function xmlLoaded(e:Event):void{ xml = XML(e.target.data); xmlList = xml.children();
title_txt.text = xmlList[0]; Identifies lines of text to pull from the xml list. body_txt.text = xmlList[1];
}
next_mc.buttonMode=true; Initializes the navigation buttons and defines rollover states.
Thesis Documentation
Rochester Institute of Technology College of Imaging Arts and Sciences School of Design
MFA Computer Graphics Design
Jeff Turof
next_mc.addEventListener(MouseEvent.CLICK, goNext);
next_mc.addEventListener(MouseEvent.MOUSE_OVER, rollOn); next_mc.addEventListener(MouseEvent.MOUSE_OUT, rollOff); back_mc.addEventListener(MouseEvent.CLICK, goBack);
back_mc.addEventListener(MouseEvent.MOUSE_OVER, rollOn); back_mc.addEventListener(MouseEvent.MOUSE_OUT, rollOff);
// add event handlers
function goNext(e:MouseEvent):void { trace(“next”);
nextFrame();
SoundMixer.stopAll(); }
function rollOn(e:MouseEvent){ e.target.gotoAndStop(“over”); }
function rollOff(e:MouseEvent){ e.target.gotoAndStop(1); }
function goBack(e:MouseEvent):void { prevFrame();
SoundMixer.stopAll(); }
The Drag and Drop interactive requires the user to select an object, in this case, a word and drag it to its correct location on the photographic background.
This required code designating objects that are draggable and that once placed in the correct locations. The location is determined by a hotspot on the stage. When the dragged object’s coordinates intersect the coordinates of the destination target, the object will snap to that target location. A correct response results in their destination targets disap-pearing and being counted, via a counter script, as one of the six tasks being completed. Additionally,
Thesis Documentation
Rochester Institute of Technology College of Imaging Arts and Sciences School of Design
MFA Computer Graphics Design
Jeff Turof
stop();
import flash.events.MouseEvent;
var pieceNumber:Number = 0; // variable keeps track of the number of pieces moved. var selectedTrain:String;
//drag and drop buttonMode anvil_mc.buttonMode=true; wall_mc.buttonMode=true; FFD_mc.buttonMode=true; meso_mc.buttonMode=true; mammatus_mc.buttonMode=true; gust_mc.buttonMode=true;
//drag and drop dragable
anvil_mc.addEventListener(MouseEvent.MOUSE_DOWN, drag); anvil_mc.addEventListener(MouseEvent.MOUSE_UP, drop1); wall_mc.addEventListener(MouseEvent.MOUSE_DOWN, drag); wall_mc.addEventListener(MouseEvent.MOUSE_UP, drop2); FFD_mc.addEventListener(MouseEvent.MOUSE_DOWN, drag); FFD_mc.addEventListener(MouseEvent.MOUSE_UP, drop3); meso_mc.addEventListener(MouseEvent.MOUSE_DOWN, drag); meso_mc.addEventListener(MouseEvent.MOUSE_UP, drop4);
mammatus_mc.addEventListener(MouseEvent.MOUSE_DOWN, drag); mammatus_mc.addEventListener(MouseEvent.MOUSE_UP, drop5); gust_mc.addEventListener(MouseEvent.MOUSE_DOWN, drag); gust_mc.addEventListener(MouseEvent.MOUSE_UP, drop6);
function drag(e:MouseEvent):void { e.target.startDrag();
//set target so it appears above the rest of the other pics. setChildIndex(MovieClip(e.target), numChildren -1); }
/* ffdDrop anvilDrop mamDrop1 mamDrop2 mesoDrop wallDrop gustDrop*/
function drop1(e:MouseEvent):void { // stop dragging the current pic stopDrag();
// check to see if current pic is on its corresponding target
when placed in the designated area, the correct word will snap into place and will not be draggable anymore.
Thesis Documentation
Rochester Institute of Technology College of Imaging Arts and Sciences School of Design
MFA Computer Graphics Design
Jeff Turof
if(e.target.hitTestObject(anvilDrop)){ //lock the puzzle piece in place e.target.x = anvilDrop.x; e.target.y = anvilDrop.y;
//remove listeners so user can’t drag again
anvil_mc.removeEventListener(MouseEvent.MOUSE_DOWN,drag); anvil_mc.removeEventListener(MouseEvent.MOUSE_UP,drop1); //update variables
pieceNumber++; aTarget.visible=false; checkDone();
} }
function drop2(e:MouseEvent):void { // stop dragging the current pic stopDrag();
// check to see if current pic is on its corresponding target if(e.target.hitTestObject(wallDrop)){
//lock the puzzle piece in place e.target.x = wallDrop.x; e.target.y = wallDrop.y;
//remove listeners so user can’t drag again
wall_mc.removeEventListener(MouseEvent.MOUSE_DOWN,drag); wall_mc.removeEventListener(MouseEvent.MOUSE_UP,drop2); //update variables
pieceNumber++; wTarget.visible=false; checkDone();
} }
function drop3(e:MouseEvent):void { // stop dragging the current pic stopDrag();
// check to see if current pic is on its corresponding target if(e.target.hitTestObject(ffdDrop)){
//lock the puzzle piece in place e.target.x = ffdDrop.x;
e.target.y = ffdDrop.y;
//remove listeners so user can’t drag again
FFD_mc.removeEventListener(MouseEvent.MOUSE_DOWN,drag); FFD_mc.removeEventListener(MouseEvent.MOUSE_UP,drop3); //update variables
pieceNumber++; fTarget.visible=false; checkDone();
Thesis Documentation
Rochester Institute of Technology College of Imaging Arts and Sciences School of Design
MFA Computer Graphics Design
Jeff Turof
function drop4(e:MouseEvent):void { // stop dragging the current pic stopDrag();
// check to see if current pic is on its corresponding target if(e.target.hitTestObject(mesoDrop)){
//lock the puzzle piece in place e.target.x = mesoDrop.x; e.target.y = mesoDrop.y;
//remove listeners so user can’t drag again
meso_mc.removeEventListener(MouseEvent.MOUSE_DOWN,drag); meso_mc.removeEventListener(MouseEvent.MOUSE_UP,drop4); //update variables
pieceNumber++;
mezTarget.visible=false; checkDone();
} }
function drop5(e:MouseEvent):void { // stop dragging the current pic stopDrag();
// check to see if current pic is on its corresponding target if(e.target.hitTestObject(mamDrop1)){
//lock the puzzle piece in place e.target.x = mamDrop1.x e.target.y = mamDrop1.y
//remove listeners so user can’t drag again
mammatus_mc.removeEventListener(MouseEvent.MOUSE_DOWN,drag); mammatus_mc.removeEventListener(MouseEvent.MOUSE_UP,drop5); //update variables
pieceNumber++; mTarget.visible=false; m2Target.visible=false; checkDone();
}
if(e.target.hitTestObject(mamDrop2)){ e.target.x = mamDrop2.x; e.target.y = mamDrop2.y
mammatus_mc.removeEventListener(MouseEvent.MOUSE_DOWN,drag); mammatus_mc.removeEventListener(MouseEvent.MOUSE_UP,drop5); pieceNumber++;
m2Target.visible=false; mTarget.visible=false; checkDone();
Thesis Documentation
Rochester Institute of Technology College of Imaging Arts and Sciences School of Design
MFA Computer Graphics Design
Jeff Turof
function drop6(e:MouseEvent):void { // stop dragging the current pic
stopDrag();
// check to see if current pic is on its corresponding target if(e.target.hitTestObject(gustDrop)){
//lock the puzzle piece in place e.target.x = gustDrop.x; e.target.y = gustDrop.y;
//remove listeners so user can’t drag again
gust_mc.removeEventListener(MouseEvent.MOUSE_DOWN,drag); gust_mc.removeEventListener(MouseEvent.MOUSE_UP,drop6); //update variables
pieceNumber++; gTarget.visible=false; checkDone();
} }
function checkDone(){ trace(pieceNumber); if (pieceNumber == 6){
gotoAndPlay(275); }
}
The user-controlled interactive allows the user to rotate around and zoom in on a 3d generated model that resembles the shape of a supercell thunder-storm. While rotating around, the user is presented with circles that when rolled over give the user more information about that area of the storm.
This required rendering out 2 PNG sequences from Autodesk Maya. The first was a rotation starting at the upper left of the storm and rotating down across the center and ending up at the lower-right of the storm. The code was set up so that it counted the number of frames in each animated sequence and setting that value to the slider the user controls so that as the user slides the slider, it moves the ani-mation frame by frame in whichever direction they
Thesis Documentation
Rochester Institute of Technology College of Imaging Arts and Sciences School of Design
MFA Computer Graphics Design
Jeff Turof
stop();
//// position the slider in the middle of the slider bar //mySlider_mc.x = bar_mc.x + bar_mc.width/2; //mySlider_mc.buttonMode = true;
// position the slider in the middle of the slider bar mySlider_mc.x = bar_mc.x;
mySlider_mc.buttonMode = true; //slider2
mySlider2_mc.x = bar2_mc.x; mySlider2_mc.buttonMode = true; /// create the event listeners for the slider
mySlider_mc.addEventListener(MouseEvent.MOUSE_DOWN, moveSlider); mySlider_mc.addEventListener(MouseEvent.MOUSE_UP, stopSlider); mySlider_mc.addEventListener(Event.ENTER_FRAME, changeMC);
mySlider2_mc.addEventListener(MouseEvent.MOUSE_DOWN, move2Slider); mySlider2_mc.addEventListener(MouseEvent.MOUSE_UP, stop2Slider); mySlider2_mc.addEventListener(Event.ENTER_FRAME, change2MC);
// event handlers
function moveSlider(evt:MouseEvent):void {
// define slider draggable boundaries based on bar movie clip
var myBoundaries:Rectangle = new Rectangle(bar_mc.x, bar_mc.y, bar_mc.width, 0) evt.target.startDrag(true, myBoundaries);
if (evt.target == mySlider_mc){ animation2.visible = false; animation.visible = true; }
stage.addEventListener(MouseEvent.MOUSE_UP, stopSlider); }
function move2Slider(evt:MouseEvent):void {
// define slider draggable boundaries based on the bar movie clip
var myBoundaries:Rectangle = new Rectangle(bar2_mc.x, bar2_mc.y, bar2_mc.width, 0) evt.target.startDrag(true, myBoundaries);
if (evt.target == mySlider2_mc){
slide in. The second sequence allows the user to zoom in from roughly the lower-right region of the storm which takes the user in closer to the gust front and wall cloud location. Originally I had intended there to be multiple spots throughout the sequence that the user could zoom in on to explore further. This is an area I would like to expand upon in the future.
After this was complete, code was developed to al-low users to view a pop-up information box when they roll-over a circle. These circles rotate with the user, some of which rotate out of view depending on the location of the rotation.
Thesis Documentation
Rochester Institute of Technology College of Imaging Arts and Sciences School of Design
MFA Computer Graphics Design
Jeff Turof
animation.visible=false; animation2.visible=true; }
stage.addEventListener(MouseEvent.MOUSE_UP, stop2Slider); }
// stop event handlers
function stop2Slider(evt:MouseEvent):void { stopDrag();
stage.removeEventListener(MouseEvent.MOUSE_UP, stop2Slider); //animation.visible=true;
}
function stopSlider(evt:MouseEvent):void { stopDrag();
stage.removeEventListener(MouseEvent.MOUSE_UP, stopSlider); //animation2.visible=true;
}
//control movie clip with slider function changeMC(evt:Event):void {
var left:Number = bar_mc.x;
var right:Number = left + bar_mc.width;
var frame:Number = Math.floor((evt.target.x - left) / (right - left) * 100); if(frame <= 1){
frame = 1; }
animation.gotoAndStop(frame); }
function change2MC(evt:Event):void { var left2:Number = bar2_mc.x;
var right2:Number = left2 + bar2_mc.width;
var frame2:Number = Math.floor((evt.target.x - left2) / (right2 - left2) * 100); if(frame2 <= 1){
frame2 = 1; }
Thesis Documentation
Rochester Institute of Technology College of Imaging Arts and Sciences School of Design
MFA Computer Graphics Design
Jeff Turof
stop();
import flash.media.SoundMixer; import flash.media.Sound; import flash.events.Event; import flash.net.URLRequest;
var myLoader:Loader = new Loader();
var soundChannel:SoundChannel = new SoundChannel(); var snd:Sound = new Sound();
//xml
var xml: XML; var xmlList:XMLList;
var xmlLoader:URLLoader = new URLLoader;
xmlLoader.addEventListener(Event.COMPLETE, xmlLoaded); xmlLoader.load(new URLRequest(“data/topic1.xml”));
myLoader.contentLoaderInfo.addEventListener(IOErrorEvent.IO_ERROR, errorHandler); function errorHandler(e:IOErrorEvent):void{
trace(e.text); }
function xmlLoaded(e:Event):void{ xml = XML(e.target.data); xmlList = xml.children(); }
classicHit.buttonMode=true; lpHit.buttonMode=true; hpHit.buttonMode=true; classicTag.buttonMode=true; LPtag.buttonMode=true; HPtag.buttonMode=true;
classicHit.addEventListener(MouseEvent.CLICK, hit1); lpHit.addEventListener(MouseEvent.CLICK, hit2); hpHit.addEventListener(MouseEvent.CLICK, hit3); classicTag.addEventListener(MouseEvent.CLICK, hit1); LPtag.addEventListener(MouseEvent.CLICK, hit2); HPtag.addEventListener(MouseEvent.CLICK, hit3);
The click and stick as mentioned earlier is an interactive element in an e-learning exercise that instructs the user to click on an object, in this case, an image and they are presented with information and/or images that tell more about the topic clicked.
The code enabling this is below:
Thesis Documentation
Rochester Institute of Technology College of Imaging Arts and Sciences School of Design
MFA Computer Graphics Design
Jeff Turof
Completing this project allowed me to delve into a topic I’ve been interested in since I was a kid. Weather is a discipline that is filled with standards. Similar to design, we’re always looking for ways to push the standard to a new level and this project challenged me to do just that with weather standards. Instead of using the traditional graphics and icons, I was faced with the chore of showing and explaining weather phenomena using 3d and animation. This required me to use my Photoshop skills to build illustrations of cloud struc-ture. It allowed me to hone my skills in 3d fluids, a tool that had recently grown on me and left me with the desire to learn more. It also, however, allowed me to use the skills in project management and development I’ve learned in my full time work. These skills helped me enormously to organize my research, point me in the directions needed to develop successful solutions and use my limited time to its maximum.
Conclusion
function hit1(e:MouseEvent):void{ gotoAndStop(300);
}
function hit2(e:MouseEvent):void{ gotoAndStop(301);
}
function hit3(e:MouseEvent):void{ gotoAndStop(302);
}
What I’ve Learned
As mentioned earlier, challenges in this project were everywhere. 3d fluids were the biggest with their
Thesis Documentation
Rochester Institute of Technology College of Imaging Arts and Sciences School of Design
MFA Computer Graphics Design
Jeff Turof
nical requirements and limited capabilities. My own abilities were a challenge and required me to work hard to bring myself up to speed not only using the software needed to build the simulations in this project but also to learn as much as possible about the weath-er phenomena I wanted to discuss. Learning about supercell thunderstorms was probably the biggest challenge since they don’t generally occur in our area. We get aspects common to supercells such as cumulo-nimbus clouds, gust fronts and downbursts, but due to the terrain in the area, the conditions rarely allow for the development of an actual supercell. Without being able to actually experience this event, it made it that much more difficult to learn about. Another challenge was my limited ability in programming. Some of what I needed to build was very difficult for me to grasp and my inability made construction of the shell and topic pages very difficult. Additionally I found very little sup-port in the Flash community. Generally I received no replies to my emails and posts on forums. The same cannot be said about the 3d community. I’d say over 90% of my questions were answered and not just with basic replies. Stuart Christensen actually built me a tutorial showing me how to accomplish some issues with fluids.
Final Word
Thesis Documentation
Rochester Institute of Technology College of Imaging Arts and Sciences School of Design
MFA Computer Graphics Design
Jeff Turof
Situation Analysis
Thesis Proposal
A father and his daughter watch TV one summer night when a severe weather bulletin flashes across the screen warning of thunderstorms moving across the area. The warning continues, informing that these storms could produce heavy rain, vivid lightning, hail and possible tornadoes. The daughter clinches her father’s arm and asks, “Will there be a tornado at our house”? Her father sees she is scared and thinks this to be a great learning opportunity so he gets online to try to explain better what the cause is for the se-vere storms. To his dismay however, he can’t find any websites that show or explain clearly and simply so his daughter will understand.
The weather is a subject that everyone experiences but not a lot of people understand. In general, it is an
extremely complex topic consisting of many variables and weather forecasting itself is more or less a guess-ing game based on those variables. If one variable changes, it will effect the resulting outcome. Explaining the weather can be equally challenging but by using interactive multimedia technology, one can use the forecasting information, add engaging graphics and provide an instructional vehicle in which the weather can be explained in a fashion that even the father’s young daughter will understand.
Problem Statement
The field of meteorology and the weather consist of an immense amount of information, but very little of that information is given in an everyday, easy-to-use or understandable format.
Thesis Documentation
Rochester Institute of Technology College of Imaging Arts and Sciences School of Design
MFA Computer Graphics Design
Jeff Turof
reading, but by being able to interact with each phe-nomena and visually seeing how different aspects of the weather interact with each other, a more rounded learning experience can be provided.
This type of tool has not been created in the way I in-tend to present it. In fact, only three similar interactive weather applications resulted in my searches. One was aimed at a college level learner with only maps and satellite imagery for graphics. Another gave an animat-ed example of the effects different stages of a hurricane might have on an island system. The last concentrated on ‘Nature’ in general and not specifically the weather.
Survey of Literature
National Geographic – Forces of Nature
Scott Dobler, Western Kentucky University, Dept of Ge-ography and Geology; Kim Hulse, National Geographic Society, Education and Children’s Programs
http://environment.nationalgeographic.com/environ-ment/natural-disasters/forces-of-nature.html?section=t
National Geographic’s Forces of Nature is a great example of the type of tool I’d like to build. It takes different natural phenomena and allows the user to experiment with settings to produce various storms and resulting possible damage. The main differences between this site and what I’m proposing is that my tool will concentrate only on weather and will allow the user to build a storm and study the effects differ-ent variables have on their formation, not the resulting damage or power it holds.
The VISIT program
NOAA staff and Colorado State meteorological program staff Colorado State University
http://rammb.cira.colostate.edu/visit/visithome.asp
Thesis Documentation
Rochester Institute of Technology College of Imaging Arts and Sciences School of Design
MFA Computer Graphics Design
Jeff Turof
to utilize the increasing internet reliability and band-width. It utilizes text windows, images, animated satellite imagery and interactive graphics to teach a wide
variety of weather-related topics. The text window is a navigation pane of sorts with Next and Back but-tons combined with a main screen area which dis-plays satellite maps and imagery. The window also provides a tool to draw on the maps in certain exer-cises and also to switch maps in order to analyze the concept being presented in greater depth.
Meteorological Training and Professional Development Links
NOAA staff and various University sources
http://www.nwas.org/committees/professionaldevel-opment/links.html
NOAA or the National Oceanic and Atmospheric Administration provides a website that delves into a wide variety of weather-related topics and attempts to explain them. This is accomplished on a very high level and is not always explained at a level the aver-age user might understand. The content is inter-spersed with graphs, charts, diagrams and photos to help illustrate the material and is presented as a very basic, unformatted text website. This is a prime example of a site that would benefit through the use of interactive multimedia content that could utilize the data and variables presented in a more interac-tive fashion.
JetStream – Online School for Weather
NOAA staff and the National Weather Service
http://www.srh.noaa.gov/jetstream//
Thesis Documentation
Rochester Institute of Technology College of Imaging Arts and Sciences School of Design
MFA Computer Graphics Design
Jeff Turof
WeatherWatch Scholastic, Inc.
http://teacher.scholastic.com/researchtools/research-starters/weather/
WeatherWatch from Scholastic Inc. provides a more interactive experience for younger students. It does a very good job of explaining about different types of weather in a way children from grades 2 through high school might be comfortable learning about. It provides clickable, animated graphics that link to pages with multiple related topics and additional links for more information. This is very similar to the tool I am proposing but more simplistic with an emphasis on children and not necessarily users of all ages.
NOAA Storm Prediction Center NOAA staff
http://www.spc.noaa.gov/
This has a lot of great information about storm pre-diction and definition. It’s filled with maps, images and data that could be useful when building my storm tool.
National Severe Storms Laboratory Education web-site
NOAA staff
http://www.nssl.noaa.gov/edu/
Thesis Documentation
Rochester Institute of Technology College of Imaging Arts and Sciences School of Design
MFA Computer Graphics Design
Jeff Turof
Conclusion
There is a wide array of information available online to learn about weather but no scholarly or whitepa-per sources I could find that deal specifically with the problem I’m addressing. The common variable in all of the presented examples above however is the lack of engaging, easy to understand material. The tool I am proposing would enable any one of those websites to teach about weather in a manner where the users could immerse themselves in the information being presented. Through interactive, user-controlled graphi-cal interfaces, engaging, high resolution graphics, and dynamic transitions between pages, any user will find learning about the weather enjoyable and will want to return to learn more in the future.
Technical sources
The Area
Autodesk user forums and tutorials
http://area.autodesk.com/
The Area is a tool provided by Autodesk that offers us-ers tutorials on 3d techniques and tools, tips and tricks and a user’s forum where 3d artists and designers can bounce ideas and questions off each other.
CG Society
3d and Motion Graphics user forums and tutorials
http://www.cgsociety.org/
CG Society is a forum set up for 3d artists and design-ers to pose questions and ideas, learn new skills on the tutorials section, find jobs and browse galleries of user’s work.
Gnomon Library
Video tutorial DVDs on Maya
Maya Dynamics: Outer Space Environments Introduction to Maya Fluid Effects
Digital Tutors Library
Video tutorial DVDs on Maya nParticles
Thesis Documentation
Rochester Institute of Technology College of Imaging Arts and Sciences School of Design
MFA Computer Graphics Design
Jeff Turof
gotoandlearn.com Online Flash tutorials by Lee Brimelow
Lynda.com
Online tutorials on Maya Maya Particle Effects by Audri Phillips
YouTube Tutorials
3d Clouds in Maya using 3d Fluid Containers by DNguyenArt
Photography
NOAA, University of Illinois Atmospheric Society, Charles Doswell’s Outdoor Images, Alan Moller Pho-tography.
Design Ideation
Since this project is aimed at a wide variety of us-ers, I want to be sure the layout is simple and easy to understand. The content should be written clearly and simply but not so simple as to insult an older user’s intelligence.
Thesis Documentation
Rochester Institute of Technology College of Imaging Arts and Sciences School of Design
MFA Computer Graphics Design
Jeff Turof
Implementation
Being instructional in nature, this project will be built in a logical structure consisting of an introduction page that reviews all of the topics being discussed. Each of the topic pages will include a definition page ex-plaining the topic, pages that discuss what factors are involved with that topic, and interactive elements such as ‘click and sticks’, drag and drop exercises and a minimum of one user controlled simulations. The user controlled simulation will obviously have limits. A concept for one is to save out 10-12 short clips around the circumference of a storm that will serve as points to zoom in/out from or rotate up/down to/from.
Graphics and animations will be a combination of 3d simulated animations, vector animations and photog-raphy taken both by myself as well as online sources.
Each page’s navigation will enable the user to return to the previous page, advance to the next page, return to the menu or exit from the program.
Thesis Documentation
Rochester Institute of Technology College of Imaging Arts and Sciences School of Design
MFA Computer Graphics Design
Jeff Turof
Example Home Page Layout
Thesis Documentation
Rochester Institute of Technology College of Imaging Arts and Sciences School of Design
MFA Computer Graphics Design
Jeff Turof
Thesis Documentation
Rochester Institute of Technology College of Imaging Arts and Sciences School of Design
MFA Computer Graphics Design
Jeff Turof
Interactive Types
Click an image and get more information.
Drag a word to it’s place on the image. Targets are marked by the circles.
Thesis Documentation
Rochester Institute of Technology College of Imaging Arts and Sciences School of Design
MFA Computer Graphics Design
Jeff Turof
Deployment and Testing
This project will be delivered as an interactive website hosted on my freelance website. The URL is: http:// www.beonthemark.com/Thesis/Shell.html.
I do not foresee any limitations budget-wise or with functionality. The only requirement on the user’s end will be the need for Flash Player 10 or higher to be installed.
My test audience will involve a variety of users ranging from grade-school level children up to senior citizens who have an interest in the weather. To include users with no interest could potentially taint any comments I receive on usability and content relevancy.
Timeline
Thesis Documentation
Rochester Institute of Technology College of Imaging Arts and Sciences School of Design
MFA Computer Graphics Design
Jeff Turof
American Meteorological Society. Multiple Contributors. <http://www.ametsoc.org/amsedu/educationresourc es.html>.
Brain, Marshall, Freudenrich, Craig, Ph.D., Lamb, Robert. How Hurricanes Work. 2012. <http://science.howstuff works.com/nature/natural-disasters/hurricane.htm>.
Colorado State University, VISIT program. Web.
<http://rammb.cira.colostate.edu/visit/visit_prog.html>.
Cooper, Steven and Cain, Dennis. JetStream Online School for Weather. NOAA. Web. <http://www.srh. noaa.gov/jetstream/>.
Extreme Instability. <http://www.extremeinstability. com/04-5-28.htm>.
Haby, Jeff. Hab