UNIVERSITI TEKNIKAL MALAYSIA MELAKA
PRODUCTIVITY PERFORMANCE IMPROVEMENT IN A
MANUFACTURING COMPANY
This report submitted in accordance with requirement of the Universiti Teknikal Malaysia Melaka (UTeM) for the Bachelor Degree of Manufacturing Engineering
(Manufacturing Management)
by
TAN CHIN NAM B050710035
UNIVERSITI TEKNIKAL MALAYSIA MELAKA
BORANG PENGESAHAN STATUS LAPORAN PROJEK SARJANA MUDA
TAJUK: DEVELOPING A METHODOLOGY FOR PRODUCTIVITY IMPROVEMENT IN A
MANUFACTURING COMPANY
SESI PENGAJIAN: 2010/11 Semester 2
Saya TAN CHIN NAM
mengaku membenarkan Laporan PSM ini disimpan di Perpustakaan Universiti Teknikal Malaysia Melaka (UTeM) dengan syarat-syarat kegunaan seperti berikut: 1. Laporan PSM adalah hak milik Universiti Teknikal Malaysia Melaka dan penulis. 2. Perpustakaan Universiti Teknikal Malaysia Melaka dibenarkan membuat salinan
untuk tujuan pengajian sahaja dengan izin penulis.
3. Perpustakaan dibenarkan membuat salinan laporan PSM ini sebagai bahan pertukaran antara institusi pengajian tinggi.
4. **Sila tandakan (√)
SULIT
TERHAD
TIDAK TERHAD
(Mengandungi maklumat yang berdarjah keselamatan atau kepentingan Malaysia yang termaktub di dalam AKTA RAHSIA RASMI 1972)
(Mengandungi maklumat TERHAD yang telah ditentukan oleh organisasi/badan di mana penyelidikan dijalankan)
Disahkan oleh:
** Jika Laporan PSM ini SULIT atau TERHAD, sila lampirkan surat daripada pihak berkuasa/organisasi berkenaan dengan menyatakan sekali sebab dan tempoh laporan PSM ini perlu dikelaskan sebagai SULIT atau TERHAD.
Alamat Tetap:
NO. 20 Jalan SETIA IMPIAN U13/4N, SETIA ALAM,
40170 SHAH ALAM, Selangor.
Tarikh: _________________________
Cop Rasmi:
DECLARATION
I hereby declare that this report entitled “Productivity Performance Improvement In A Manufacturing Company” is the result of my own research except as cited in the
references.
Signature :
APPROVAL
This report is submitted to the Faculty of Manufacturing Engineering of UTeM as a partial fulfillment of the requirements for the degree of Bachelor of Manufacturing Engineering (Manufacturing Management). The member of the supervisory committee is as follow:
i
ABSTRAK
Sebagai mahasiswa Tahun 4 Ijazah Sarjana Muda, syarat untuk memenuhi permintaan Ijazah Sarjana Muda Kejuruteraan Pembuatan adalah melaksanakan Projek Sarjana Muda dalam tempoh dua semester. Tujuan Proejct Sarjana Muda ini adalah untuk mendedahkan mahasiswa terhadap etika kejuruteraan, tingkah laku professionalism kejuruteraan, kecekapan komunikasi, membina sikap kepercayaan pada diri sendiri dan menanam sikap bekerja yang positif dalam diri mahasiswa supaya dapat membantu beliau mengaplikasikan teori and ilmu praktikal melalui Projek Sarjana Muda yang bertajuk “Productivity Performance Improvement in A
Manufacturing Company”. Tujuan projek adalah memahami “production processes”
dan analisis “production performance” menggunakan “work measurement” kajian masa pada industri tersebut. Pengarang sedang menjalani projek di salah satu “small and medium Industries” atau SME yang bernama Yew Lee Industrial Brush di mana syarikat tersebut menghasilkan pelbagai jenis berus seperti “household brooms, cleaning brush, baby care brushes, toilet bowl brush, industrial brush, industrial
brushes” dan sebagainya. Salah satu “assembly lines” yang menghasilkan produk
family E550 model mempunyai produktiviti output yang rendah disebabkan
“assembly lines” tersebut mempunyai masa pemprosesan yang tinggi. Keadaan ini
ii
ABSTRACT
iii
ACKNOWLEDGEMENTS
I would like to express my deep appreciation and sincere gratitude to Professor Madya Dr Chong Kuan Eng, my final year project supervisor, for his wisdom, invaluable guidance and professionalism from the beginning to the end of my industrial training. PM Chong is always there to listen and to give me the professionalism advice. He taught me how to express my ideas and show me different ways to approach to my final year project.
A special thanks goes to my case company supervisor, Miss KK, who is the most responsible for helping me complete the final year project. Miss KK has been an excellent mentor and has provided unfalling support throughout my visit period to the case company. She taught me how to visualize the problems exist in the working environment, had confidence in me when I doubted myself, and brought out the good ideas in me. (Mostly importantly, he taught me how to smile to reduce stress!) Without her encouragement and constant guidance, I could not have finished my final year project. She was always there to meet and talk to my ideas and to ask me good question to help me think through my problem.
iv
DEDICATION
I would first like to express heartfelt thanks for warmth of love to My
Father & My Mother, Siblings, Friends and my love one.
Thanks you for the endless support and loves to me….
May God bless those who have been giving me their support to
v
TABLE OF CONTENT
Abstrak i
Abstract ii
Acknowledgement iii
Dedication iv
Table of Content v
List of Tables viii
List of Figures ix
List of Abbreviations xi
1. INTRODUCTION 1
1.1 Background of the Project 1
1.2 Project Background 2
1.3 Problem Statement 3
1.4 Objective of the Project 4
1.5 Scope 4
1.6 Potential Benefit of Study 4
2. LITERATURE REVIEW 6
2.1 Introduction 6
2.2 Productivity 7
2.2.1 Productivity Performance 12
2.2.2 Productivity Improvement 14
2.3 Work Study 16
2.3.1 Method Work 17
2.3.1.1 Flow Process Chart 19
2.3.1.2 Left-Hand/Right-Hand Chart 20
2.3.1.3 Multiple Activity Chart 21
2.3.2 Work Measurement 23
2.3.2.1 Stopwatch Time Study 24
2.3.2.1.1Rating Factor 25
vi
2.3.2.2 Work Sampling 28
2.4 Statistical Control 29
2.4.1 Pareto Chart 29
2.4.2 Cause & Effect Diagram 30
2.5 Standardized Work 31
2.5.1 Takt Time 32
2.5.2 Production Capacity Chart 33
2.5.3 Standardized Work Combination Table 33
2.5.4 Operator Balance Chart 34
2.6 Application in Industry 35
2.7 Summary 36
3. METHODOLOGY 39
3.1 Introduction 39
3.2.1 Process Planning 39
3.2.1 Final Year Project 1 (FYP1) 40
3.2.1.1 Initiation Stage (Pilot Study) 41 3.2.1.2 Define Problem, Scope of Study and Objective 41
3.2.1.3 Literature Review 42
3.2.1.4 Understand Work Study Methods 42 3.2.1.5 Identify Appropriate Measurement Techniques 42
3.2.1.6 Final Report FYP 1 43
3.2.2 Final Year Project 2 (FYP 2) 43 3.2.2.1 Data Collection and Stopwatch Time Study 44 3.2.2.2 Identify Bottleneck and Propose the Productivity Improvement
Techniques 45
3.2.2.3 Suggestions, Recommendations and Conclusion 45
3.2.2.4 Final Report FYP 2 45
3.3 Conclusion 46
4. ANALYSIS, RESULT AND DISCUSSION 47
4.1 Introduction 47
4.2 Phase 1 – Mapping the Processes in the Production Line 49
vii
4.2.2 Pareto Chart 51
4.2.3 Flow Process Chart 51
4.2.4 Product Process Flow Diagram 54
4.3 Phase 2 - Analyze the Production Performance 56 4.3.1 Stopwatch Time Study Technique 57 4.3.2 Non-Value Added Activities Analysis 63 4.3.3 Yamazumi Chart (Stacked Bar Chart) 69
4.3.4 Takt Time Calculation 70
4.4 Phase 3 – Propose the Productivity Improvement Techniques
to Improve the Productivity Performance 74
4.4.1 Operator Balance Chart (Line Balancing) 74
4.4.2 Production Kaizen Activity 78
4.4.3 Production Line Performance Monitoring 81 4.4.4 Operator Skills Control and Training 86
4.5 Summary 88
5. CONCLUSIONS AND RECOMMENDATIONS 89
5.1 Conclusions 89
5.2 Recommendations 90
REFERENCES 91
BIBLIOGRAPHY 96
APPENDICES
viii
LIST OF TABLES
2.1 Examples of definitions of productivity table 10
2.2 Performance rating table 26
4.1 Types of brush product model and demand 50 4.2 Flow process chart symbols table 54 4.3 Brush product model E550 processing time table 62 4.4 Non-value added activities and its time taken table 63 4.5 Product model E550 NVA time table 68
ix
LIST OF FIGURES
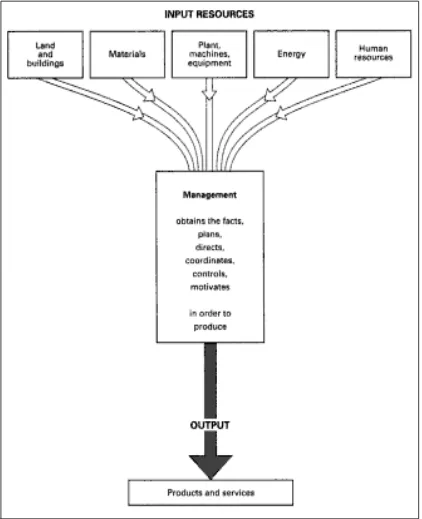
2.1 Role of management in coordinating the resources
of an organization 9
2.2 Transformation process and productivity model 12 2.3 Productivity, profit and price recovery 13 2.4 Productivity’s relation to performance objective 14 2.5 Productivity improvement strategic 15
2.6 Components of work study 16
2.7 The approach of work study 18
2.8 Example of the flow process chart 19 2.9 Example left-hand/right-hand chart for assembly
of two muffler clamps 20
2.10 Example of Multiple Activity Chart 22 2.11 Example of stopwatch time study sheet 25
2.12 Revised table of allowance 27
2.13 Work sampling study form 28
2.14 Example of Pareto Chart 30
2.15 Example of Cause & Effect Diagram 31 2.16 Example of the Production Capacity Chart 33 2.17 Example of the Standardized Work Combination Table 34 2.18 Example of Operator Balance Chart 35
3.1 Flow chart for FYP1 40
3.2 Pilot study phases 41
3.3 Flow chart for FYP2 44
x
4.7 Processing time for NVA against Processes Chart 69 4.8 Yamazumi Chart for brush product model E550 70 4.9 Operator Balance Chart for April 2011 73 4.10 Proposed Operator Balance Chart 75 4.11 Processing time for each process without processing time
for NVA (After Kaizen) 79
xi
LIST OF ABBREVIATIONS, SYMBOLS,
NOMENCLATURES
SME - Small and Medium Enterprise TFP - Total Factor Productivity
NT - Normal Time
ST - Standard Time
SPC - Statistical Process Control BBB - Baby Bottle Brush
1
CHAPTER 1
INTRODUCTION
1.1 Background of the Project
Productivity can be defined as the application of the various resources (inputs) of an organization, industry or country, in order to achieve certain planned and desired results (outputs). Productivity measurement entails a comparison of outputs to inputs are normally by calculation of the productivity index (output/input ratio). Thus, productivity improvement has becomes the establishment of approaches to improve this productivity index. Therefore, efforts to improve the productivity performance in organizations have been important since the start of the industrial era. The productivity improvement has been identified as an important role for any organization, especially for the manufacturing sector to gain more profit that leads to prosperity.
Productivity performance improvement is the only way that can ensure that an organization goes toward a long term perspective and achieve profitability of organization. The effective methods is highly important to reduce the cycle time to finish the product in order to improve the productivity as well as achieving the takt time and fulfill from the customer demands. In order to achieve this purpose, work study method is studied and used in this project, which the research is divided into the two main categories consist of method study and work measurement. The main finding for this project is the process cycle time data of the operators to finish the products. The other findings in this study also involve in proposing productivity improvement techniques to improve the production.
2
carrying out work. Work Measurement is also an application of techniques designed to establish the work content of a specified task and the time taken for a qualified worker to complete that task at a defined level of performance. One of the key uses of work measurement is to measure and monitor the performance of actual output to be compared with planned output. Work measurement also helps to determine to workforce level and compare between different working methods.
Stopwatch time study is one of the reliable work measurement techniques that recording the times and rate of working for the elements of a specified job, carried out under specified condition, and for analyzing the data so as to obtain the time necessary for carrying out the job at a defined level of performance. The basic procedures of the time study is analysis the job, specific measurement technique, and synthesis the various elemental of times. Time study is the oldest of the work measurement technique but it is flexible and cost effective for being applicable to any type of work carried out in any environment.
1.2 Project Background
The case company was established in Malaysia in 1970 as Yew Lee Industrial Brush Sdn Bhd, located at Batu Berendam, Malacca. Yew Lee Industrial Brush is one of the Small and Medium Enterprise (SME) in Malaysia. Different agencies of SMEs have their own criteria based on the benchmarking of the company’s annual sales turnover, number of full time employees or stakeholders’ funds. Since then Yew Lee Industrial Brush has grown from strength to strength to become Malaysia’s foremost and reputable manufacturer of household as well as industrial brooms and brushes. The Company mission is to sustain leadership in the industry while always providing customers with products and services in the highest quality attainable.
3
brings good luck, harmony, prosperity and happiness, indoor broom, and millennium Luban broom. Based on the company annual performance sales, the baby product model E550 has the highest demand of sales from the customers.
In the early 1990s, the company acquired the world’s most advance European assembly technology to ensure output efficiency and high quality finished products. The company products are utilized extensively in varied industries ranging from electronic, rubber, plastics, food and beverage, wood and also textile. With its steadfast commitment and pride to manufacture products for worldwide customers with quality excellence and finish, Yew Lee Industrial Brush Sdn Bhd is always doing the best to keep abreast and succeed in the competitive economy.
1.3 Problem Statement
4
1.4 Objective of Project
The objectives of the project are:
I. To understand production processes in case company.
II. To analyze the production performance using work measurement by apply time study technique.
III. To propose the productivity improvement techniques to improve the company production.
1.5 Scope
The project is covered on the productivity performance improvement of one of the assembly lines in Yew Lee Industrial Brush Sdn Bhd which located at Batu Berendam, Malacca. Since the company manufactures various types of product, the project would only select on one product family. The family consists of products which are the most profitable product and highest monthly demand. This project will focused primarily on the improvement of the productivity performance in term of the processing time of the assembly line in the company. The work study techniques will be used to analyze the processes. The processes time in assembly line will be recorded by using stopwatch time study technique. Thus, the productivity improvement tools such as time study sheet, flow process chart, production takt time calculation and etc. will be proposed into the project. Other aspects such as production planning, scheduling and quality performance will not be covered in the project.
1.6 Potential Benefit of Study
5
6
CHAPTER 2
LITERATURE REVIEW
For chapter 2, it consists of the literature review on productivity, productivity performance, productivity improvement, work study, stopwatch time study technique and productivity improvement tools. The primary objective of this review is aim for searching the current status on productivity performance and productivity improvement in industry. Furthermore, this chapter will narrow the topics into the flow process chart, measurement technique using stopwatch time study method and productivity improvement techniques.
2.1 Introduction
7
out the work. Thus, the bottleneck of the processes can be identified as well as the productivity improvement tools could be carried out.
2.2 Productivity
The concept of productivity generally is defined as the relation between output and input, have been available for over two centuries and applied in many different type of industry. In figure 2.1 illustrate management function of an organization or industry. In industrial engineering, productivity is generally defined as the relation of output (i.e. produced goods) to input (i.e. consumed resources) in the manufacturing transformation process (Sumanth, 1994). Productivity is one of the most productivity is one of the basic variables governing economic production activities, perhaps the most important one. However, at the same time as productivity is seen as one of the most vital factors affecting a manufacturing company’s competitiveness, researchers argue that productivity is often relegated to second rank, and neglected or ignored by those who influence production processes (Singh et al., 2000).
8 • Labor productivity
• Capital productivity • Material productivity • Energy productivity
Table 2.1 shows a number of these variations, created from examining the term from different perspectives (Thomas and Baron, 1994). According to Bernolak (1997) provides a useful verbal explanation of productivity is related to manufacturing. Productivity means how much and how well we produce from the resources used. If
we produce more or better goods from the same resources, we increase productivity.
Or if we produce the same goods from lesser resources, we also increase
productivity. By “resources”, we mean all human and physical resources, i.e. the
people who produce the goods or provide the services, and the assets with which the
people can produce the goods or provide the services. The resources that people use
include the land and buildings, fixed and moving machines and equipment, tools, raw
9
Figure 2.1: Role of management in coordinating the resources of an organization (George Kanawaty,
[image:24.595.111.533.68.587.2]