Published By:
Abstract: Skeletal Bone is world-wide used to standard growth for prediction and assessment for children in endocrinology. A survey of the various papers and found these two methods used for BAA are GPs and TW2 (Greulich Pyle and Tanner Whitehouse) methods. Radiograph bone of the patient matched with SR (Standard Radiographs) using Graphics and consequences, determined in GP technique, whereas in TW2 technique scoring method is used for assessment for BA. The clinical practice depends on the level of maturity for 20*20 features including the features based on Epiphysis, Diaphysis and Metaphysis in radius features, Ulna, 1st and 3rd fingers and the carpal Bones, so it is difficult and time-consuming. The major problems are time-consuming to assess the bone using clinical methods and scanning phase challenging to predict the X-ray images. The research work has implemented a novel method using evolutionary support vector machine method to assess the bone age based on hand, wrist X-ray images, and resolve the issues in existing processes. To develop a filtration and optimized feature vector extraction and selection method to smooth the hand wrist X-ray images. To implement in-depth learning approach using ESVM to classify the assessment rate based on the X-ray Bone Images. After that evaluation of the performance metrics such as error rate, and Accuracy Rate and compared with the various methods. In the proposed work’s conclusion has accurately achieved value is 98.7% and existing method performance in 1-year assessment 98%, and 2 years 97.5 %.
Index Terms: Bone Age Assessment, Evolutionary Support Vector Machine, GP and TW2 Method, and Hand Wrist X-ray Images.
I. INTRODUCTION
Bone age assessment is essential in the evaluation of the endocrine conditions and the estimation of the mature person’s height during diagnosis of hormones [1]. The radiographic investigation is a simple and less costly technique for the assessment of bone age [2]. Bone age assessment is achieved utilizing different body parts like a hand, knee, and pelvis point. Bone age assessment is used to recognize the growth rate and management of endocrine disorders and pediatric syndromes [3] [4]. Over the past few years, recognition of maturity of bone depends on the evaluated value of the hand and wrist bone utilizing GP atlas. Along with digital imaging, various observations have made for the development of an image processing method that
Revised Manuscript Received on July 04, 2019.
Shakiv Pandit, Department of Computer Science & Engineering, Chandigarh Engineering College, CGC, Landran, India.
Dr. Sumit Kaur, Department of Computer Science & Engineering, Chandigarh Engineering College, CGC, Landran, India.
Ms. Lofty Saini, Department of Computer Science & Engineering, Chandigarh Engineering College, CGC, Landran, India.
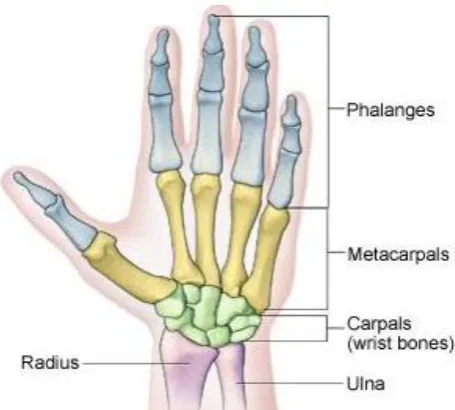
[image:1.595.317.545.378.583.2]leads to the extraction of the characteristics of ossification in bone in hand bone assessment [5]. Bone age assessment can determine through two techniques: - Tanner white house (TW) technique and Greulich Pyle (GP) method [6]. In Tanner white house technique, it depends on the growth rate of the 20 regions of interest (ROI), that have epiphysis, metaphysics, and diaphysis in the radius, ulna, and carpal bones. The Greulich Pyle method is another technique that acquires novel digital atlas with an oriented picture of the left hand of a child or teenager. Hence, the independent technique depends on the similarity of hand radiograph, along with Greulich Pyle (GR) atlas [7] [8].
Fig. 1: Hand and Wrist bone
During the development stage, the size and the pattern of skeleton bone alters, and variance among the consigned bone of the child and chronological age may cause a problem in the growth of bone [9] [10]. Though there are many techniques developed for the assessment of bone age. Initially, Medical expert utilizes X-ray pictures of left-hand wrist bone for the identification of bone age, as shown in figure 1.
BAA depends on the recognition of ossification centre in carpal bone, and epiphysis of bone comprised of distance, middle with radius and ulna.
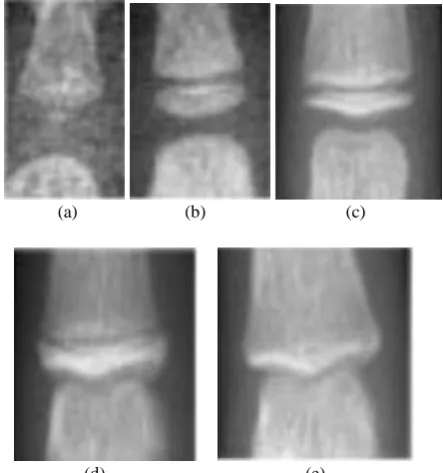
Epiphysis mainly takes place after the birth time in fig 2(a). With the growth in age, there
Automated Edge-based Segmentation and
Evolutionary-SVM Algorithm of Fingertips
Bones for Radiographs
may be a diffusion of bone in each position in fig 2(b). The spread remains when boundaries of metaphysis achieved in Fig 2 (c), band among the shaft and ossification center eliminate in fig 2(d) unless that removes, in fig 2(e), epiphysis and metaphysis penetrate in adult skeleton bone.
(a) (b) (c)
(d) (e)
Fig. 2: Ossification Centre at various stages of growth [11].
In the existing approach, automated bone age assessment using an in-depth learning approach by the distribution of region of interest (ROI). The testing process of female and male investigation radiographs done for bone age assessment. In this research, the occlusion method used for the extraction
of feature to recognize bone age assessment. In the proposed
way, new Evolutionary Support Vector Machine Method used for detection of bone age assessment using hand Wrist X-ray Images. The selection technique used to extract the features through filtration and optimized process to achieve clear Wrist X-ray bone Pictures. The classification of Wrist X-ray Images was done using an ESVM technique to implement the new deep learning technique. Performance evaluated using parameters such as error rate and Accuracy Rate, and comparison is made using existing methods.
Sections described as follows - Section I explained an overview of bone age assessment. Part II determined detailed study about literature survey means existing methods and types of BAA. Section III defined that the steps described the research flow chart and flowed chart enlightened about the proposed research work with Evolutionary Support Vector Machine technique. Section IV described experimental results analysis. Section V established a conclusion and future scope of a research proposal.
II. RELATEDWORK
Lee H., Tajmir, S. Lee, J., Zissen, M et al., 2017[16] proposed research on recognition of bone age assessment using deep learning method through segmentation of the region of interest (ROI). This method utilizes Image Net method with a convolutional neural network to acquire 58% and 61% exactness of testing sample pictures. During the testing process, female investigation radiographs allocated bone age
assessment is 91% in one year and 98% in two years. Male investigation radiographs owed bone age assessment is 95% in one year and 99% in two years. Utilizing an internal occlusion technique, build a map to extract the features to identify bone age assessment. In this research, automatic bone assessment was used as a clinical approach to determine
better accuracy and efficiency.Choi, J. A, and Kim, Y. C.2018
[17] specified bone age using capital hamate planimetry (CH)
and comparable with Greulich Pyle technique. In this research investigated about 391 children from age 1 to 180 months. Two experts determined the space of the capitate and hamate with plain radiographs. Two medical experts acquire CH and GP technique in109 children. Experiment analysis had done to assess relationships among chronological age and measurement of capital hamate planimetry. It determined that the accuracy and precision rate of CH method was more significant than the GP technique. So, concluded CH technique as the most consistent technique for assessment of
bone age. Koitka, S and Demircioglu A et al., 2018 [18]
researched about already trained network that was used to implement efficient recognizer of ossification space in
pediatric X-ray pictures of hand bone. In this research, authentication was done using 89 radiographic through a data set. The impact of the size of data on the already defined network, a grouping of samples was acquired to trained information and repetition take place. Also, a comparison made by comparing the implication of a system by a specialist in radiology.
On the other hand, ossification region acquires maximum information for the production of exact output — the preliminary analysis made with performance metrics like F-score with maximum value.Son, S. J., Song, Y and Kim, N 2019 [19] implemented an automated bone age assessment using Tanner white house 3 (TW3) technique, initiate
positioning of epiphysis–metaphysis development area
present in various 13 bones and estimates bone age at the final stage. Exact adjustments were made using convolutional neural network by enhancing dataset of 3300 x-ray pictures. Preliminary analysis was done based on the accuracy rate of the growth rate of skeleton bone with the region of interest at 80% and 98%.
III. PROPOSEDWORK
[image:2.595.55.277.112.349.2]Published By: Fig. 3: Proposed Flow Chart
Filtration image generates the histogram based on correlation score. It used for continuous data, where the bins represent a range of information, while a bar graph or chart is a plot of categorical variables. The edge-based segmentation process is a digital image processing method for searching the boundaries of objects within images. It mechanisms by detecting discontinuities in brightness and edge detection used for segmentation and extraction of the data in the field as IP (Image Processing). After that segmentation, extract the feature using the PCA algorithm. Feature values and vectors are unique properties in the X-Ray bone images save in
databases. Novel approach implements to classify the age assess and improve the performance metrics. To evaluate and compare the performance metrics with actual work.
The design process is defined below: 1. Data Collection
2. Image Uploading 3. Pre-processing Phases 4. Feature Extraction
5. A different approach (E-SVM classification). 6. Calculate Performance Metrics.
7.
ComparisonIV. EXPERIMENTALANALYSIS
A. MURA Dataset Description (X-Ray Images)
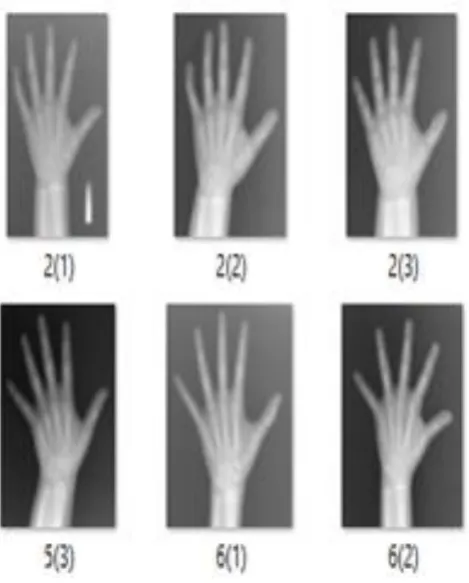
[image:3.595.306.541.324.616.2]Dataset can lead to significant developments in Medical Imagining Technology, which can assess at the bone radio logistic images. "Mura" is the largest public radiographic image database.
Fig. 4: Hand Wrist X-Ray Images
B. Result Discussion
In this research, an experiment designed on MATLAB 2016a tool. Bone Assessment was depending on the Graphical User Interface (GUI) framework, and classification was depending on E-SVM machine learning method. Training Phase used Evolutionary optimally and reduced the various classification methods. It has multiple
different network performances of assessing the accuracy and selected the fit value one.
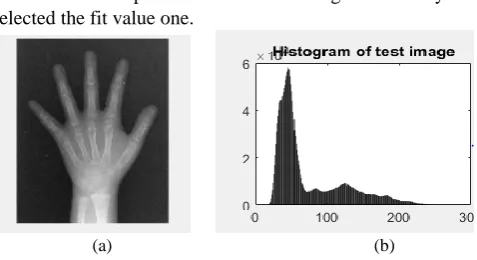
(a) (b) Fig. 5: (a) Upload X-ray Images (b) Histogram Image
Figure 5 (a) Upload the test image from the test database. It defined that the training dataset image uploading from the dataset from the folder. To click the dataset folder and trained pictures based on the proposed algorithm. Figure 5(b) defines the image histogram is a kind of histogram that performs as a graphical re-presentation of separation in DI (Digital Image). It establishes the figure plot the number of image pixels for an individual of each value. By showing at the image histogram for a specific image, a viewer will be able to review the division at a glance.
[image:4.595.51.290.60.190.2](a) (b) (c) Fig. 6: Data Pre-processing Phase (a) Blurred Image (b)
Smooth Image and (c) Edge Detection Image
Figure 6 (a) shows to identify interference in the real image. In this distortion occur in the image using SALT and PEPPER. It is a type of distortion sometimes seen on pictures. It is known as impulse distortion. In this noise can be caused by sudden and sharp buried in the image signal. It shows as a sparsely occurring black and white image pixels. An efficient blurred image reduction method for this type of blurred image is a filter used. Figure 6 (b) define in this technique is a nonlinear image smoothness technique, set utilized to optimize the noise from an image or signal. Noise removal is a kind of data pre-processing steps to improve the performance of later DIP (Digital Image Processing). Filtration method is a worldwide used in image processing since, under certain situations, it conserves edges while optimizing noise also having application in IP. Figure 6 (c) It shows the edge detection evaluate the regions of the row and column wise in the research work.
Feature extraction using PCA method. The Principal Component Analysis (PCA) method used for the feature extraction process. The covariance matrix used on the normalized data describes the correlation of each vector to the vector space. In PCA Algorithm, Eigenvectors based on Eigen Values of the data. The PCA method established for the
extraction of the data. This method has essential features of eight features.
SVM method to classify the unique properties of the feature set based on feature extraction. In this selection, the way is to calculate the unique features, and the range of the fitness function found and evaluates the performance and identifies the bone-based assessment in X-Ray images. In proposed method has implemented to improve the accuracy rate and reduce the error rate and main motive in this work to assess the X-ray Image as well as improve the recognition rate.
Right-hand wrist X-ray images feature classify and calculate the distance and assess the bone images. If feature distance similar training set and testing set, then matching/ assessment process has completed, otherwise false continue assessment failure occur means distance not matched in the X-ray Images. The performance metrics in proposed work. Performance Metrics are:
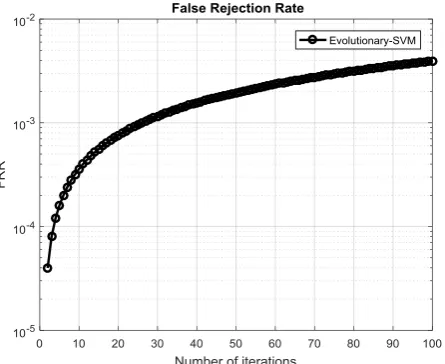
(i)The accuracy Rate value is 98.7%. (ii) The error Rate value is 0.0050. (iii) FRR value is 0.0040.
[image:4.595.313.543.224.645.2](iv) And Far value is 0.0090.
Fig. 7: Error Rate in Evolutionary-SVM
[image:4.595.312.544.296.494.2] [image:4.595.47.289.351.488.2] [image:4.595.318.539.522.690.2]Published By: Fig. 9: False Rejection Rate in Evolutionary-SVM
[image:5.595.60.283.55.237.2]The picture shows that the performance of the proposed algorithm. In this work, calculate performance metrics (7) error rate means training error and testing error calculated is equal to the sum is also known as the mean square error rate. (8) False Acceptance rate and (9) False Rejection Rate means acceptable wrong data in less format and reject the incorrect data is high as compared to FAR.
Fig. 10: Accuracy rate in Evolutionary SVM
Figure 10 defines that the image quality based on parameters based accuracy rate is high as compared to the other settings.
Fig. 11. Comparison – Accuracy Rate
Figure 11 defines the comparison based on the accuracy rate with E-SVM. In the proposed method using in BAA to improve the parameter and decreases the error rate, FAR and FRR rate. Here, we studied the various process and analyses the performance metric performance based on deep learning approaches. After that found the accuracy rate already improved with deep learning method, but quality does not consider in the bone assessment. In recent work has implemented the novel algorithm to measure the image quality parameter based on the error rate.
Table I: Comparative Study with Existing Work
Parameters Accuracy
Rate EA-SVM
Accuracy – 1year
Accuracy – 2years
Precision – Correct
Accuracy Rate (%)
98.7 98 90.39 57.32
Table I defines the comparison between EA-SVM with existing methods. In the proposed algorithm, the accuracy value is 98.7%, and the current approach accuracy rate is 98 percent.
V. CONCLUSION&FUTURESCOPE
BAA hand, wrist image is an investigation by pediatrics and by a radiologist for recognizing the divergence between age skeleton of the child (age of the bones) and consecutive period (age of birth). Bone age assessment is a method of the indication of the skeleton age and maturity of the bones of an individual. Bone age differentiated from the following features based on the age of an individual. Pediatricians and endocrinologists determine bone age for diagnosis of various diseases.
Surveyed the lots of papers in BAA and found significant issues to assess the bone images. (i) Time-consuming Process to find the assessment at Bone X-ray Images (ii) Accuracy rate is less and Error rate maximum. The proposed method has designed a novel approach Evolutionary Support Vector Machine implemented in the problem of automation bone age assessment. ESVM used
[image:5.595.58.279.368.546.2]20*20 x-ray images.
Proposed work, extract the features of x-ray images done through principal component analysis in the proposed method. Bone age assessment is analyzed from the UCI knowledge depository site and studied different bone age assessment method. The feature vector chose and extracted from hand, wrist x-ray images through filtration and optimization method. Overall performance analyzed based on true positive, true negative, false positive, false negative that determine specificity, sensitivity, and accuracy level. After that evaluation of the performance metrics such as error rate value is 0.0050, and Accuracy Rate achieved 98.7 % and compared with the accuracy rate according to the year and month 90%.
In future scope, can implement cryptography methods to improve the security of the assessment X-ray images and reduce the complexity factor. The second option will design a new clinical approach to find the x-ray image can then calculate the feature set automatically and Deep learning method based easy to assess the Hand wrist X-ray Images.
REFERENCES
1. Thangam, P., Mahendiran, T. V., & Thanushkodi, K, “Skeletal Bone Age Assessment-Research Directions”, Journal of Engineering Science & Technology Review, vol. 5(1), 2012.
2. Iglovikov, V. I., Rakhlin, A., Kalinin, A. A., & Shvets, A. A, “Paediatric Bone age assessment using deep convolutional neural networks”, In Deep Learning in Medical Image Analysis and Multimodal Learning for Clinical Decision Support. Springer, Cham, 2018, pp. 300-308.
3. Choi, J. A., Kim, Y. C., Min, S. J., & Khil, E. K, “A simple method for bone age assessment: the capitohamate planimetry”, European radiology, vol. 28(6) , 2018, pp. 2299-2307.
4. B. Smith, “An approach to graphs of linear forms (Unpublished work style),” unpublished.
5. Pietka, E., Gertych, A., Pospiech, S., Cao, F., Huang, H. K., & Gilsanz, V, “Computer-assisted bone age assessment: Image preprocessing and epiphyseal/metaphyseal ROI extraction”, IEEE transactions on medical imaging, vol. 20(8), 2001, pp. 715-729.
6. Tristán-Vega, A., & Arribas, J. I, “A radius and ulna TW3 bone age assessment system”, IEEE Transactions on Biomedical Engineering, vol. 55(5), 2008, pp. 1463-1476.
7. Yuh, Y. S., Liu, C. C., Chang, J. D., & Yu, S. S, “Later stage bone age assessment on hand radiographs”, In 2012 7th IEEE Conference on Industrial Electronics and Applications (ICIEA). IEEE, 2012, pp. 1329-1332.
8. Hsieh, C. W., Jong, T. L., & Yang, C. S, “Development of the cloud platform for bone age assessment based on tanner and whitehouse method”, In 2013 International Conference on Machine Learning and Cybernetics IEEE, vol. 3, 2013, pp. 1185-1188.
9. Son, S. J., Song, Y., Kim, N., Do, Y., Kwak, N., Lee, M. S., & Lee, B. D, “TW3-Based Fully Automated Bone Age Assessment System Using Deep Neural Networks”, IEEE Access, vol. 7, 2019, pp. 33346-33358.
10. Tristán-Vega, A., & Arribas, J. I, “A radius and ulna TW3 bone age assessment system”, IEEE Transactions on Biomedical Engineering, vol. 55(5), 2008, pp. 1463-1476.
11. Thangam, P., Saravanan, R., & Thanushkodi, K, “Robust techniques for automated Bone Age Assessment”, In 2013 International Conference on Current Trends in Engineering and Technology (ICCTET) IEEE, 2013, pp. 92-94
12. Pietka, E., Gertych, A., Pospiech, S., Cao, F., Huang, H. K., & Gilsanz, V, “Computer-assisted bone age assessment: Image preprocessing and epiphyseal/metaphyseal ROI extraction”, IEEE transactions on medical imaging, vol. 20(8), 2001, pp. 715-729.
13. Mora, S., Boechat, M. I., Pietka, E., Huang, H. K., & Gilsanz, V, “Skeletal age determinations in children of European and African descent: applicability of the Greulich and Pyle standards”,International Pediatric Research Foundation, vol. 50(5), 2001, pp. 624.
14. Mansourvar, M., Asemi, A., Raj, R. G., Kareem, S. A., Antony, C. D., Idris, N., & Baba, M. S, “A fuzzy inference system for skeletal age
assessment in living individual”, International Journal of Fuzzy Systems, vol. 19(3), 2017, pp. 838-848.
15. Schulze, P. J., & Buurman, R, “Absence of the posterior arch of the atlas”, American Journal of Roentgenology, vol. 134(1), 1980, pp. 178-180.
16. Ohalloran, R. L., & Lundy, J. K, “Age and ossification of the hyoid bone: forensic implications”, Journal of Forensic Science, vol. 32(6), 1987, pp. 1655-1659.
17. Lee, H., Tajmir, S., Lee, J., Zissen, M., Yeshiwas, B. A., Alkasab, T. K., “Fully automated deep learning system for bone age assessment”, Journal of digital imaging, vol. 30(4), 2017, pp. 427-441.
18. Choi, J. A., Kim, Y. C., Min, S. J., & Khil, E. K, “A simple method for bone age assessment: the capitohamate planimetry”, European radiology, vol. 28(6), 2018, pp. 2299-2307.
19. Koitka, S., Demircioglu, A., Kim, M. S., Friedrich, C. M., & Nensa, F, “Ossification area localization in pediatric hand radiographs using deep neural networks for object detection”, PloS one, vol. 13(11), 2018.
20. Son, S. J., Song, Y., Kim, N., Do, Y., Kwak, N., Lee, M. S., & Lee, B. D, “TW3-Based Fully Automated Bone Age Assessment System Using Deep Neural Networks”, IEEE Access, vol. 7, 2019, pp. 33346-33358.
AUTHORSPROFILE
Shakiv Pandit is a student of department of Computer Science and Engineering at Chandigarh Engineering College, CEC, Landran, India. His area of research is digital image processing.
Dr. Sumit Kaur is an Assistant Professor in the department of Computer Science and Engineering at Chandigarh Engineering College, CEC, Landran, India. She has teaching experience of about 8.5 years. Her area of research is digital image processing and soft computing.