Int. J. Electrochem. Sci., 11 (2016) 1172 - 1183
International Journal of
ELECTROCHEMICAL
SCIENCE
www.electrochemsci.org
Electrolysis Conditions Optimization of 4-Chlorophenol
Degradation with Pd/graphene Gas-diffusion Electrode by
Response Surface Methodology
Fan Wang1, Wenzhi Qi1, Shaolei Liu1, Hui Wang1,*, and Zhaoyong Bian2,**
1
College of Environmental Science and Engineering, Beijing Forestry University, Beijing 100083, China
2
College of Water Sciences, Beijing Normal University, Beijing 100875, China *
E-mail: [email protected], [email protected]
Received: 4 October 2015 / Accepted: 17 October 2015 / Published: 1 January 2016
In order to find the best electrolysis conditions for 4-Chlorophenol degradation, adopted response surface methodology (RSM) and central composite design (CCD) to investigate the current density, electrolyte concentration, initial pH and reaction time. A basic quadratic equation for the degradation efficiency of 4-chlorophenol was expressed as a function of individual variables. The results indicated that the linear effects and the quadratic effects of the individual variables (R2 reached 0.8062 and 0.8230 and was close to 1) were statistically significant. The model provided the optimized conditions as follows: the initial pH was 7.00, electrolyte (Na2SO4) concentration was 0.02 mol/L, the current density was 23 mA/cm2, and the reaction time was 120 min. The degradation efficiency of the cathodic compartment was more than 95.4%, while anodic compartment’s degradation efficiency was 91.1%. Ultimately, 4-chlorophenol was efficiently degraded under the synergistic effect of reduction and oxidation in the present system.
Keywords: 4-chlorophenol, Pd/graphene gas-diffusion cathodes, response surface methodology, degradation efficiency
1. INTRODUCTION
due to their high toxicity, recalcitrance, bioaccumulation and persistence in the environment[3, 4]. Therefore, it is important to develop an effective method to degrade CPs.
Due to electrochemical methods have advantages such as compatible to environment, ease of control, and amenability to automation and high efficiency, they have attracted significant attention in the wastewater treatment field [5]. In recent year, indirect electro-oxidation methods have been used for wastewater treatment because it can produce HO· which has strong oxidative. Carbon materials such as carbon/polytetrafluoroethylene [6], graphite [7, 8], carbon felt [9, 10], reticulated vitreous carbon [11, 12] and graphene [13, 14] are adopted as electrode materials for the electrochemical production of HO· on the cathode. However, there will form many chlorinated aliphatic intermediates during the oxidation process when the aromatic rings of chlorinated organic pollutants are opened. Therefore, this paper uses a synergistic effect of electrochemical reduction and oxidation to decrease intermediates toxicity. However, the best electrolysis conditions are not easy to determine.
When “one at a time” variation of the treatment variables is used to obtain the best degradation condition of wastewater treatments, there are two hypotheses in this method. One is that every parameter do not interact each other and the other is that the response value is only decided by the single varied parameter. However, the response variable of wastewater treatment is determined by the different variables and their interaction of each other [15, 16]. Response surface methodology (RSM), an effective statistical techniques to optimize the desired response affected by many factors and the interactions, can be used to quantify the data from the appropriate experimental design by evaluating multiple parameters and the interaction between them and at the same time, it can save time and labor force [17, 18]. Central composite design (CCD), an experimental design method in RSM, was introduced by Box and Wilson in 1951 as an alternative to full-level factorial design [19] to fit a model by the least squares technique [20]. With CCD, more information can be obtained from fewer experiments, and the interactions among the factors can be revealed from the data [21].
Organic synthesized diaphragm, DSA anode (Ti/IrO2/RuO2) and self-made Pd/graphene gas-diffusion cathode were used to construct an electrochemical degradation device for the degradation of the wastewater containing 4-chlorophenol. Using RSM analyzed the best electrolysis conditions determined by current density, electrolyte concentration, initial pH and reaction time.
2. MATERIALS AND METHODS
2.1. Preparation of Pd/graphene gas-diffusion cathodes
result [22]. The Pd/graphene gas-diffusion cathodes were prepared according to the reported procedure [23].
2.2. Procedures
Electrolysis was conducted in a terylene diaphragm cell of 100 mL, as reported by Wang [24]. The anode was a Ti/IrO2/RuO2 (Wuhan Kaida Technology Engineering Co., Ltd) net of 16 cm2. The cathode was a Pd/graphene gas-diffusion electrode of 16 cm2. A laboratory direct current power supplied with current-voltage monitor (GD1791 Guodian Ya Guang Power Technology (BJ) co., Ltd) was employed to provide the electric power. The synthetic wastewater was used. The current density, the concentration of supporting electrolyte (Na2SO4), the initial pH and the reaction time were determined by CCD. Before the experiment started, hydrogen gas was fed to the system for 5 min to insure dissolved gas saturation, and the rate of the feed gas was 25 mL/s. Hydrogen gas was fed into the gas compartment during the 0-60 min electrolysis. After 60 min of electrolysis, air was fed into the gas compartment. The electrolysis proceeded at room temperature. The high performance liquid chromatography (HPLC, Shimadzu, Japan) was used to determine 4-CP through the means of comparison of the retention times to it standard compounds. The samples (20 μL) were passed through 0.45 μm PTFE filters before given injection into the HPLC. The Znertisl ODS-SP C18 column (250 mm × 4.6 mm, 5 μm) would carry out the separation when flow rate was at 1.0 mL/min and temperature was 25°C. The determination of 4-CP was performed using HPLC with setting UV-detector at 280 nm and containing mobile phase methanol/water (v/v) 80/20.
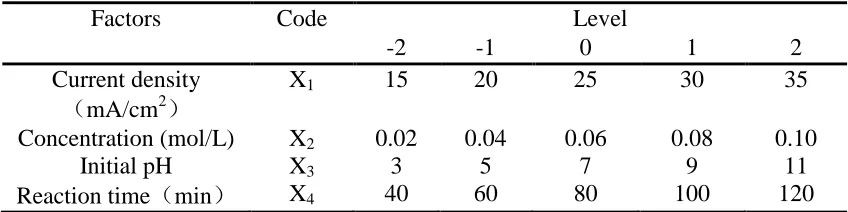
[image:3.596.86.510.514.620.2]2.3. Experimental design
Table 1. Range of different factors investigated with Central Composite Design
Factors Code Level
-2 -1 0 1 2
Current density
(mA/cm2)
X1 15 20 25 30 35
Concentration (mol/L) X2 0.02 0.04 0.06 0.08 0.10
Initial pH X3 3 5 7 9 11
Reaction time(min) X4 40 60 80 100 120
y=β0+β1x1+β2x2+β3x3+β4x4+β11 +β22 +β33 +β44 +β12x1x2+β13x1x3+β14x1x4+β23x2x3+β24x2x
4+β34x3x4 (1)
Where x1, x2, x3 and x4 are the variables for the current density, electrolyte concentration, initial
pH and reaction time, respectively. y represents the degradation efficiency of 4-chlorophenol. The predicted response (y) was therefore correlated to the set of regression coefficients (β): the intercept (β0), linear (β1, β2, β3, β4), interaction (β12, β13, β14, β23, β24, β34) and quadratic coefficients (β11, β22, β33,
β44). As a result, the total number of conditions in this design was calculated as 30 (=2k+2k+6), where
k is the number of factors (k=4). Design Expert software was used to analyze the experimental data and optimize the experimental conditions.
3. RESULTS AND DISCUSSION
3.1. Central composite design and data analysis
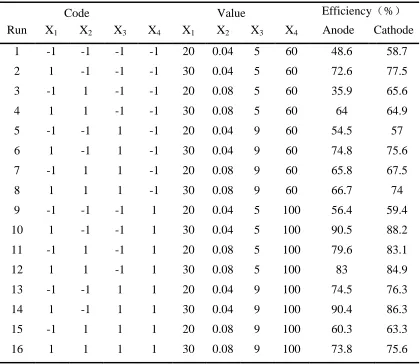
[image:4.596.89.509.408.772.2]The complete CCD consisted of 30 and the responses of the degradation efficiency were synthesized in Table 2.
Table 2. Response values of Central Composite Design
Code Value Efficiency(%)
Run X1 X2 X3 X4 X1 X2 X3 X4 Anode Cathode
1 -1 -1 -1 -1 20 0.04 5 60 48.6 58.7
2 1 -1 -1 -1 30 0.04 5 60 72.6 77.5
3 -1 1 -1 -1 20 0.08 5 60 35.9 65.6
4 1 1 -1 -1 30 0.08 5 60 64 64.9
5 -1 -1 1 -1 20 0.04 9 60 54.5 57
6 1 -1 1 -1 30 0.04 9 60 74.8 75.6
7 -1 1 1 -1 20 0.08 9 60 65.8 67.5
8 1 1 1 -1 30 0.08 9 60 66.7 74
9 -1 -1 -1 1 20 0.04 5 100 56.4 59.4
10 1 -1 -1 1 30 0.04 5 100 90.5 88.2
11 -1 1 -1 1 20 0.08 5 100 79.6 83.1
12 1 1 -1 1 30 0.08 5 100 83 84.9
13 -1 -1 1 1 20 0.04 9 100 74.5 76.3
14 1 -1 1 1 30 0.04 9 100 90.4 86.3
15 -1 1 1 1 20 0.08 9 100 60.3 63.3
17 -2 0 0 0 15 0.06 7 80 26.8 30.9
18 2 0 0 0 35 0.06 7 80 52.6 59.6
19 0 -2 0 0 25 0.02 7 80 86.7 89.3
20 0 2 0 0 25 0.10 7 80 66.7 77.8
21 0 0 -2 0 25 0.06 3 80 72.2 77.8
22 0 0 2 0 25 0.06 11 80 44 59
23 0 0 0 -2 25 0.06 7 40 43.1 46.3
24 0 0 0 2 25 0.06 7 120 81.9 83.8
25 0 0 0 0 25 0.06 7 80 84.4 82.3
26 0 0 0 0 25 0.06 7 80 84.4 82.3
27 0 0 0 0 25 0.06 7 80 84.4 82.3
28 0 0 0 0 25 0.06 7 80 84.4 82.3
29 0 0 0 0 25 0.06 7 80 84.4 82.3
30 0 0 0 0 25 0.06 7 80 84.4 82.3
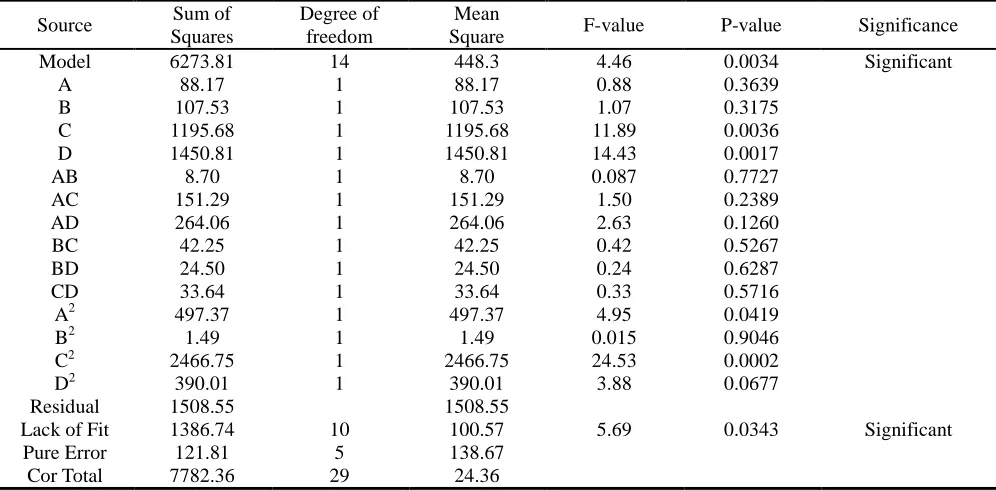
[image:5.596.92.505.68.352.2]Further, the analyses of variance (ANOVA) of the quadratic regression model of the degradation efficiency in the anodic compartment and in the cathodic compartment were shown in Table 3 and Table 4.
Table 3. ANOVA in the anodic compartment
Source Sum of
Squares
Degree of freedom
Mean
Square F-value P-value Significance
Model 6273.81 14 448.3 4.46 0.0034 Significant
A 88.17 1 88.17 0.88 0.3639
B 107.53 1 107.53 1.07 0.3175
C 1195.68 1 1195.68 11.89 0.0036
D 1450.81 1 1450.81 14.43 0.0017
AB 8.70 1 8.70 0.087 0.7727
AC 151.29 1 151.29 1.50 0.2389
AD 264.06 1 264.06 2.63 0.1260
BC 42.25 1 42.25 0.42 0.5267
BD 24.50 1 24.50 0.24 0.6287
CD 33.64 1 33.64 0.33 0.5716
A2 497.37 1 497.37 4.95 0.0419
B2 1.49 1 1.49 0.015 0.9046
C2 2466.75 1 2466.75 24.53 0.0002
D2 390.01 1 390.01 3.88 0.0677
Residual 1508.55 1508.55
Lack of Fit 1386.74 10 100.57 5.69 0.0343 Significant
Pure Error 121.81 5 138.67
[image:5.596.50.548.486.731.2]
Table 2 and Table 3 shown that the results were fitted with one basic quadratic equation. The date of regression coefficients were computed, the response variables and the test variables in the anodic compartment were related by quadratic equation 2:
y1=84.40+7.99x1-3.05x2-1.09x3+8.47x4-9.68 -0.43 -5.08 -3.98 -3.02x1x2-2.44x1x3
-0.40x1x4-1.37x2x3+0.19x2x4-3.20x3x4 (2)
Where x1, x2, x3 and x4 are the variables for the current density, electrolyte concentration, initial
[image:6.596.42.555.414.709.2]pH and reaction time, respectively. y1 represents the degradation efficiency of 4-chlorophenol in the anodic compartment. The ANOVA analysis by multiple regression using P-value was performed for determination of the constants, coefficients of linear, quadratic and interaction effects. The P-value greater than 0.1 indicates that the model terms were not significant, while this value less than 0.05 indicated significant model terms. The small P-value (0.0034) and large F-value (4.46) implied that the quadratic model was significant [29, 30]. The lack-of-fit F-value of 5.69 implied that it was significant. Compare with conclusions of other studies, the adequate precision measures of the signal to noise ratio and a value greater than 4 was desirable [31, 32]. The ratio of 8.251 indicated an adequate signal. Hence, the model can be used to navigate the design space. The ANOVA indicated that the linear coefficients, quadratic coefficients and interaction coefficient were significant, with small p-values. The equation regression coefficient value indicated that this equation was valid.
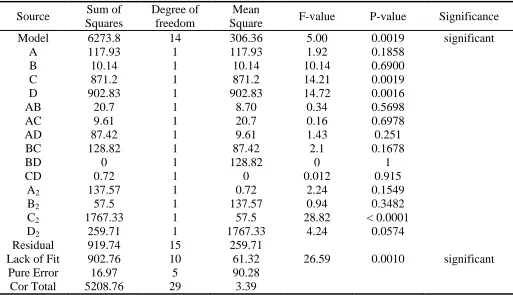
Table 4. ANOVA in the cathodic compartment
Source Sum of Squares
Degree of freedom
Mean
Square F-value P-value Significance
Model 6273.8 14 306.36 5.00 0.0019 significant
A 117.93 1 117.93 1.92 0.1858
B 10.14 1 10.14 10.14 0.6900
C 871.2 1 871.2 14.21 0.0019
D 902.83 1 902.83 14.72 0.0016
AB 20.7 1 8.70 0.34 0.5698
AC 9.61 1 20.7 0.16 0.6978
AD 87.42 1 9.61 1.43 0.251
BC 128.82 1 87.42 2.1 0.1678
BD 0 1 128.82 0 1
CD 0.72 1 0 0.012 0.915
A2 137.57 1 0.72 2.24 0.1549
B2 57.5 1 137.57 0.94 0.3482
C2 1767.33 1 57.5 28.82 < 0.0001
D2 259.71 1 1767.33 4.24 0.0574
Residual 919.74 15 259.71
Lack of Fit 902.76 10 61.32 26.59 0.0010 significant
Pure Error 16.97 5 90.28
Table 2 and Table 4 shown that the results were fitted with one basic quadratic equation. The date of regression coefficients were computed, the response variable and the test variables in the cathodic compartment were related by quadratic equation 3:
y2=82.30+6.40x1-0.96x2-1.85x3+6.30x4-8.13 +1.45 -2.34 -3.18 -3.52x1x2
-0.08x1x3+0.61x1x4-1.84x2x3-0.41x2x4-1.34x3x4 (3)
Where x1, x2, x3 and x4 are the current density, electrolyte concentration, initial pH, and reaction
time, respectively. y2 stands for the cathodic compartment’s degradation efficiency of 4-chlorophenol. Determination of the constants, coefficients of linear, quadratic and interaction effects were performed by the ANOVA multiple regression analysis using P-value. When P-value was greater than 0.1, it indicated the model terms were not significant. However P-value was less than 0.05, significant model terms were achieved. Based on the small P-value (0.0019) and large F-value (5.00), we concluded that the quadratic model was fit to the actual results [29, 30]. The lack-of-fit F-value of 26.59 exhibited the mode was acceptable. And the adequate precision measures for the signal to noise ratio was performed and the ratio of 9.448 was achieved. Therefore, the chosen model was suitable for the design space. The ANOVA with small P-values showed that the linear coefficients, quadratic coefficients and interaction coefficient were acceptable. And the equation could be used to predict the cathodic compartment’s degradation efficiency.
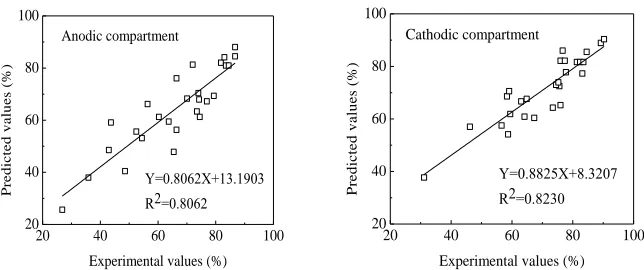
3.2. Comparison of the experimental values and the predicted values
The comparison of the experimental values and the predicted values of the degradation efficiency is shown in Figure 1.
20 40 60 80 100
20 40 60 80 100 P re d ic te d v a lu e s (% )
Experimental values (%) Anodic compartment
Y=0.8062X+13.1903 R2=0.8062
20 40 60 80 100
20 40 60 80 100 P re d ic te d v a lu e s (% )
Experimental values (%) Cathodic compartment
Y=0.8825X+8.3207 R2=0.8230
Figure 1. Comparison between the experimental and predicted values of the degradation efficiency
[image:7.596.132.454.476.611.2]
As shown in Figure 2, the standard deviation of the experimental and predicted values of 4-chlorophenol degradation efficiency was small at 7.2; the correlation coefficient was 0.8980 and had good consistency, indicating that the response surface methodology was valid.
0 10 20 30
20 40 60 80 100 D e g ra d a ti o n e ff ic ie n c y ( % ) Runs Experimental values Predicted values Anodic compartment
0 10 20 30
20 40 60 80 100 D e g ra d a ti o n e ff ic ie n c y ( % ) Runs Experimental values Predicted values Cathodic compartment
Figure 2. Comparison between the experimental and predicted values of the degradation efficiency
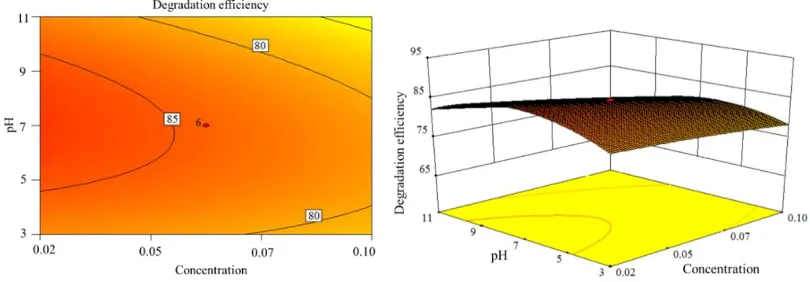
3.3. Efficiency of the initial pH and electrolyte concentration to degrade 4-chlorophenol
When the current density was 25 mA/cm2, the results of the efficiency of the initial pH and electrolyte concentration in the anodic and cathodic compartments to degrade 4-chlorophenol is shown in Figure 3.
Figure 3. Surface plots for the effect of pH and electrolyte concentration on 4-chlorophenol degradation efficiency
[image:8.596.135.449.134.257.2] [image:8.596.96.501.403.544.2]
concentration of Na2SO4 is high, the electrode surface generates a layer of salt membrane and prevented the electrode functioning normally. From the analysis, when the current density was 0.02 mol/L, the initial pH was 7.00, and the concentration of Na2SO4 was 0.02 mol/L, the efficiency of 4-chlorophenol degradation was relatively high.
3.4. Efficiency of the electrolyte concentration and current density to degrade 4-chlorophenol
When the initial pH was 7.00, the results of the efficiency of the electrolyte concentration and current density in anodic and cathodic compartments to degrade 4-chlorophenol is shown in Figure 4.
Figure 4. Surface and contour plots for the effect of the current density on the 4-chlorophenol degradation efficiency
Figure 4 shows the efficiency of the current density and electrolyte concentration to degrade 4-chlorophenol in the cathodic and anodic compartments when the initial pH was under the condition of the central value. When the current density rose, a greater number of electrons were supplied to the reaction, the reaction rate was faster and the degradation efficiency of 4-chlorophenol increased gradually in the cathodic and anodic compartments. When the current density was 23 mA/cm2, the degradation efficiency was the highest. When the current density was higher than 23 mA/cm2, the degradation efficiency decreased because side reactions significantly increased. When the electrolyte concentration was 0.02 mol/L, the degradation efficiency was the highest. From the analysis, when the initial pH was 7.00, the current density was 23 mA/cm2 and the electrolyte concentration was 0.02 mol/L, the degradation efficiency was relatively high.
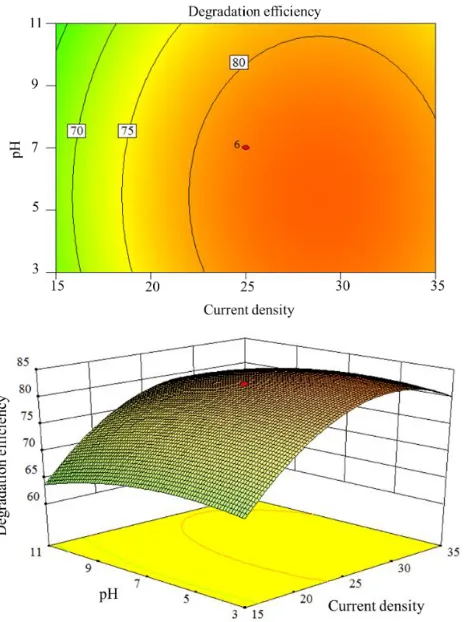
3.5. Efficiency of the initial pH and current density to degrade 4-chlorophenol
[image:9.596.91.506.250.388.2]
Figure 5. Surface and contour plots for the effect of the current density and initial pH on the 4-chlorophenol removal efficiency
Figure 5 shows the efficiency of the initial pH and current density to degrade 4-chlorophenol in the cathodic compartment when the electrolyte concentration was 0.02 mol/L. When the current density was less than 23 mA/cm2, the degradation efficiency of 4-chlorophenol was not significant, and the efficiency rose with the increasing current density. When the current density was less than 23 mA/cm2, due to the greater number of electrons supplied to the reaction, the reaction rate was faster. When the current density was 23 mA/cm2, the degradation efficiency of 4-chlorophenol was the highest. When the current density was at a fixed value, the degradation efficiency of 4-chlorophenol increased with increasing initial pH. If the concentration was 7.00 and continued to rise, the degradation efficiency decreased. From the analysis, the degradation efficiency of 4-chlorophenol was best when the current density was 23 mA/cm2 and the initial pH was 7.00.
[image:10.596.184.417.72.383.2]
4. CONCLUSIONS
RSM was applied to optimize the electrolysis conditions of 4-chlorophenol degradation. The reaction conditions such as current density, concentration of supporting electrolyte (Na2SO4), initial pH and reaction time were determined by CCD. A basic quadratic equation for the degradation efficiency of 4-chlorophenol was expressed as a function of the individual variables. The linear effects and the quadratic effects of the individual variables were statistically significant. The comparison of the experimental values and the predicted values of the degradation efficiency showed that RSM was valid and able to predict the experimental data. The obtained model gave the optimized conditions as follows: the initial pH was 7.00, electrolyte (Na2SO4) concentration was 0.02 mol/L, the current density was 23 mA/cm2, and the reaction time was 120 min. The degradation efficiency of the cathodic and anodic compartments was more than 95.4% and 91.1%, respectively.
ACKNOWLEDGMENTS
This work was supported by the Fundamental Research Funds for the Central Universities (No.TD2013-2), the National Natural Science Foundation of China (No.51278053 and 21373032), and grant-in-aid from Kochi University of Technology and China Scholarship Council.
References
1 B. Yue, Y. Zhou, J. Xu, Z. Wu, X. Zhang, Y. Zou and S. Jin, Environ. Sci. Technol.,36 (2002)
1325
2 C. H. Lin and S. K. Tseng, Chemosphere, 39 (1999) 2375
3 M. F. F. Sze and G. McKay, Chinese J. Chem. Eng., 39 (2012) 444
4 C. B. Molina, A. H. Pizarro, J. A. Casas and J. J. Rodriguez, Appl. Catal. B: Environ., 148 (2014)
330
5 C. Comninellis, Electrochim. Acta, 39 (1994) 1857
6 E. Brillas, B. Boye, I. Sirés, J. A. Garrido, R. M. Rodr gue , C. Arias and C. Comninellis,
Electrochim. Acta, 49 (2004) 4487
7 J. S. Do and C. P. Chen, J. Appl. Electrochem., 24 (1994) 936
8 J. Shim, G. Y. Kim, K. H. Yeon, S. H. Cho, J. J. Woo and S. H. Moon, Korean J.Chem. Eng., 24
(2007) 72
9 M. A. Oturan, N. Oturan, M. C. Edelahi, F. I. Podvorica and K. E. Kacemi, Chem. Eng. J., 171
(2011) 127
10 A. Dhaouadi, L. Monser and N. Adhoum, Electrochim. Acta, 55 (2009) 4473
11 C. P. D. Leon and D. Pletcher, J. Appl. Electrochem., 25 (1995) 307
12 A. Alvarez-Gallegos and D. Pletcher, Electrochim. Acta, 44 (1999) 2483
13 X. Xu, J. Chen, G. Zhang, Y. Song and F. Yang, Int. J. Electrochem. Sci., 9 (2014) 569
14 F. Xu, M. Deng, G. Li, S. Chen and L. Wang, Int. J. Electrochem. Sci., 88 (2013) 59
15 M. Ahmadi, F. Vahabzadeh, B. Bonakdarpour, E. Mofarrah and M. Mehranian, J. Hazard. Mater.,
123 (2005) 187
16 M. Bahram, S. Jahangiri, K. Farhadi and R. Hasanzadeh, Anal. Bioanal. Chem., 1 (2014) 29
17 W. Bi, M. Tian and K. H. Row, J. Chromatogr. A, 1285 (2013) 22
18 K. Yang, F. Tan, F. Wang, Y. Long and Y. Wen, Chinese J. Chem. Eng., 20 (2012) 793
19 G. E. P. Box and K. B. Wilson, Biometrics, 10 (1951) 16
21 M. Luo, Y. Guan and S. Yao, Chinese J. Chem. Eng., 21 (2013) 185
22 Z. Y. Bian, Y. Bian, H. Wang and A. Z. Ding, J. Nanosci. Nanotechno., 14 (2014) 7279
23 H. Wang, Z. Y. Bian, G. Lu, L. Pang, Z. P. Zeng and D. Z. Sun, Appl. Catal. B: Environ., 125
(2012) 449
24 H. Wang and J. L. Wang, J. Hazard. Mater., 154 (2008) 44
25 H. Wu, R. Yang, R.H. Li, C. Long, H. Yang and A. M. Li, Environ. Sci. Pollut. R., 22 (2015)
13038
26 Y. M. Gong, S. Z. Wang, H. D. Xu, Y. Guo and X. Y. Tang, Waste Manage., 43 (2015) 343
27 A. Jana, P. Bhattacharya, S. Swarnakar, S. Majumdar and S. Ghosh, Chemosphere, 138 (2015)
682
28 M. S. A. Aziz, M. Z. Abdullah, C. Y. Khor and I.A. Azid, Simul. Model. Pract. Th., 57 (2015) 45
29 M. X. He, H. Y. Li and X. Q. Mo, Ecol. Eng., 84 (2015) 362
30 R. Mohammadi, M. A. Mohammadifar, A. M. Mortazavian, M. Rouhi, J. B. Ghasemi and Z.
Delshadian. Food Chem., 190 (2016) 186
31 V. Sangeetha, V. Sivakumar, A. Sudha and K. Kannan, Int. J. Electrochem. Sci., 10 (2015) 1506
32 A. Anis, S. M. Al-Zahrani and F. A. Abd El Aleem, Int. J. Electrochem. Sci., 7 (2012) 6221