Classification of Data Collections that Feature Large
Numbers of Class Labels
Thesis submitted in accordance with the requirements of the University of Liverpool for the degree of Doctor in Philosophy by
Esra’a Ahmad Helael Alshdaifat
To my family, especially my parents and my son.
In this thesis a number of hierarchical ensemble classification approaches are proposed as
a solution to the multi-class classification problem. The central idea is that a more
effec-tive classification can be produced if a “coarse-grain” classification (directed at groups of classes) is first conducted followed by increasingly more “fine-grain” classifications.
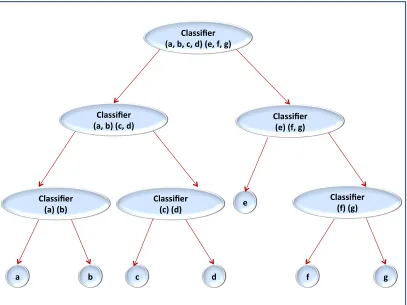
The Hierarchical ensemble classification model comprises a set of base classifiers held
within the nodes of the hierarchy (one classifier per node). Nodes near the root hold classifiers designed to discriminate between groups of class labels while the leaves hold
classifiers designed to distinguish between individual class labels. Two types of hierarchy
(structures) are considered, Binary Tree (BT) hierarchies and Directed Acyclic Graph (DAG) hierarchies. With respect to the DAG structure, two alternative DAG structures
to support the generation of the desired hierarchical ensemble classification model are considered: (i)rooted DAG, and (ii)non-rooted DAG. The main challenges are: (i) how
best to distribute class labels between nodes within the hierarchy, (ii) how to address the
“successive mis-classification” issue associated with hierarchical classification where if a mis-classication occurs early on in the process (near the root of the hierarchy) there is
no possibility of rectifying this error later on in the process, and (iii) how best to
deter-mine the starting node within thenon-rooted DAG approach. To address the first issue different techniques, based on the concepts of clustering, splitting, and combination, are
proposed. To address the second and the third issues the idea is to utilise probability
or confidence values associated with Naive Bayes and CARM classifiers respectively to dictate whether single or multiple paths should be followed at each hierarchy node, and
to select the best starting DAG node with respect to thenon-rooted DAG approach.
Keywords: Hierarchical Classification, Multi-class classification, Ensemble classifi-cation, Binary Tree (BT), Directed Acyclic Graph (DAG).
First and foremost, my deepest acknowledgment goes to my first supervisor Prof. Frans
Coenen, for his constant support, constructive criticism, patience, research ideas and
en-couragement throughout the entire PhD program. Without his supervision and constant help the successful completion of this thesis would not have been possible. Honestly, it
has been a great privilege to have worked with him. I would like to express my
apprecia-tion to my second supervisor Dr. Keith Duers for his support and encouragement during my PhD study. I am also thankful to my advisors Dr. Clare Dixon, Dr. Katie Atkinson,
and Dr. Prudence Wong for their advices and valuable comments. I would like to extend
my gratitude to the Hashemite University in Jordan for the generous financial support that has given me the opportunity to complete my PhD study. A special thanks also to
my beloved family: my mother, father, sisters, and brothers, for their prayers, support and encouragement. Last but not least, I would like to express my sincere thanks to my
husband for his support and encouragement throughout the entire PhD study.
Dedication i
Abstract ii
Acknowledgements iii
1 Introduction 1
1.1 Overview . . . 1
1.2 Motivations . . . 2
1.3 Research Question and Issues . . . 3
1.4 Research Methodology . . . 5
1.5 Evaluation Data Sets and Criteria . . . 7
1.6 Research Contributions . . . 10
1.7 Organisation of the Thesis . . . 11
1.8 Publications . . . 12
1.9 Summary . . . 13
2 Literature Review 14 2.1 Introduction . . . 14
2.2 Using “Stand-alone” Classification Algorithms to Solve Multi-class Clas-sification Problems . . . 15
2.3 Using a Collection of Binary Classifiers to Solve Multi-class Classification Problems . . . 17
2.4 Using Ensemble Classifiers to Solve Multi-class Classification Problems . . 18
Part 1: Concurrent Ensemble Methods . . . 22
Part 2: Sequential Ensemble Methods . . . 23
Part 3: Binary Tree Based Hierarchical Ensemble Methods . . . . 25
Part 4: DAG Based Hierarchical Ensemble Classification Methods 32 2.5 Comparison with Previous Work on Binary Tree Based Hierarchical En-semble Methods . . . 35
2.6 Clustering . . . 35
2.7 Overview of Statistical Tests . . . 37
2.8 Terminology . . . 38
2.9 Summary . . . 39
3 The Binary Tree Hierarchical Classification Model 41
3.3 Binary Tree Hierarchical Model Operation . . . 44
3.3.1 Single Path Strategy . . . 46
3.3.2 Multiple Path Strategy . . . 47
The Multiple Path Strategy Using CARM Classifiers at Nodes . . 48
The Multiple Path Strategy Using Naive Bayes Classifiers at Nodes 50 3.4 Experiments and Results . . . 52
3.4.1 Single Path Experiments and Results . . . 56
3.4.2 Multiple Path Experiments and Results . . . 65
Using Naive Bayesian Probability Values for Following Multiple Paths Within the Binary Tree Hierarchical Classification Model . . . 67
Using CARM Confidence Values for Following Multiple Paths Within the Binary Tree Hierarchical Classification Model . . . . 69
Comparison Between Using Probability Values and Confidence Values for Following Multiple Paths Within the Binary Tree Hierarchy . . . 72
3.4.3 Comparison Between Single Path and Multiple Path Strategies . . 73
3.4.4 Comparison Between The Binary Tree Hierarchical Classification Model and Conventional models . . . 76
3.5 Summary . . . 81
4 Rooted Directed Acyclic Graph (rooted DAG) for Generating the Hi-erarchical Classification Model 89 4.1 Introduction . . . 89
4.2 Rooted DAG Generation . . . 90
4.3 Rooted DAG Operation . . . 91
4.3.1 Single Path Strategy . . . 93
4.3.2 Multiple Path Strategy . . . 94
4.4 Experiments and results . . . 98
4.4.1 Single Path Strategy Experiments and Results . . . 100
4.4.2 Multiple Path Strategy Experiments and Results . . . 101
4.4.3 Comparison Between Single and Multiple Path Strategies . . . 106
4.4.4 Comparison Between the Rooted DAG Ensemble Classification Model and Conventional models . . . 107
4.5 Summary . . . 114
5 Directed Acyclic Graph (DAG) Structure Based Hierarchical Classifi-cation Model 116 5.1 Introduction . . . 116
5.2 Non-Rooted DAG Generation . . . 118
5.3 Non-Rooted DAG Operation . . . 120
5.3.1 Single Path Strategy . . . 120
5.3.2 Multiple Path Strategy . . . 122
5.4 Experiments and Results . . . 125
5.4.1 Single Path Experiments and Results . . . 126
5.4.2 Multiple Path Experiments and Results . . . 129
5.5 Summary . . . 139
6 The Directed Acyclic Graph (DAG) Hierarchical Classification Model with Breadth Pruning 142 6.1 Introduction . . . 142
6.2 DAG Generation with the Application of Breadth Pruning . . . 143
6.3 DAG Operation . . . 145
6.4 Experiments and Results . . . 146
6.4.1 Single Path Experiments and Results . . . 147
6.4.2 Multiple Path Experiments and Results . . . 148
6.4.3 Comparison Between Single Path and Multiple Path Strategies . . 149
6.4.4 Comparison Between Different DAG Models . . . 151
6.5 Comparison Between DAG Based Hierarchical Classification and Binary Tree Based Hierarchical Classification . . . 153
6.5.1 Comparison Between The DAG Ensemble Classification Model and Conventional models . . . 156
6.6 Summary . . . 159
7 Utilising Parallel Computing to Generate the Directed Acyclic Graph Classification Model 163 7.1 Introduction . . . 163
7.2 Overview of Parallel Computing . . . 164
7.2.1 Definition . . . 164
7.2.2 Categorisation of Parallel Architecture . . . 164
7.2.3 Parallel Programming Paradigms . . . 165
7.2.4 Parallel Programming Languages . . . 167
7.3 Utilising Parallel Processing to Generate and Operate the DAG Classifi-cation Model . . . 167
7.3.1 Assigning Each DAG Node to a Process . . . 168
7.3.2 Assigning Each DAG Level to a Process . . . 169
7.3.3 Assigning Each DAG Level to a Group of Processes . . . 171
7.4 Experiments and Results . . . 174
7.4.1 Naive Byes rooted DAG Run Time Results . . . 175
7.4.2 OVO SVM rooted DAG Results . . . 176
7.5 Summary . . . 179
8 Conclusion and Future Work 180 8.1 Summary . . . 180
8.2 Main Findings and Contributions . . . 182
8.3 Future Directions . . . 187
Bibliography 188
A Evaluation data sets 198
B AUC Computation 207
B.1 Example One (100% Accurate Classifier) . . . 208 B.2 Example Two (Highly Unbalanced Data Set and One Class Does not
Appear in the Test set) . . . 209
C Statistical Comparisons 212
C.1 Introduction . . . 212 C.2 Binary Tree Hierarchical Classification Model Statistical Evaluation . . . 212
C.2.1 Comparative Evaluation using the Binary Tree Hierarchical Clas-sification Model with the Single Path Strategy . . . 214 C.2.2 Comparative Evaluation using the Binary Tree Hierarchical
Clas-sification Model with the Multiple Path Strategy . . . 217 C.2.3 Comparison between Single and Multiple Path Strategies when
using The Binary Tree Hierarchical Classification Model . . . 221 C.3 DAG Classification Models Evaluation . . . 222
C.3.1 Comparative Evaluation using the DAG Classification Models with the Single Path Strategy . . . 223 C.3.2 Comparative Evaluation using the DAG Classification Models with
the Multiple Path Strategy . . . 223 C.3.3 Comparison between Single and Multiple Path Strategies using
the DAG Classification Models . . . 225 C.3.4 Comparison Between the Different DAG Models . . . 230 C.4 Comparison Between DAG Based Hierarchical Classification and Binary
Tree Based Hierarchical Classification . . . 231 C.5 Comparison Between the Hierarchical Classification Model and
Conven-tional Ensemble Classification Models . . . 233 C.6 Summary . . . 235
D Determining the Best Threshold Value (σ) for Following Multiple Paths
within the Binary Tree Hierarchical Classification Model 239
E Following All Possible Paths Within Rooted DAG 254
F Determining the Best Threshold Value With respect to the Rooted
DAG Classification Model 256
G Determining the Best Threshold Value With respect to the DAG
Clas-sification Model 264
H Determining the Best Threshold Values With respect to the DAG
Classification Model with Breadth Pruning 268
List of Figures
1.1 Hierarchical classification structures, techniques, strategies, and mechanisms 5
1.2 ROC curve example . . . 9
2.1 Binary Tree Hierarchy example. . . 26
2.2 Directed Binary Tree (DBT) example [72] . . . 31
2.3 Decision Directed Acyclic Graph (DDAG) example [80] . . . 33
2.4 Adaptive Directed Acyclic Graph (ADAG) example [55] . . . 34
3.1 Binary Tree Hierarchy example. . . 42
3.2 Binary Tree hierarchical classification model, (a)using a single classifier at each node and(b) using a Bagging ensemble at each node. . . 43
4.1 Rooted DAG example . . . 90
5.1 DAG example. . . 117
7.1 DAG example with parallel processing application . . . 172
C.1 Hierarchical classification structures, strategies, techniques, and mechanisms 213 C.2 Results of Friedman test used to compare the different considered data dis-tribution techniques with respect to Naive Bayes classification and the Single Path strategy . . . 215
C.3 Results of Friedman test used to compare the different considered data dis-tribution techniques with respect to Decision tree classification and Single Path strategy . . . 215
C.4 Results of Friedman test used to compare the different considered data dis-tribution techniques with respect to CARM classifier and Single Path strategy216 C.5 Results of Friedman test used to compare the different classifiers (Decision tree, Naive Bayes, and CARM) utilised to generate the Binary Tree classifi-cation model with respect tok-means data distribution technique and Single Path strategy . . . 217
C.6 Results of Friedman test used to compare the different classifiers (Decision tree, Naive Bayes, and CARM) utilised to generate the Binary Tree clas-sification model with respect to data splitting technique and Single Path strategy . . . 217
C.7 Results of Friedman test used to compare the different data distribution techniques with respect to Naive Bayes classification and the Multiple Path strategy . . . 218
C.8 Results of Friedman test used to compare the different data distribution techniques with respect to CARM classification and the Multiple Path strategy219
Multiple Path strategy . . . 220
C.10 Results of Friedman test used to compare the three alternative mechanisms to arrive at a final classification decision with respect to the Multiple Path
strategy: (i) Voting, (ii) BIP, and (iii) NAP with respect to data splitting
mechanism . . . 220 C.11 Results of Friedman test used to compare the three alternative mechanisms
to arrive at a final classification decision with respect to the Multiple Path
strategy: (i) Voting, (ii) BIP, and (iii) NAP with respect to K-means data distribution technique . . . 221
C.12 Results of Wilcoxon test used to compare the Single and Multiple Path
strategies with respect to Naive Bayes classification and the three considered data distribution techniques . . . 222
C.13 Results of Friedman test used to compare the different classifiers (Decision
tree, Naive Bayes, and CARM) with respect to the rooted DAG classification model and the Single Path strategy . . . 224
C.14 Results of Wilcoxon test used to compare the two considered classifiers with
respect to: (i) All-level and (ii) Two-level DAGs, and the Single Path strategy225 C.15 Results of Wilcoxon test used to compare Naive Bayes and CARM
classifi-cation with respect to the rooted DAG multiple path model . . . 226 C.16 Results of Wilcoxon test used to compare Naive Bayes and CARM
classifi-cation with respect to: (i) All-level, and (ii) Two-level DAG multiple path
model . . . 226 C.17 Results of Fridman test used to compare the operation of the three
alter-native mechanisms used to arrive at a final classification when using the
proposed Multiple Path strategies: (i) Voting, (ii) BIP, and (iii) NAP with respect to Naive Bayes classification and the rooted DAG approach . . . 227
C.18 Results of Wilcoxon test used to compare the Single and Multiple Path
strategies with respect to Naive Bayes classification and the rooted DAG model . . . 227
C.19 Results of Wilcoxon test used to compare the Single and Multiple Path
strategies with respect to Naive Bayes classification and the All-level DAG model . . . 228
C.20 Results of Wilcoxon test used to compare the Single and Multiple Path
strategies with respect to Naive Bayes classification and the Two-level DAG model . . . 229
C.21 Results of Wilcoxon test used to compare the Single and Multiple Path
strategies with respect to Naive Bayes classification and the Max-level DAG model . . . 229
model . . . 230
C.23 Results of Friedman test used to compare the different DAG models with respect to the Single Path strategy . . . 231
C.24 Results of Friedman test used to compare the different DAG models with
respect to the Multiple Path strategy . . . 232 C.25 Results of the Wilcoxon test used to compare the Binary Tree hierarchical
classification Model and the DAG classification model with respect to the
Single Path strategy . . . 233 C.26 Results of the Wilcoxon test used to compare the Binary Tree hierarchical
classification Model and the DAG classification model with respect to the
Multiple Path strategy . . . 234 C.27 Results of Friedman test used to compare the DAG classification model,
stand-alone Naive Bayes classification and Bagging classification . . . 234
C.28 Results of Wilcoxon test used to compare the DAG classification Model and OVO SVM . . . 235
List of Tables
1.1 Data sets Characteristics . . . 8
2.1 Binary Tree hierarchical classification approaches . . . 27
3.1 Binary Tree hierarchical classification model variations . . . 55 3.2 Average Accuracy and AUC values obtained using Decision Tree classifiers
and Bagging of Decision Trees classifiers at nodes coupled with the three
al-ternative data distribution techniques: (i)k-means, (ii) divisive hierarchical clustering and (iii) data splitting . . . 58
3.3 Run time results (in seconds) obtained using Decision Tree classifiers and Bagging of Decision Tree classifiers at nodes coupled with the three
con-sidered data distribution techniques: (i) k-means, (ii) divisive hierarchical
clustering and (iii) data splitting . . . 59 3.4 Average Accuracy and AUC values obtained using Naive Bayes classifiers and
Bagging of Naive Bayes classifiers at nodes coupled with the three alternative
data distribution techniques: (i)k-means, (ii) divisive hierarchical clustering and (iii) data splitting with respect to the Single Path Strategy . . . 60
3.5 Run time results (in seconds) obtained using Naive Bayes classifiers and
Bagging of Naive Bayes classifiers at nodes coupled with the three considered data distribution techniques: (i)k-means, (ii)divisivehierarchical clustering
and (iii) data splitting . . . 61
data distribution techniques: (i)k-means, (ii) divisive hierarchical clustering
and (iii) data splitting with respect to the Single Path Strategy . . . 63 3.7 Run time results (in seconds) obtained using CARM classification and
Bag-ging of CARM classification at nodes coupled with the three considered data
distribution techniques: (i)k-means, (ii)divisivehierarchical clustering and (iii) data splitting . . . 64
3.8 Average Accuracy and AUC values obtained using the Single Path strategy
coupled with the three alternative classification algorithms for generating the node classifiers in the Binary Tree: (i) Decision Tree, (ii) Naive Bayes and (iii)
CARM, with respect to the three considered data distribution techniques:
(i) k-means, (ii)divisivehierarchical clustering and (iii) data splitting . . . . 66 3.9 Average Accuracy and AUC values obtained using the Multiple Path
strat-egy coupled with the three alternative class label selection mechanisms: (i)
BIP, (ii) NAP and (iii) Voting with respect to the three considered data distribution techniques: (i)k-means, (ii)divisivehierarchical clustering and
(iii) data splitting . . . 68
3.10 Run time results (in seconds) obtained using the Multiple Path strategy coupled with NAP with respect to Naive Bayes classification and the three
considered data distribution techniques: (i)k-means, (ii) data splitting and (iii) divisivehierarchical clustering . . . 70
3.11 Average Accuracy and AUC values obtained using the Multiple Path
strat-egy coupled with the two alternative class label selection mechanisms: (i) BIC, (ii) NAC and (iii) Voting with respect to the three considered data
distribution techniques: (i)k-means, (ii)divisivehierarchical clustering and
(iii) data splitting . . . 71 3.12 Run time results (in seconds) obtained using the Multiple Path strategy
coupled with NAP with respect to CARM classifiers and the three considered
data distribution techniques: (i)k-means, (ii) data splitting and (iii)divisive hierarchical clustering . . . 72
3.13 Average Accuracy and AUC values obtained using Naive Bayes and CARM
to generate Binary Tree hierarchical classification models coupled with the Multiple Path strategy (using NAP mechanism), with respect to the three
considered data distribution techniques: (i)k-means, (ii)divisive
hierarchi-cal clustering and (iii) data splitting . . . 74 3.14 Average Accuracy and AUC values obtained using Naive Bayes to generate
Binary Tree hierarchical classification models coupled with the Single and
Multiple Path strategies, with respect to the three considered data distri-bution techniques: (i)k-means, (ii)divisivehierarchical clustering and (iii)
data splitting . . . 75
Path strategies, with respect to the three considered data distribution
tech-niques: (i)k-means, (ii)divisivehierarchical clustering and (iii) data splitting 77 3.16 Average accuracy and AUC results obtained when using: (i) stand alone
decision tree classification, (ii) bagging of decision trees and (iii) Binary
Tree hierarchies with decision trees at nodes (K-means&DT, DS&DT, and HC&DT) . . . 79
3.17 Average accuracy and AUC results obtained when using: (i) stand alone
Naive Bayes classification, (ii) bagging of Naive Bayes and (iii) Binary Tree hierarchies with Naive Bayes classifiers at nodes (K-means&N, DS&N, and
HC&N) . . . 80
3.18 Average accuracy and AUC results obtained when using: (i) stand alone CARM classification, (ii) bagging of CARM and (iii) Binary Tree
hierar-chies with CARM classifiers at nodes (K-means&CARM, DS&CARM, and
HC&CARM) . . . 82 3.19 Run time results (in seconds) obtained using (i) stand alone decision tree
classification, (ii) bagging of decision trees and (iii) Binary Tree hierarchies
with decision trees at nodes (K-means&DT, DS&DT, and HC&DT) . . . 83 3.20 Run time results (in seconds) obtained using (i) stand alone Naive Bayes
classification, (ii) bagging of Naive Bayes and (iii) Binary Tree hierarchies with Naive Bayes classifier at nodes (K-means&N, DS&N, and HC&N) . . . 84
3.21 Run time results (in seconds) obtained using: (i) stand alone CARM
classi-fication, (ii) bagging of CARM and (iii) Binary Tree hierarchies with CARM classifiers at nodes (K-means&CARM, DS&CARM, and HC&CARM) . . . . 85
4.1 The optimal values for C and γ with respect to the fourteen considered
evaluation datasets . . . 99 4.2 Average Accuracy and AUC values obtained using Decision Tree, Naive
Bayes and CARM to generate a rooted DAG classification model . . . 100
4.3 Run time results (in seconds) obtained using Decision Tree, Naive Bayes, and CARM to generate a rooted DAG classification model . . . 102
4.4 Comparison between: (i) NAP, (ii) BIP and (iii) Voting mechanisms for
determining the final resulting class label with respect to rooted DAG . . . . 103 4.5 Average accuracy and average AUC results obtained using the two, three
and all branches strategies when generating a rooted DAG (Naive Bayes) . . 104
4.6 Run time results (in seconds) obtained when using the two, three and all branch strategies when generating a rooted DAG (Naive Bayes) . . . 105
4.7 Average Accuracy and AUC values obtained using Naive Bayes and CARM
to generate rooted DAG classification models coupled with the two branch strategy . . . 106
4.9 Average Accuracy and AUC results obtained using CARM coupled with
either a single or a multiple path strategy . . . 108 4.10 Average accuracy and AUC results obtained when using: (i) stand alone
decision tree classification, (ii) bagging of decision trees and (iii) DAG
clas-sification with decision trees at nodes . . . 109 4.11 Run time results (in seconds) obtained using (i) stand alone decision tree
classification, (ii) bagging of decision trees and (iii) DAG classification with
decision trees at nodes . . . 109 4.12 Average accuracy and AUC obtained when using: (i) stand alone Naive
Bayes classification, (ii) bagging of Naive Bayes classifiers and (iii) DAG
classification with Naive Bayes classifiers at nodes . . . 110 4.13 Run time results (in seconds) obtained using: (i) stand alone Naive Bayes
classification, (ii) bagging of Naive Bayes classifiers and (iii) DAG
classifica-tion with Naive Bayes classifiers at nodes . . . 111 4.14 Average Accuracy and AUC values obtained using Naive Bayes DAG coupled
with the Multiple Path strategy, and One-versus-One using SVM as the base
classifier . . . 112 4.15 Run time results (in seconds) obtained using Naive Bayes DAG coupled
with the Multiple Path strategy, and One-versus-One using SVM as the base classifier . . . 112
4.16 Average accuracy and AUC results obtained when using: (i) stand alone
CARM classification, (ii) bagging of CARM classifiers and (iii) DAG classi-fication with CARM classifiers at nodes . . . 113
4.17 Run time results (in seconds) obtained when using: (i) stand alone CARM
classification, (ii) bagging of CARM classifiers and (iii) DAG classification with CARM classifiers at nodes . . . 113
5.1 Average Accuracy and AUC values obtained using the Naive Bayes DAG
model coupled with the Single Path strategy when using different numbers of levels in the DAG . . . 127
5.2 Average Accuracy and AUC values obtained using the CARM DAG model
coupled with the Single Path strategy when using different numbers of levels in the DAG . . . 128
5.3 Comparison of average Accuracy and AUC values obtained using Naive Bayes
DAGs and CARM DAGs coupled with the Single Path strategy . . . 129 5.4 Run time results (in seconds) obtained using Naive Bayes DAGs and CARM
DAGs and the Single Path strategy . . . 129
5.5 Average Accuracy and AUC values obtained using Naive Bayes and CARM classifier generation with respect to Multiple Path DAGs . . . 131
5.7 Average Accuracy and AUC values obtained using Naive Bayes All-level
DAGs coupled with either the Single Path or Multiple Path strategy (σ = 0.1×10⁻⁴) . . . 133
5.8 Average Accuracy and AUC values obtained using Naive Bayes Two-level
DAG coupled with either the Single Path or Multiple Path strategy (σ = 0.5×10⁻⁴) . . . 134 5.9 Average Accuracy and AUC values obtained using CARM DAGs coupled
with both the Single Path and Multiple Path strategies (σ= 45 and σ = 40 were used when following multiple paths with respect to the All-level and
the Two-level DAGs respectively) . . . 134
5.10 Average Accuracy and AUC values obtained using Naive Bayes rooted and non-rootedDAGs coupled with Single Path and Multiple Path strategies . . 136
5.11 Run time results (in seconds) obtained using Naive Bayes rooted and non
rooted DAGs coupled with Single and Multiple Path strategies . . . 137 5.12 Average Accuracy and AUC values obtained using CARM rooted and
non-rooted DAGs coupled with Single Path and Multiple Path strategies . . . 138
5.13 Run time results (in seconds) obtained using CARM rooted and non rooted DAGs coupled with Single and Multiple Path strategies . . . 140
6.1 The best accuracy and AUC results obtained for each dataset using different α values with respect to Max-level and Min-level DAGs . . . 148
6.2 Accuracy and AUC values obtained from following multiple paths within the
DAGs (Min-level and Max-level) using a fixed α value (α = 0.40) and the bestα value with respect to each dataset . . . 149
6.3 Average Accuracy and AUC results obtained using the Max-level DAG
cou-pled with either a Single or a Multiple Path strategy (σ= 0.1×10⁻⁴) . . . . 150 6.4 Average Accuracy and AUC results obtained using Min-level DAG coupled
with either a Single or a Multiple Path strategy (σ = 0.1×10⁻⁴) . . . 151 6.5 Classification run time results (in seconds) obtained using the DAG model
(Max-level and Min-level) . . . 152
6.6 Accuracy and AUC results obtained using: (i) Rooted DAG, (ii) All-level
DAG, (iii) Two-level DAG, (iv) Max-level DAG, and (v) Min-level DAG coupled with Multiple Path strategy . . . 154
6.7 Run time results (in seconds) obtained using DAGs based classification
ap-proaches: (i) Rooted DAG, (ii) All-level DAG, (iii) Two-level DAG, (iv) Max-level DAG, and (v) Min-level DAG coupled with either Single Path or
Multiple Path strategies . . . 155
6.8 Average Accuracy and AUC values obtained using the Binary Tree classifi-cation model and the Min-level DAG classificlassifi-cation model . . . 156
6.10 Average Accuracy and AUC values obtained using “Stand-alone” Naive
Bayes classification, “Bagging” and the proposed Min-level DAG
classifi-cation model . . . 158
6.11 Run time results (in seconds) obtained using “stand-alone” Naive Bayes classification, Bagging and the proposedMin-level DAG classification model 159 6.12 Average Accuracy and AUC values obtained using Naive Bayes DAG (Min-level DAG) coupled with the Multiple Path strategy, and One-versus-One using SVM as the base classifier . . . 160
6.13 Run time results (in seconds) obtained using Naive Bayes DAG (Min-level DAG) coupled with the Multiple Path strategy, and One-versus-One using SVM as the base classifier . . . 160
7.1 Run time results (in seconds) obtained using parallel processing to generate the Naive Bayes rooted DAG model compared with the Naive Bayes rooted DAG model generated without using parallel processing . . . 177
7.2 Average Accuracy and AUC values obtained using OVO SVM and the OVO SVM DAG . . . 178
7.3 Run time results (in seconds) obtained using OVO SVM and the OVO SVM DAG . . . 178
A.1 Waveform Characteristics . . . 198
A.2 Wine Characteristics . . . 199
A.3 Nursery Characteristics . . . 199
A.4 Heart Characteristics . . . 200
A.5 PageBlocks Characteristics . . . 200
A.6 Dermatology Characteristics . . . 201
A.7 Glass Characteristics . . . 201
A.8 Zoo Characteristics . . . 202
A.9 Ecoli Characteristics . . . 203
A.10 Led Characteristics . . . 203
A.11 PenDigits Characteristics . . . 204
A.12 Soybean Characteristics . . . 204
A.13 Chess KRvK Characteristics . . . 205
A.14 Letter Recognition Characteristics . . . 206
B.1 Truth values . . . 208
B.2 Prediction values . . . 208
B.3 MWW(1|2) . . . 208
B.4 MWW(2|1) . . . 208
B.5 MWW(1|3) . . . 209
B.6 MWW(3|1) . . . 209
B.9 Truth values . . . 210
B.10 Prediction values . . . 210
B.11 MWW(1|2) . . . 210
B.12 MWW(2|1) . . . 210
B.13 MWW(1|3) . . . 210
B.14 MWW(3|1) . . . 210
B.15 MWW(2|3) . . . 211
B.16 MWW(3|2) . . . 211
D.1 Accuracy and AUC values produced when using the Multiple Path strategy and the best individual probability class label mechanism with respect to k-mean data distribution technique, using a range of values for σ . . . 240
D.2 Accuracy and AUC values produced when using the Multiple Path strategy and the best individual probability class label mechanism with respect to data splitting technique, using a range of values forσ . . . 241
D.3 Accuracy and AUC values produced when using the Multiple Path strategy and the best individual probability class label mechanism with respect to divisivehierarchical clustering technique, using a range of values forσ . . . 242
D.4 Accuracy and AUC values produced when using the Multiple Path strategy and the best normalised accumulated probability class label mechanism with respect tok-mean data distribution technique, using a range of values forσ . 243 D.5 Accuracy and AUC values produced when using the Multiple Path strategy and the best normalised accumulated probability class label mechanism with respect to data splitting technique, using a range of values for σ . . . 244
D.6 Accuracy and AUC values produced when using the Multiple Path strategy and the best normalised accumulated probability class label mechanism with respect to divisivehierarchical clustering technique, using a range of values forσ. . . 245
D.7 Accuracy and AUC values produced when using the Multiple Path strategy and voting class label mechanism with respect to k-mean data distribution technique, using a range of values for σ . . . 246
D.8 Accuracy and AUC values produced when using the Multiple Path strategy and voting class label mechanism with respect to data splitting technique, using a range of values forσ . . . 247
D.9 Accuracy and AUC values produced when using the Multiple Path strat-egy and voting class label mechanism with respect to divisive hierarchical clustering technique, using a range of values forσ . . . 248
mechanism, with respect to a CARM and k-mean generated Binary Tree
model, using a range of values for σ . . . 249 D.11 Average Accuracy and AUC values produced when using the Multiple Path
strategy coupled with the best individual confidence class label selection
mechanism, with respect to a CARM and data splitting generated Binary Tree model, using a range of values forσ . . . 249
D.12 Average Accuracy and AUC values produced when using the Multiple Path
strategy coupled with the best individual confidence class label selection mechanism, with respect to a CARM and divisive hierarchical clustering
generated Binary Tree model, using a range of values forσ . . . 250
D.13 Average Accuracy and AUC values produced when using the Multiple Path strategy coupled with the best normalised accumulated confidence class label
selection mechanism, with respect to a CARM andk-mean generated Binary
Tree model, using a range of values forσ . . . 250 D.14 Average Accuracy and AUC values produced when using the Multiple Path
strategy coupled with the best normalised accumulated confidence class label
selection mechanism, with respect to a CARM and data splitting generated Binary Tree model, using a range of values forσ . . . 251
D.15 Average Accuracy and AUC values produced when using the Multiple Path strategy coupled with the best normalised accumulated confidence class label
selection mechanism, with respect to a CARM and divisive hierarchical
clustering generated Binary Tree model, using a range of values for σ . . . . 251 D.16 Average Accuracy and AUC values produced when using the Multiple Path
strategy coupled with the voting class label selection mechanism, with
re-spect to a CARM and k-mean generated Binary Tree model, using a range of values forσ . . . 252
D.17 Average Accuracy and AUC values produced when using the Multiple Path
strategy coupled with the voting class label selection mechanism, with re-spect to a CARM and data splitting generated Binary Tree model, using a
range of values forσ . . . 252
D.18 Average Accuracy and AUC values produced when using the Multiple Path strategy coupled with the voting class label selection mechanism, with
re-spect to a CARM and hierarchical clustering generated Binary Tree model,
using a range of values forσ . . . 253
F.1 Average Accuracy and AUC values obtained using different values forτ with
respect to CARM in order to generate a rooted DAG classification model . . 257
F.2 Accuracy and AUC values produced when using the two branch strategy and the NAP mechanism with respect to a rooted DAG using a range of values
forσ. . . 258
forσ. . . 259
F.4 Accuracy and AUC values produced when using the two branch strategy and the BIP mechanism with respect to a rooted DAG using a range of values
forσ. . . 260
F.5 Accuracy and AUC values produced when using the three branch strategy with and the normalised accumulated weight mechanism with respect to a
rooted DAG using a range of values forσ . . . 261
F.6 Accuracy and AUC values produced when using the all branch strategy with and the normalised accumulated weight mechanism with respect to a rooted
DAG using a range of values for σ . . . 262
F.7 AUC values produced when using the two path strategy with respect to a CARM generated DAG model and a range of values forσ . . . 263
G.1 Results obtained using a range of σ values with respect to Naive Bayes
classification, the multiple paths strategy and all-level DAGs . . . 265 G.2 Results obtained using a range of σ values with respect to Naive Bayes
classification, the multiple path strategy and two-level DAGs . . . 266 G.3 Results obtained using a range ofσ values with respect to CARM, the
mul-tiple paths strategy and all-level DAGs . . . 267
G.4 Results obtained using a range ofσ values with respect to CARM, the mul-tiple paths strategy and two-level DAGs . . . 267
H.1 Results obtained using a range ofαvalues with respect to Max-levels DAG,
using the single-path strategy . . . 269 H.2 Results obtained using a range ofα values with respect to Min-levels DAG,
using the single-path strategy . . . 270
H.3 Results obtained using a range ofσvalues for following multiple paths using the Max-levels DAG variation and α= 0.40 with respect to breadth pruning 271
H.4 Results obtained using a range ofσvalues for following multiple paths using
the Min-levels DAG variation and α= 0.40 with respect to breadth pruning 272 H.5 Results obtained using a range ofσvalues for following multiple paths within
the DAG using the Max-levels DAG variation and the bestα value for each
dataset with respect to breadth pruning . . . 273 H.6 Results obtained using a range ofσvalues for following multiple paths using
the Min-levels DAG variation and the best α value for each dataset with
respect to breadth pruning . . . 274
Introduction
1.1
Overview
With the increasing availability of very large data collections the automated extraction
(mining) of patterns from within such datasets is becoming increasingly challenging.
This is true with respect to a variety of data mining processes including classification, especially where the classification task features a large number of class labels.
Classifi-cation is a well established element of machine learning concerned with the creation of
models, using pre-labelled “training” data, that can be used to allocate labels (classes) to previously unseen data. Classification can be viewed as a three-step process: (i)
generation of the classifier using appropriately formatted “training” data, (ii) testing of
the effectiveness of the generated classifier using test data and (iii) application of the classifier using previously unseen data. The first two steps are sometimes combined for
experimental purposes.
The nature of the classification problem is characterised by two main factors: (i) the number of class labels that can be assigned to an example (single-label versus multi-label
classification) and (ii) the number of classes from which the class labels may be drawn (binary versus multi-class classification). In single-label classification a classifier model
is generated using a set of training examples where each example is associated with a
single class labelctaken from a set of disjoint class labelsC(|C|>1). If|C|= 2 we have a binary classification problem; if |C|>2, we have a multi-class classification problem.
The distinction between single-label and multi-label classification is that in multi-label
classification the examples are each associated with a set of class labels Z, Z ⊆C. In the work presented in this thesis we focus on the multi-class single-label classification
problem where examples are associated with exactly one element of the set of class
labels C. For simplicity, throughout this work, we will refer to this simply as “multi-class” classification. An issue with multi-class classification is that when |C| is large
the effectiveness of the classification tends to diminish. There has been extensive work
directed at the generation of effective classifiers for multi-class classification problems [28, 58, 88, 94]. It is worth noting that, to date, no one classification model has been
found to be superior to all others in terms of classification effectiveness [44].
Three main methodologies for addressing the multi-class classification problem can be identified: (i) using a single all-encompassing classifier, (ii) utilising a collection of
binary classifiers and (iii) using an “ensemble” of classifiers. The Ensemble methodology
is considered to be one of the most effective strategies to handle the multi-class problem [8, 27, 44, 47, 77, 79, 85, 109]. The ensemble model is a composite model comprised
of a number of learners (classifiers), often referred to as base learners or weak learners,
that “collaborate” to obtain a better classification performance than can be obtained from using a single “stand-alone” model. Classifiers making up an ensemble can be
arranged in two main formats: (i) concurrent such as “Bagging” [12] and (ii) sequential
such as “Boosting” [35]. In more recent work on ensemble classification, hierarchical arrangements of classifiers have been used [4, 20, 58, 60, 68, 100]. A commonly adopted
structure is a binary tree constructed in either a bottom-up or top-down manner [11, 58].
The work presented in this thesis is directed at hierarchical ensemble classification. The central idea espoused in this thesis is that a more effective classification can be
produced if a “coarse-grain” classification (directed at groups of classes) is first conducted
followed by increasingly more “fine-grain” classifications. To this end the generation and usage of a hierarchical ensemble classification models, that involve arranging the base
classifiers in the form of a Binary Tree (BT) or Directed Acyclic Graph (DAG) structure,
is proposed. Using these structures each node in the BT or DAG holds a classifier. Nodes near the root hold classifiers designed to discriminate between groups of class labels while
the leaves hold classifiers designed to distinguish between individual class labels. The remainder of this introductory chapter is organised as follows. Section 1.2
presents the motivations for the work presented in this thesis. Section 1.3 describes
the main research question and the associated research issues to be addressed by the thesis. The adopted research methodology is presented in Section 1.4. Section 1.5
pro-vides an overview of the data sets used to evaluate the proposed hierarchical ensemble
classification approaches and a generic overview of the adopted evaluation metrics. Sec-tion 1.6 describes the contribuSec-tions of the work presented. The organisaSec-tion of the
remainder of this thesis is presented in Section 1.7. Section 1.8 lists the publications
resulting from the research presented in this thesis. Finally this chapter is concluded in Section 1.9 with a brief summary.
1.2
Motivations
From the foregoing, the work in this thesis is focused on using hierarchical ensemble
classification to solve the multi-class classification problem.
The primary motivation for the work described in this thesis was a desire to provide a solution to a recognised problem in machine learning, the “multi-class” classification
problem. It is generally simpler to construct a classifier for two mutually exclusive classes
setD of the form (xi, yi), wherexi ∈Dn is theith example inD, and yi∈ {1, . . . , k} is
theith class label in a given setC of such labels, the aim is to learn a modelM such that
M(xi) =yi for new previously unseen examples. Multi-class classification is challenging
because: (i) each class is represented by fewer examples in the training dataset than in the case of binary training data and (ii) a suitable subset of features that can be used
to discriminate between large numbers of classes (more than two) is often difficult to
identify.
Using ensembles of classifiers arranged in a hierarchical form is expected to provide
an effective classification with respect to the multi-class classification problems for two
reasons: (i) the established observation that ensemble methods tend to improve classi-fication performance [8, 27, 44, 47, 77, 79, 85, 109] and (ii) dealing with smaller subsets
of class labels at each node might produce better results.
In addition to the above motivations, the work described in this thesis was also motivated by two further challenges specific to the operation of hierarchical ensemble
classification models. The first was how best to organise (group) the class labels at nodes
so as to produce a hierarchy that generates the most effective classification. The second, and one which (to the best knowledge of the author) has not been addressed previously,
was the “successive mis-classification” issue associated with hierarchical classification
models. In other words, how to deal with the issue that if an example is mis-classified early on in the process (near the root of the hierarchy) it will continue to be mis-classified
at deeper levels of the hierarchy, regardless of the classifications proposed at lower level nodes and the final leaf nodes.
From the forgoing, the motivation for the work described in this thesis can be
sum-marised as follows:
1. A desire to provide a more effective form of classification for multi-class
classifi-cation problems, especially in the case of datasets that feature a large number of
class labels.
2. The expectation that the hierarchical classification model will produce an effective classification with respect to the multi-class classification problems.
3. A desire to address the “successive mis-classification” issue associated with hier-archical classification.
4. The necessity of a comprehensive study concerning a recent form of ensemble
classification; namely hierarchical ensemble classification.
1.3
Research Question and Issues
Given the motivations presented in the foregoing section, the main research question to
“What are the most appropriate mechanisms that can be employed to generate effective hierarchical classification models?”
In order to answer this research question, the resolution of a number of subsidiary
research questions were required. These questions can be summarised as follows:
1. Is a hierarchical classifier best arranged using a Binary Tree structure, or is it better
to adopt a Directed Acyclic Graph (DAG), to effectively classify data collections
that feature a large number of class labels?
2. How can the nodes in a hierarchical classifier best be connected to achieve an effective classification?
3. Can a better classification accuracy be achieved by following more than one path within the hierarchy? And if so how do we decide which paths to follow?
4. Following on from (3) above, when adopting a multiple path strategy, how do we
combine a number of possibly contradictory final classifications to provide a single
end classification?
5. Following on from (3) and (4) above, will using a multiple path serve to address the “successive mis-classification” issue associated with hierarchical ensemble
clas-sification models?
6. What is the best way of dividing up a given set of class labels between nodes (in
a Binary Tree hierarchy or DAG)? Previous research on hierarchical classification, which is mostly directed at the use of Binary Tree structures, proposed some
techniques to distribute class labels between nodes within the hierarchy. However,
to the best knowledge of the author, no previous work has provided a comparative study of these techniques. In another words, no recommendation for the “best”
data distribution technique has been proposed.
7. What is the most appropriate classification algorithm to be held at individual
nodes? In addition to the efficiency and effectiveness concerns usually used to evaluate classification algorithm, a further consideration is the support that
indi-vidual classification algorithms provide with respect to any multiple path strategy
that might be adopted.
8. Is it indeed the case that Binary Tree hierarchical classifiers and/or DAG classifiers
can be more effectively used (than when using alternative techniques) to classify data collections that feature a large number of class labels?
9. What is the most effective classification model to be used for classifying
a new data set given some characteristics regarding the new data set
The specific objectives of the research were thus to find answers to the above research question and associated subsidiary questions.
1.4
Research Methodology
The adopted research methodology was to consider a series of techniques to generate classification hierarchies starting with simple Binary Tree structures and moving on to
more complex DAG structures. Regardless of the structure of the desired hierarchies a
key issue was how class labels are to be assigned to nodes and how the nodes are to be connected. Several techniques were considered to achieve this including: splitting,
clus-tering and combination techniques. For each structure, how best to follow several paths in the hierarchy was also a consideration. Figure 1.1 presents the different structures,
strategies, techniques, and mechanisms that have been considered in this thesis.
K-means Data splitting
Hierarchical Clustering
Rooted
DAG Non-rooted DAG
Hierarchical Classification
Binary Tree DAG
All- level
Two- level
Max- level
Single Path Strategy
Multiple Path Strategy
Voting
Min- level
Single Path Strategy
Multiple Path Strategy
[image:24.596.113.520.302.615.2]BIP/BIC NAP/NAC Voting BIP/BIC NAP/NAC
Figure 1.1: Hierarchical classification structures, techniques, strategies, and mecha-nisms
The first investigation conducted was directed at the use of a Binary Tree structure
to generate the desired hierarchical classification model. To generate the Binary Tree
hierarchy three different distribution techniques were proposed in order to divide the data during the hierarchy generation process (founded on ideas concerned with clustering
and splitting techniques): (i) k-means, (ii) data splitting and (iii) divisive hierarchical
hierarchy node was also proposed: (i) single “stand-alone” classifiers and (ii) “bagging” ensemble classifiers. Three alternative classification algorithms were considered: (i)
Decision tree, (ii) Naive Bayes and (iii) Classification Association Rule Mining (CARM).
Two classification strategies were proposed: (i) “Single-Path” and (ii) “Multiple-Path” (again as shown in Figure 1.1). In the first case the strategy was to select the
class at the leaf node label by following a “single path” within the hierarchy from the root
node to the leaf node. The second strategy allowed for more than one path to be followed. This second strategy was proposed to address the “successive mis-classification” problem
identified earlier in this chapter. In the case of the Multiple Path strategy this was
specifically designed to operate using Naive Bayes or CARM classification, which feature probability or confidence values that can be used to determine whether single or multiple
paths should be followed at each hierarchy node. In the case where more than one path
is followed, it was anticipated that a number of alternative class labels would result, three alternatives for arriving at a final decision were proposed (as shown in Figure 1.1):
(i) a voting mechanism; (ii) selecting the class label associated with the leaf node that
features the highest probability (confidence) a measure referred as the Best Individual Probability or Confidence (BIP/BIC) measure; and (iii) taking into consideration the
probability (confidence) values identified along the path back to the root node to produce
anaccumulated value, a measure referred to as the Normalised Accumulated Probability or Confidence (NAP/NAC) measure.
The second structure to be investigated was the use of DAGs to generate the desired hierarchical classification model. With reference to Figure 1.1 two alternative DAG
hi-erarchical classification structures were proposed: (i) rooted DAG, and (ii) non-rooted
DAG. To generate the DAG classification model “combination techniques” were pro-posed to distribute (organise) the class labels between nodes within the DAG. Again,
as in the case of the proposed Binary Tree hierarchies, three alternative classification
algorithms were considered: (i) Decision tree, (ii) Naive Bayes and (iii) Classification Association Rule Mining (CARM). Two classification strategies were again considered:
(i) “Single-Path” and (ii) “Multiple-Path” together with, in the later case, the three
al-ternatives for arriving at a final classification decision as used with respect to the binary tree structure investigated earlier: (i) Voting, (ii) BIP/BIC and (iii) NAP/NAC. The
non-rooted DAG models were found to perform well, however, in order to improve the
performance (effectiveness, efficiency, and scalability) of thenon-rootedDAG model two forms of pruning were considered, depth and breadth pruning.
It is worth to noting here the reasons behind choosing Decision tree, Naive Bayes
and CARM classification algorithms to generate the node classifiers:
1. A requirement for multi-class classification algorithms in the case of the DAG
models.
2. The expectation that a better classification accuracy would be obtained when
3. The fact that with respect to Naive Bayes and CARM classifiers, probability and confidence values could be utilised to: (i) support mechanisms for following
mul-tiple paths within a hierarchy and (ii) to determine the “start node” (root node)
from which a classification process should best commence, with respect to the non-rooted DAGs.
4. A desire to use a consistent set of classification algorithms with respect to the
evaluation of the different hierarchical classification models suggested.
In addition utilising parallel computing to generate and operate the proposedrooted DAG hierarchical classification model was considered. The conjecture here was that this
would generate a more efficient and effective DAG. It was suggested that the latter can
be realised if more effective classifiers, such as SVM classifiers, are used at each DAG node. However, “stand-alone” SVM classifiers could not be used in the context of the
DAG model because they are essentially binary classifier. To address this issue OVO
SVM was used at each DAG node. Consequently, the resulting model would be a form of ensemble of ensembles which might improve the classification effectiveness.
1.5
Evaluation Data Sets and Criteria
This section provides an overview of the data sets used to evaluate the proposed
hierar-chical ensemble classification approaches. A generic overview of the adopted evaluation
metrics used with respect to the evaluation data sets is also presented.
In the context of the evaluation reported on later in this thesis, fourteen different
data sets (with different numbers of class labels) were used taken from the UCI machine
learning repository [63]. These were processed using the LUCS-KDD-DN data pre-processing software system [23]. The general characteristics of the data sets are provided
in Table 1.1. The last column refers to the skewness of the data sets. More specifically,
given a data set with N class labels if the percentage of the occurrences of each class is 100/N the data set is perfectly balanced. While if one or more class labels differ
significantly from other classes, then the data set is skewed or unbalanced [38]. The
distribution of each class label with respect to each data set, and further information about the evaluation data sets, is provided in Appendix A.
In order to evaluate the effectiveness of the proposed hierarchical classification
ap-proaches, average accuracy and average AUC (Area Under the receiver operating Curve) were used. To describe the calculation of these metrics in further detail it is first
neces-sary to present some terminology in the context of binary classifiers:
1. True Positives (TP): The number of positive examples that are correctly labelled
as positive.
2. True Negatives (TN): The number of negative examples that are correctly labelled
Table 1.1: Data sets Characteristics
Dataset Number of Number of Number of Missing Balanced/ Classes Examples Attributes Values Skewness
WaveForm 3 5000 21 0 Balanced
Wine 3 178 13 0 Balanced
Nursery 5 12960 8 0 Skewed
Heart 5 297 13 6 Skewed
PageBlocks 5 5473 10 0 Skewed
Dermatology 6 358 12 8 Skewed
Glass 7 214 10 0 Skewed
Zoo 7 101 16 0 Skewed
Ecoli 8 336 7 0 Skewed
Led 10 3200 7 0 Balanced
PenDigits 10 10992 16 0 Balanced
Soybean 15 562 35 0 Skewed
Chess KRvK 18 28056 6 0 Skewed
Letter Recognition 26 20000 16 0 Balanced
3. False Positives (FP): The number of negative examples that are incorrectly labelled as positive.
4. False Negatives (FN): The number of positive examples that are incorrectly
la-belled as negative.
Given the above, the accuracyof a classifier, the percentage indicating the number of examples that are correctly classified, is calculated as follows:
Accuracy= T P +T N
T P +T N +F P +F N (1.1)
More simply the accuracy of a given classifier is the number of examples that are correctly
classified divided by the total number of examples in a given test set.
From the foregoing, accuracy is a straightforward and easy to calculate measure.
However, the accuracy measure does not take into consideration the skewness of the
data (class priors). Consequently, it is preferable to consider an alternative evaluation measure that does take skewness into account. Within the data mining community the
most commonly used metric in this context is the Area Under the ROC Curve (AUC)
metric [52]. AUC takes skewness into account, and as a result it is considered to be a more informative measure, especially when considering very skewed data sets (as the
case of some of the work presented in this thesis).
To fully understand the AUC evaluation measure, it is first necessary to understand what a ROC Curve is. A Receiver Operating Characteristic (ROC) Curve is a visual
representation of the trade-off between the true positive rate1 (Recall/Sensitivity) and the false positive rate2 (1-Specificity). Figure 1.2 shows three ROC curves for three different classifiers. The diagonal line indicates random guessing. A ROC curve located
above the diagonal line indicates that the performance is better than a guess, while a
1
T P R=T PT P+F N 2
ROC curve located below the diagonal line indicates that the performance is worse than guessing. A best performance is indicated by a ROC curve located close to the top left
hand corner of the plot. Thus, with respect to the ROC curves presented in Figure 1.2
the yellow curve is the best. Rather than considering the individual curves it is simpler to consider the area under the ROC curve, hence the AUC measure. An AUC of 1
indicates a perfect performance; an AUC of 0.5 indicates guessing; an AUC of less than
0.5 indicates a performance that is worse than guessing. A detailed example of the AUC calculation is provided in Appendix B.
0 0.1 0.2 0.3 0.4 0.5 0.6 0.7 0.8 0.9 1
True P
ositiv
e
Ra
te
1
0.9 0.8
0.7
0.6
0.5
0.4
0.3
0.2
0.1
False Positive Rate
Figure 1.2: ROC curve example
In addition to classification effectiveness, efficiency was also considered with respect
to the work presented in this thesis. Efficiency was measured according to run times, both hierarchical ensemble generation time and classification time. Note here that all
experiments were conducted using a 2.7 GHz Intel Core i5 with 16 GB 1333 MHz DDR3 memory, running OS X 10.9.2 (13C64).
In order to obtain more accurate results average accuracies and average AUC values
were obtained using the Tenfold Cross Validation (TCV) method. Using TCV a given data set D is partitioned into ten disjoint partitions, d1, d2,. . ., d10, each of
approxi-mately equal size. Training is performed ten times each time using a different tenth as
the test set and the remaining nine tenths as the training set. On each iteration accuracy and AUC was measured and at the end of process the overall accuracy and AUC were
calculated.
It should be noted here that an issue arises when considering TCV with respect to the AUC value for some highly unbalanced data sets. More specifically, assuming a highly
unbalanced data set that feature less than ten examples of a specific class, dividing
the data set into ten folds results in some folds without any examples from that class. During the testing stage, the classifier will not be actually evaluated against that class
for some test folds (the folds that do not include any example of that class). However
case was found for four data sets: (i) Nursery, (ii) Glass, (iii) Zoo and (iv) Ecoli. An example of such case is presented in Appendix A.
The effectiveness of the proposed models were evaluated by comparing with more
con-ventional existing models (stand-alone multi-class classifiers, collection of binary classi-fiers and ensemble models). To determine whether the results obtained were statistically
significant a precise and comprehensive statistical analysis of the results was conducted
using the Wilcoxon signed rank test for comparing two classification models, and the Friedman test (coupled with a Nemenyi post-hoc test where appropriate) for comparing
several classification models (more than two).
1.6
Research Contributions
The main contributions of the research presented in this thesis can be summarised as
follows:
1. A set of alternative techniques to distribute class labels between nodes within a
Bi-nary Tree hierarchy. With respect to the existing work on BiBi-nary Tree hierarchies,
it should be noted that the most frequently used methods for dividing classes be-tween nodes do not allow overlapping bebe-tween the class groups. In this work both
overlapping and non-overlapping techniques were considered. The conjecture of
al-lowing overlapping was that this would mitigate against the early mis-classification issue.
2. An evaluation of the use of a number of alternative classification algorithms, to
generate node classifiers within a Binary Tree hierarchy. Note that existing work
on Binary Tree hierarchies has mainly utilised binary classification algorithms such as SVM.
3. An “ensemble of ensembles” approach with respect to Binary Tree hierarchies.
More specifically, using Bagging ensembles at each node within a binary tree
hi-erarchy.
4. A Multiple Path strategy, which allows for more than one path to be followed
within a hierarchy during the classification stage. This strategy is completely novel and it was proposed to address the “successive mis-classification” issue associated
with hierarchical classification. Note here that this strategy was considered with respect to both the proposed Binary Tree and DAG hierarchies.
5. Three alternative mechanisms (Voting, BIP/BIC and NAP/NAC) for arriving at a final classification decision with respect to the Multiple Path strategy. The aim
was to address the issue in the case where more than one path is followed where
we end up with a number of alternative candidate class labels.
7. A novel non-rooted DAG structure for hierarchical multi-class classification.
8. A novel mechanism for applying breadth pruning to thenon-rooted DAG structure.
The conjecture here was that this would improve the effectiveness and efficiency of the DAG classification model, because “weak” classifiers would be pruned.
9. A comprehensive study and statistical analysis of the proposed hierarchical
ensem-ble classification models to identify the “best” structure, classification algorithm,
data distribution technique and classification strategy to be adopted in order to obtain an effective and efficient hierarchical classification model.
10. Utilising parallel computing to generate and operate the proposed rooted DAG
hierarchical classification model. The conjecture here was that this would generate
a more efficient and effective DAG classification model that could be directed at even larger numbers of class labels.
1.7
Organisation of the Thesis
The remainder of this thesis is organised as follows:
Chapter 2 provides a review of the previous work that is of relevance with respect to
the work presented in this thesis.
Chapter 3 presents the hierarchical ensemble classification model for multi-class clas-sification founded on a Binary Tree (BT) structure.
Chapter 4 describes the nature of the proposed rooted DAG hierarchical ensemble classification model.
Chapter 5 presents thenon-rootedDAG structure, rather than arootedDAG structure,
to generate the desired hierarchical classification model. The chapter also considers
the application ofdepth pruning with respect to thenon-rooted (DAG) structure.
Chapter 6 considers the application ofbreadth pruning with respect to thenon-rooted (DAG) hierarchical ensemble classification model. The chapter also presents an
evaluation of the application of both depth pruning and breadth pruning with
respect to thenon-rooted (DAG) structure.
Chapter 7 considers using parallel computing to generate therootedDAG hierarchical classification model.
Chapter 8 begins by presenting some conclusions, then lists the main findings of the work presented in this thesis, and then presents some potential directions for future
1.8
Publications
Five papers, three published, one waiting publication, and one presented for refereeing have arisen out of the work presented in this thesis and these are listed and summarised
in this section.
1. Journal Papers:
(a) Esra’a Alshdaifat, Frans Coenen, and Keith Dures. The Directed Acyclic Graph (DAG) Ensemble Classification Model: An Alter-native Architecture for Hierarchical Classification. Submitted for refereeing to the International Journal of Data Warehousing and
Mining (IJDWM).This paper summarises the work presented in this the-sis. More specifically, the paper proposes the two alternative DAG structures
to support the generation of the desired DAG hierarchical classification
ap-proach: (i) rooted DAG and (ii) non-rooted DAG. The paper also presents a comparison between the Binary Tree and DAG structures to generate the
hierarchical classification model. A comparison between the hierarchical
clas-sification and the well-established conventional models for multi-class classi-fication was also included in this paper. The work in this paper is included
in Chapters 5, 7 and 8.
2. Conference Papers:
(a) Esra’a Alshdaifat, Frans Coenen, and Keith Dures. Hierarchical Single Label Classification: An Alternative Approach. In Max Bramer and Miltos Petridis, editors, the thirty-third BCS SGAI
In-ternational Conference on Artificial Intelligence (BCS SGAI 2013), pages 39-52. Springer, 2013. This paper presents the use of the Binary
Tree structure for use with the desired hierarchical classification model. In
this paper a comparison between two different styles of classification at each hierarchy node was also considered: (i) single “stand-alone” classification and
(ii) “bagging” ensemble classification. A comparison between the three differ-ent techniques for iddiffer-entifying the classes covered by nodes was also included:
(i) k-means, (ii) data splitting and (iii) divisivehierarchical clustering. The
work presented in this paper acted as the foundation for the work described in Chapter 4 of this thesis.
(b) Esra’a Alshdaifat, Frans Coenen, and Keith Dures. Hierarchical Classification for Solving Multi-class Problems: A New Approach Using Naive Bayesian Classification. In Hiroshi Motoda, Zhaohui Wu, Longbing Cao, Osmar R. Zaiane, Min Yao, and Wei Wang,
Science, volume 8346, pages 493-504. Springer, 2013. This paper was the first to introduce the idea of following multiple paths within a Binary Tree
ensemble hierarchy. The paper presented a comparison between the Single
and Multiple Path strategies with respect to Naive Bayes classification. The paper also considered two mechanisms for arriving at a final classification
decision with respect to the Multiple Path strategy. The majority of the
content of this paper is included in Chapter 4 of this thesis.
(c) Esra’a Alshdaifat, Frans Coenen, and Keith Dures. A Multi-path Strategy for Hierarchical Ensemble Classification. In Petra Perner, editor, the 10th Machine Learning and Data Mining in Pattern Recognition (MLDM 2014), Lecture Notes in Computer Science,
volume 8556, pages 198-212. Springer, 2014. This paper proposed
utilising the confidence values associated with CARM classifiers for follow-ing multiple paths within a Binary Tree hierarchical classification model. A
comparison was presented between the operation of: (i) the Single and
Multi-ple Path strategies with respect to CARM classification, (ii) two mechanisms for arriving at a final classification decision in context of the Multiple Path
strategy, (iii) the three different techniques to distribute class labels between nodes within the hierarchy and (iv) the Binary Tree hierarchical classification
model and conventional models for multi-class classification. The majority of
the content of this paper was included in Chapter 4.
(d) Esra’a Alshdaifat, Frans Coenen, and Keith Dures. Directed Acyclic Graphs for Multi-Class Classification. Proceeding AI 2015, Spring-er, in press. This paper proposed the non-rooted DAG classification model for multi-class hierarchical ensemble classification. The paper also presented
the application of breadth and depth pruning with respect to the proposed
non-rooted DAG classification model. The work presented in this paper is incorporated into Chapter 7 of this thesis.
1.9
Summary
This introductory chapter has presented a general overview and a background to the
research described in this thesis. The motivation for the research, the research question
together with the associated issues to be addressed, the adopted research methodology, evaluation data sets and criteria, and the contributions of the research have all been
presented. The main objective of the research is to utilise hierarchical ensemble
classifi-cation to provide a more effective classificlassifi-cation mechanism for multi-class classificlassifi-cation, especially in the context of datasets that feature a large number of class labels. The
next chapter (Chapter 2) provides a literature review aimed at providing the necessary


![Figure 2.2: Directed Binary Tree (DBT) example [72]](https://thumb-us.123doks.com/thumbv2/123dok_us/8065040.226554/50.596.179.456.158.377/figure-directed-binary-tree-dbt-example.webp)
![Figure 2.3: Decision Directed Acyclic Graph (DDAG) example [80]](https://thumb-us.123doks.com/thumbv2/123dok_us/8065040.226554/52.596.173.458.189.408/figure-decision-directed-acyclic-graph-ddag-example.webp)
![Figure 2.4: Adaptive Directed Acyclic Graph (ADAG) example [55]](https://thumb-us.123doks.com/thumbv2/123dok_us/8065040.226554/53.596.176.454.126.347/figure-adaptive-directed-acyclic-graph-adag-example.webp)