Commission
of the European Communities
European Coal and Steel Community
This publication is also available in the following languages:
DA ISBN 92-825-2851-0 DE ISBN 92-825-2852-9 GR ISBN 92-825-2853-7 FR ISBN 92-825-2855-3 IT ISBN 92-825-2856-1 NL ISBN 92-825-2857-X
Cataloguing data can be found at the end of this publication
Luxembourg: Office for Official Publications of the European Communities, 1982
ISBN 92-825-2854-5
Catalogue number: CB-33-81-295-EN-C
Articles and texts appearing in this document may be reproduced freely in whole or in part so long as their source is mentioned.
' ~·
European Coal and Steel Community
Commission of the European Communities
Roy Harris Jenkins Franc;:ois-Xavier Ortoli Wilhelm Haferkamp Finn Olav Gundelach Lorenzo Natali Henk Vredeling Claude Cheysson Guido Brunner Raymond Vouel Antonio Giolitti Richard Burke
Vicomte Etienne Davignon Christopher Samuel Tugendhat
Pr\i!sident Vice-President Vita-President Vice-President Vice-President Vice-President Member Member Member Member Member Member Member
Antonino Nicoletti, Director-General for Credit and Investments
As from 1 January 1976, the Commission of the European Communities adopted for its operations under the ECSC Treaty the unit of account al-ready used in other sectors of activity of the European Communities and known as the European unit of account (EUA).
This EUA is defined as equal to the sum of the following amounts of the national currencies of the Member States:
Deutschmark Pound sterling French franc Italian lira Dutch guilder Belgian franc Luxembourg franc Danish krone Irish pound
The value of the EUA is determined daily.
0,828 0,0885 1,15 109,00 0,286 3,66 0,14 0,217 0,00759
The daily calculation of the EUA equivalent in a Community currency is made by converting into that currency the above fixed amounts in each national currency composing the EUA on the basis of the official rates recorded on the exchange market of the country concerned. The day-to-day calculation into a non-Community currency of an amount in EUA is determined on the basis of the cross rate of this currency on a financial market of the Community which is considered to be representative by the Commission for the currency in question: in general this is the Brus-sels market.
The amounts which, in this report, are expressed in EUA and represent sums in national currencies have been calculated on the basis of the conversion rates for the European unit of account. On 31 December 1980 one EUA was equal to:
BFR 41,3351 LFR 41,3351
DKR 7,88723 UKL 0,549110
IRL 0,690185 SFR 2,31477
FF 5,93916 DM 2,56556
HFL 2,79081 LIT 1 217,30
USD 1,30963 CAD 1,55950
u.a. 0,566776 Et 0,700973
Nota: For technical reasons the Continental practice of using a comma instead of a decima~ point has been adopted in
Contents
Introduction . . . . . . . . . . . . . .. . . . . .. . . . . . . . . . . . . . . . . . . 8 Borrow-ings · ... -... · ... _ .. _. ._ . . . . . . . . . . . . . . . . . . . . . 1 0 '· Loans ... · . . . · ... · ... .-- .- .. · . . . , . . . .. . 18 ·_Changes i~ reserves and provisions ... ; . . . . . . . . . . . . . . . 33
Annexes
I - Main characteristics of loans outstanding at 31 December
1980 . . . . . . . . . . . . . . . . . . . . . . . . . . . . . . . . . . . . . . . 36 II - ECSC balance sheet at 31 December 1980 and 1979 . . . . . 42 Ill - ECSC revenue and expenditure for the years 1980 and
1979 . . . . . . . . . . . . . . . . . . . . . . . . . . . . . . . . . . . . . . . 44
Luxembourg, October 1981
This financial report covers the year 1980, the 28th year of the European Coal and Steel Community's existence and the 26th year of its borrowing and lending operations.
Since the entry into force of the Treaty establishing a Single Council and a Single Commission of the European Communities ( 1967). the Commission has exercised the powers vested in the former High Authority, each of the three Communities continuing to be governed by its own Treaty. Consequently, this report refers only to the 'C9mmission' of the European Communities unless it is absolutely necessary to use the name 'High Authority'.
Introduction
General economic situation
The second oil price increase at the end of 1979 once again dealt a severe blow to the Community economy. During 1980 the Community's economic growth became increasingly slow. After a period of expansion lasting about two and a half. years, the situation changed at the start of 1980 with the result that the gross domestic product in that year increased by only 1,3% as against 3,4% in 1979. Gross fixed capital formation also lost momentum: the average rate of increase in the Community fell. from 3,8% in the previous year to 2,1 %.
The slow-.down in growth combined with structural factors resi,Jited in a deterioration in the employment situation: i~ 1980 6,2% of the working population were unemployed, compared with 5,5% in 1979.
The renewed upsurge in inflation which began in 1979 became more pronounced in 1980; consumer prices in the Community rose on average by 13,8% in 1980, as against 10,0% in 1979. The divergences between consumer price increases in the individual Member States also increased, becoming double the average for the 1970s.
After the substantial surplus of 1978, the Commu-nity trade balance deteriorated quite markedly in 1979 and more particularly in 1980, when the final deficit was 21 800 million EUA. This resulted in a 5% deterioration in the terms of trade, caused mainly by the sharp increase in crude oil prices (movements in other raw materials prices and in the exchange rates of the Europe~n currencies had the opposite effect). The deterioration in the terms of trade was so pronounced that even the greater increase in the volume of exports as compared with imports could not prevent a trade deficit.
Steel
In 1980 world crude steel production fell by 4,5.% to 714 million tonnes. Production of crude steel in the European Community fell by 9,2% to 128 million tonnes, compared with 141 million in 1979, 133 million in 1978 and 126 million in 1977. Production · thus remained below the 1974 level.
The drop in production was accompanied by a fall-off in Community demand, marked by a decline in visible steel consumption which fell from about 126 million tonnes in 1979 to about 120 million tonnes in. 1980 (crude steel equivalent). Exports remained at
8
about the same level in 1980 as in 1979, that is approximately 25,5 million tonnes; imports, at 9,0 million tonnes in 1980, were slightly down on the previous year (9,4 million tonnes).
The drop in production meant a decline in the rate of utilization of production capacities. The rate of utilization of crude steel production potential sank from 69,2% in 1979 to 63,1% in 1980, while that for finished products decreased from 62,3% to 57,3% in the same period.
Because of the recession in the steel market, as early as January 1977 the Commission had introduced a system for adjusting supply to demand and issued recommendations to the steel-producing groups that they should observe certain limits on their deliveries within the Common Market. During the third quarter of 1980 demand for steel declined drastically both in the Community and the world markets. Rates of utilization in Community steelworks fell to extremely low levels. The continuing decline in the demand for steel and the collapse of prices in the Community threatened to lead to lasting structural damage in the European steel industry. In October 1980 the
Commission therefore, in accordance with the proce-dure laid down in Article 58 for cases of manifest cri-sis, introduced a system of production quotas and intervened directly in production on a mandatory basis in order to restore the balance between supply and demand.
At the same time the Commission applied to the Council for additional budgetary resources to enable additional measures to be taken to assist iron and steel workers affected by the steel crisis. Between 1974 and 1980 the average number of jobs in the Community iron and steel industry was reduced by about 1 56 000. Further reductions are expected in view of the demand trends for steel forecast by the Commission.
In 1980 the total value of newly decided investment projects notified to the Commission amounted to approximately 2 500 million EUA, which was similar to the figure for the previous year. The number of notifications of investment was however
considerably higher than in 1979.
Coal
In 1980, Community coal production stood at 245,4 million tonnes, an increase of about 3,5% over the previous year. In the Federal Republic of Germany, Belgium and the United Kingdom the increases amounted to 1 ,0%, 3,3% and 6,2% respectively, while a decrease was recorded in France (-2,8%).
Consumption also increased in 1980 by around 1% to 313,8 million tonnes, the main factor being the increase in consumption by the electricity industry, which is the most important outlet, accounting for about 59% of overall consumption. Demand from coking plants at 87,9 million tonnes and industry at 16,1 million tonnes remained at the levels of the previous year, but there was a significant decline (10%) in household consumption to 17,9 million tonnes.
Pithead stocks increased in 1980 by about 1 0, 7 million tonnes, while imports from non-Community countries reached a record level of 74,5 million tonnes (an increase of 25%). The increase was accounted for mainly by supP,Iies from the United States and South Africa, which were responsible for 38% and 26% respectively of total Community imports. Intra-Community trade, on the other hand, fell slightly to 16,1 million tonnes; deliveries from the Federal Republic of Germany, the Community's biggest exporter, fell to 10,9 million tonnes, a decrease of 21% compared with 1979.
1 . The situation on capital
markets in 1980
10
Borrowings
Borrowing conditions remained very difficult during 1980 on most capi-tal markets. The worsening inflationary strains resulting in particular from the successive rises in oil prices and also the uncertainty connect-ed with the situation in the Near and Middle East were largely respon-sible for this situation. In the United States, the adoption of a restrictive monetary and budgetary policy caused interest rates to rise sharply, al-though this trend was interrupted in the second quarter, when fears of a worsening recession led to a temporary relaxation of this policy.
In most industrialized countries, widening balance-of-payments deficits were a further factor pushing up interest rates. As rates were rising in the United States, they also went up both on national capital markets and on the Euro-dollar market. In Europe, they maintained their upward tendency until the end of 1980, although there was some easing in the middle of the year.
On a number of financial markets, short-term interest rates reached ex-ceptionally high levels, higher than those of long-term rates. It has there-fore become very difficult to raise long-term funds through conventional fixed-rate bond issues, and· such issues have had to be concentrated on the few periods in which there was an easing of long-term rates. This situation led to an increase in variable-rate issues denominated in dollars and, towards the end of the year, an upturn in stock market prices boosted convertible bond issues. In the United Kingdom, only one
,----~~--- · · -·-I
I Table 11 lin miffion EUA)
I
I
I
I
Currency Total contracted
borrowed borrowings2 Repayments Balance outstanding
USD 2 747,34 591,71 2 155,63
DM 1 957.47 474,70 1 482,77
LIT 127,33 58,82 68,51
FF 594,53 72,04 522,49
HFL 208,09 77,79 130,30
SFR 1 004,33 495,86 508,47
BFR. 236,36 60,09 176,27
LFR 252,93 77,12 175,81
t
71,33 71,33-u.a. 35,29 20,64 14,65
CAD 48,09 - 48,09
UKL 127.48 4,73 122,75
Total 7 410,57 2 004,83 5 405,74
1
The ma~n characteristics of the borrowings outstanding by the ECSC at 31 December 1980 and those of the u.a. are given in Annex I.
2 A her adjustment for the new exchange rates adopted for the conversion of natiOnal currencies to European units
ECSC borrowings between 1954 and 31 December 1980
LIT
UKL
E
2. ECSC borrowings
in 1980
12
foreign issue was floated following the abolition of the relevant restric-tions, while the amount of Euro-sterling issues increased rapidly. In the FR of Germany, the amount of foreign public issues denominated in German marks remained at roughly the same level as in 1979, despite many strains caused by the deterioration in the country's current ac-count .. In France, the maintenance of positive real interest rates and the lead enjoyed by bond market rates helped to boost issues on this mar-ket. Similarly, the amount of issues denominated in Euro-francs increas-ed sharply. Issues denominatincreas-ed in Belgian and Luxembourg francs fell, reflecting exchange market pressures on these currencies, while place-ments in Dutch gL:Jilders increased.
Outside the Community, the amount of foreign public issues fell in Japan, but remained the same in Switzerland.
The main Community currencies borrowed were the Deutschmark and the French franc, and the only non-Community currencies borrowed were the US dollar and the Swiss franc. Borrowings in the currencies of Member States accounted for 72% of the total raised on the capital markets.
The borrowings contracted by the ECSC in 1980 totalled 1 004,1 mil-lion EUA.
The main characteristics of the loans contracted during 1980 are given on pages 14 and 15 ..
Including its operations in 1980, total borrowings contracted by the ECSC since its inception up to 31 December 1980 reached the equiva-lent of 7 41 0, 57 million EUA.
Loans contracted
by
the ECSC in
1980
Kind of loan Currency Rate Issue price of interest %
Debenture LFR 500 10 10 99
Debenture FF 150 141/4 6 99
Debenture FF 400 14 12 100
Debenture USD 100 111/2 8 100
Debenture USD 25 11 7 100
Debenture USD 50 111/4 10 993/4
Debenture DM 150 77/a 12 100
Debenture DM 150 9112 8 100
Debenture SFR 80 6 10 100
Debenture UKL 20 131/2 8 100
Private placement FF 20 12,225 12
Private placement FF 80 123/4
a
13'/4 15Private placement FF 20 13,30 5
Private placement FF 10 13,60 5
Private placement FF 20 13,95 8
Private placement FF 15 14,30 7
Private placement FF 20 14,30 7
Private placement DM 50 9,65 10
Private placement DM 40 83/4 8
Private placement DM 70 81/4 8
Private placement DM 35 81/s 8
Private placement DM 10 81/a 8
Private placement DM 50 81/a 8
Private placement DM 12 8-10 12
Private placement DM 12 8 12
Private placement DM 12 8 12
Private placement DM 12 7,90 12
Private placement DM 250 8,35 8
Private placement LFR 250 12-10 8
Private placement LFR 400 113/4 8
Private placement BFR 500 131/2 8
Private placement BFR 2 000 133/a 8
Private placement SFR 38 51/4 6
Private placement SFR 17 51/4 6
Private placement SFR 30 61/4 5
Private placement SFR 20 57/a 5
Private placement HFL 50 1 07/s 15
Private placement UKL 25 17-143/4 5
Repayment lin millions)
From 1983 7 instalments of 25 and the last of 325
Whole amount in 1986
66,6 in 1982-84-86-88, 66,8 in 1990-92
From 1985, 4 equal instalments
Whole amount in 1985
From 1984, 4 instalments of 8 and 3 instalments of 6
From 1985, 8 equal instalments
From 1985, 4 equal instalments
From 1986, 4 equal instalments of 1 0 and the last of 40
Whole amount in 1 988
From 1985, 8 equal instalments
10 in 1985, 30 in 1990, 40 in 1995
Whole amount in 1985
Whole amount in 1985
Whole amount in 1988
Whole amount in 1987
From 1984, 4 equal instalments
Whole amount in 1988
From 1985, 4 equal instalments
From 1985, 4 equal instalments
From 1985, 4 equal instalments
From 1985, 4 equal instalments
From 1985, 4 equal instalments
From 1985, 8 equal instalments
From 1985, 8 equal instalments
From 1985, 8 equal instalments
From 1985, 8 equal instalments
From 1985, 4 equal instalments
From 1985, 4 equal instalments
From 1985, 4 equal instalments
Whole amount in 1988
From 1985, 4 equal instalments
Whole amount in 1986
Whole amount in 1986
Whole amount in 1985
From 1984, 2 equal instalments
From 1986, 1 0 equal instalments
Whole amount in 1985
' - - - --- -
--Quotation
Stock Exchange
Luxembourg
Luxembourg Paris
Luxembourg
Luxembourg- Singapore Luxembourg
Frankfurt, Berlin, Dusseldorf, Hamburg, Munich Frankfurt, Berlin, Dusseldorf, Hamburg, Munich
B§le, Berne, Geneva, Lausanne, Zurich
Luxembourg
TOTAL BORROWINGS UP TO 31 DECEMBER 1980
AmoLnts in million European units of account
r 7 6 0 0 - 7500- 7400- 7300- 7200- 7100- 6900- 6800-6 700- 6600-6 500- 6400-6 300- 6200- 6100- 6000- 5900- 5800-5 700- 5600-5 5600- 500- 5400-5 300-5 200- 5100- 5000- 4900- 4800- 4700- 4600- 4500- 4400- 4300- 4200- 4100- 4000- 3900- 3800- 3700- 3600- 3500- 3400- 330o- 32oo- 3100- 3000- 2900- 2800- 2700- 2600- 2500- 2400- 2306- 2200- 2.100- 2000- 1900- 1800- 1700- 1600- 1500- 1400-
,300l 2 0 0
100-BREAKDOWN BY SECTOR OF LOANS DISBURSED AND GUARANTEES GRANTED UP TO 31 DECEMBER 1980
Amounts in million European units of account
7600
-7500
-
7400-
7300-7 200 -7100
-7000
-6900
-6800
-'s 7oo-ssoo
-6500
-
6400-6 300
-6200 -6100 -6000 -5900 - 5800-5700 -5600 - 5500-5400 -5300 -
5200-5100
-5000 -4900 -4800 -4700 - 4600-4500 -4400
-4 300
-4200
-4100
-4000
-3 900
-3800 -3700 -3600 -3500 - 3400- 3300-3200 -3 100-3000 - 2900-2800 -2700 - 2600-2500 -2400 - 2300-2200
-2100
-2000
-
1900-1800
-1700 -1600
-1500 -1400 -1300 -1200 -1100 -1000 -900 -800 - 700-600 -
5004 0 0
-300
-200 -
100-Miscellaneous
Readaptation and industrial redevelopment and reconversion Workers' housing
- Industrial loans
1955 56 57 58 59 60 61 62 63 64 65 66 67 68 69 70 71 72 73 74 75 76 77 78 79 80
ECSC lending and
guarantee operations
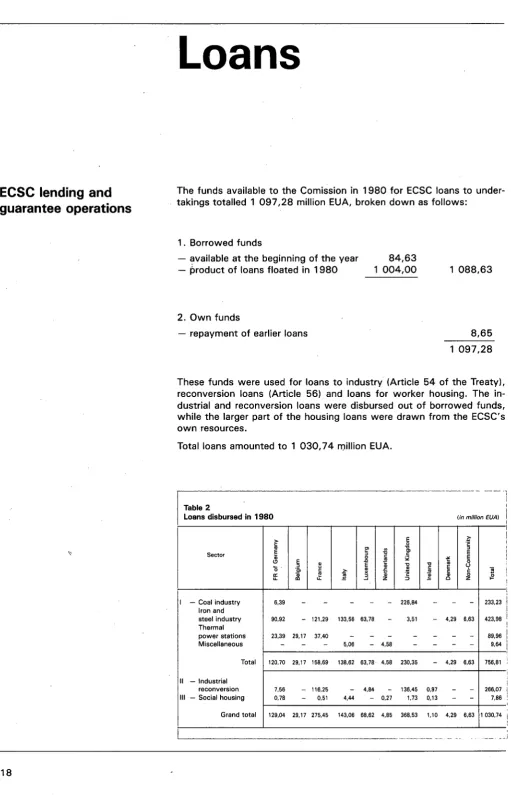
Loans
The funds available to the Comission in 1 980 for ECSC loans to under-takings totalled 1 097,28 million EUA, broken down as follows:
1 . Borrowed funds
- available at the beginning of the year - product of loans floated in 1980
2. Own funds
- repayment of earlier loans
84,63
1 004,00 1 088,63
8,65
1 097,28
These funds were used for loans to industry (Article 54 of the Treaty), reconversion loans (Article 56) and loans for worker housing. The in-dustrial and reconversion loans were disbursed out of borrowed funds, while the larger part of the housing loans were drawn from the ECSC's own resources.
Total loans amounted to 1 030,74 rt;~illion EUA.
--- ---1
Table 2
!
Loans disbursed in 1980 (in million EUA)
> E .~
c 0 c
..
~ "' "C"
E
"'
ESector
"
"C ciD 0 c
"
-!!! EC) E ~ .0
..
0E li "C "C
..
uo· '6>
"
u c c E:?:
"
"" .~..
c i= ]!!
a: Q; ~ X ~
c ~
"
0~
"
~LL
"'
LL --' z :::> 0 zI
I - Coal industry 6,39 - - - 226,84 - - - 233,23
Iron and
steel industry 90,92 - 121,29 133,56 63,78 - 3,51 - 4,29 6,63 423,98
Thermal
power stations 23,39 29,17 37,40 - - - 89.96 I
Miscellaneous - - - 5,06 - 4,58 - - - - 9,64
Total 120,70 29,17 158,69 138,62 63,78 4,58 230,35 - 4,29 6,63 756,81 '
·,
II - Industrial
i
reconversion 7,56 - 116,25 - 4,84 - 136,45 0,97 - - 266,07 i
Ill - Social housing 0,78 - 0,51 4,44 - 0,27 1,73 0,13 - - 7,86 I
'
Grand total 129,04 29,17 275.45 143,06 68,62 4,85 368,53 1,10 4,29 6,63 1 030,74 I '
[image:16.583.41.553.22.834.2]--ECSC loans between
1954 and 31 December 7980
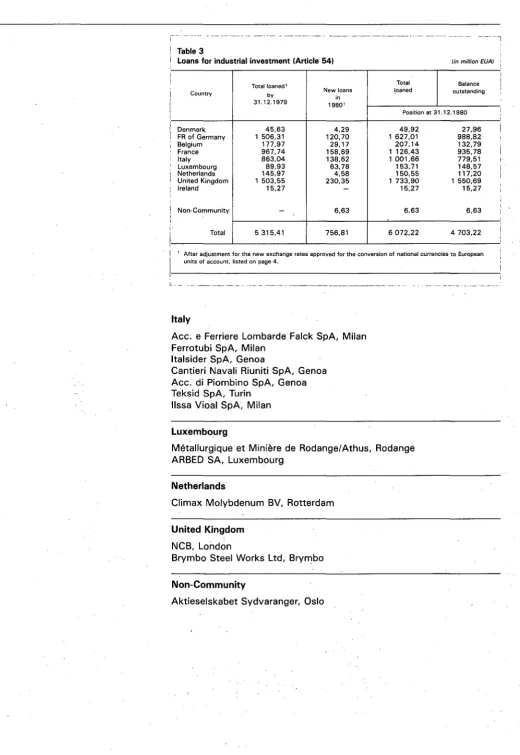
1 . Industrial loans (Article 54)
1980 was marked by an increase in the number of loans granted for in-dustrial investment projects pursuant to Article 54 of the ECSC Treaty.
Loans granted totalled 756,81 million EUA.
A substantial portion of industrial loans was used for restructuring pro-jects in the iron and steel industry. In accordance with the criteria laid down in the Commission communication of 22 July 1977, some under-takings received loans at reduced rates of interest for projects of this kind.
Other categories of loans - for environmental protection projects, for vocational training and research centres and for safeguarding the supply of raw materials - were also granted at reduced rates of interest.
The Commission also continued to attach particular importance to the financing of projects outside the Community for the purpose of safe-guarding the supply of raw materials for the Community iron and steel industry. It is interested in increasing its involvement in this sector in cooperation with ECSC undertakings and producers in third countries.
As part of the Community's energy policy, a large proportion of ECSC loans was used to finance projects in the coal industry. A total of 233,23 million EUA was disbursed for projects aimed at the moderniz-ation and amalgammoderniz-ation of mines.
In accordance with the criteria set out in the Commission communica-tion of 29 March 1980, some loans were granted at reduced rates of interest.
Loans totalling 89,96 million EUA were granted for the financing of power plants to be fuelled with Community coal.
The loans to industry disbursed in 1980 went to the following undertak-ings:
Federal Republic of Germany
Thyssen AG, Duisburg Steag und VEW, Bergkamen Fried. Krupp AG, Bochum
Roehling-Burbach GmbH, Volklingen Edelstahlwerke Buderus AG, Wetzlar
Westfalische Berggewerkschaftskasse, Bochum Saarbergwerke AG, Saarbrucken
Krupp Stahl AG, Bochum Steag-RWE OHG, Voerde
Belgium
Ebes, Antwerp Intercom, Brussels
Denmark
Danske Staalvalsevcerk A/S, Frederiksvcerk
France
Charbonnages de France, Paris Sollac, Paris
!
i
-~ --- ~ ~---~---
- -
- - - --- - - - - -~--,
Table 3
Loans for industrial investment (Article 54) (in million EUAI :
Total Balance Total loaned 1
New loans loaned outstanding
Country by
in 31.12.1979 19801
Position at 31.12.1980
Denmark 45,63 4,29 49,92 27,96
FR of Germany 1 506,31 120,70 1 627,01 988,82
Belgium 177,97 29,17 207,14 132,79
France 967,74 158,69 1 126,43 935,78
Italy 863,04 138,62 1 001,66 779,51
Luxembourg 89,93 63,78 153,71 148,57
Netherlands 145,97 4,58 150,55 117,20
United Kingdom 1 503,55 230,35 1 733,90 1 550,69
Ireland 15,27 - 15,27 15,27
Non-Community - 6,63 6,63 6,63
Total 5 315,41 756,81 6 072,22 4 703,22
1 After adjustment for the new exchange rates approved for the conversion of national currencies to European
units of account, listed on page 4.
i
I !
I
' '
I
'i
I
I i
I
I
I
:
'
f l
L __ ~- - - . - -
-~--·---Italy
Ace. e Ferriere Lombarde Falck SpA, Milan Ferrotubi SpA, Milan
ltalsider SpA, Genoa
Cantieri Navali Riuniti SpA, Genoa Ace. di Piombino SpA, Genoa Teksid SpA, Turin
IIssa Vioal SpA, Milan
Luxembourg
Metallurgique et Miniere de Rodange/Athus, Rodange ARBED SA, Luxembourg
Netherlands
Climax Molybdenum BV, Rotterdam
United Kingdom
NCB, London
Brymbo Steel Works Ltd, Brymbo
Non-Community
Aktieselskabet Sydvaranger, Oslo
[image:19.585.43.563.21.775.2]2. Loans for industrial reconversion (Article 56)
The restructuring of the iron and steel industry has already resulted in a considerable reduction in the number of jobs, which fell from 792 000 in 1974 to 636 000 in 1980, and further major cuts seem necessary. As in · the past, the Commission tried to encourage the creation of new jobs in other sectors by means of loans at reduced rates of interest. It also in-creased its support for small and medium-sized undertakings. To achieve greater effectiveness it acted through certain financial institutions to which it granted global loans, the product of which was reloaned to that category of undertakings. These loans totalled 266,07 million EUA in 1980, which was inore than four times as much as in the previous year. For the first time ECSC reconversion loans amounted to a quarter of the total disbursements. The loans are intended to help create 11 450 jobs.
Reductions in interest rates may be applied to all or part of the loans granted pursuant to Article 56 of the ECSC Treaty. For a period of five years the interest rate payable on such loans is three percentage points below the normal rate, which is set in accordance with the correspond-ing borrowed funds. The lower rate was granted on condition that a por-tion of the new jobs created would be reserved primarily for workers made redundant in the ECSC industries.
Under the terms of the Treaty, requests for loans of this type are submit-ted to the Commission by the government of the Member State concern-ed. The geographical distribution of the loans granted therefore largely reflects the national policies on reconversion. Loans were granted to the following undertakings:
Federal Republic of Germany
Stahlwerke Roehling-Burbach GnibH, Volklingen
Saarlandische lnvestitionskreditbank, Saarbrucken (for small and me-dium-sized underta~ings)
France
Banque Populaire de Ia Loire, Saint~Etienne (for small and medium-sized undertakings)
Banque Populaire du Nord, Lille (for small and medium-sized undertak-ings)
SOFIREM, Soc. Financiere. pour favoriser !'Industrialisation des Regions Minieres, Paris (for Silvallac)
Societe de Mecanique Lorraine (SML), Maiziere-les-Metz Soc. Mecanique Automobile de I'Est (SMAE), Metz
Soc. Franc;:aise de Mecanique, Automobiles Peugeot and Regie Natio-nale des Usines Renault, Douvrin
Societe Mecanique Automobile du Nord (SMAN), Paris Rockwool Isolation, Paris
Credit National, Paris (for small and medium-sized undertakings)
Societe de Developpement Regional de Lorraine (LORDEX), Nancy (for small and medium-sized undertakings)
. Soc. Valenciennoise d'Equipements petroliers (SOVEP), Cosne
Ireland
Industrial Credit Company, Dublin (for Runtalrad and Eurolift)
Luxembourg
ABF. PLASTIC, La Ricamarie The new FMC machine
26
United Kingdom
Finance for Industry, London (for small and medium-sized undertakings) Rothmans International Ltd, Basildon/Essex
Daniel Doncaster, Sheffield
Girling Midland Ross Air Actuation Ltd, Birmingham Natural Gas Tubes Ltd
Cameron Breweries, Hartlepool
FHS Automotive Parts Manufacturing Ltd, Cardiff Wiggins Teape; Basingstoke
Sheepbridge Stokes Ltd, Chesterfield Sony UK Ltd, Sunbury-on-Thames
Dynoplast Ltd, North Seaton Industrial Estate, Ashington Alfred Teves, London
Ford Motor Co. Ltd, Brentwood Mckellar Watt Ltd, Glasgow Lightning Fastners Ltd, Witton
r---
-I Table 4
I
1 Loans for industrial reconversion (Article 56) A - Breakdown by countryCountry Total loaned New loans
by 31.12.1979' in 19801
Denmark -
-FR of Germany 206.44 7,56
Belgium 53,58
-France 171,74 116,25
Italy 66,82
-Luxembourg 4,06 4,84
Netherlands 29,08
-United Kingdom 92,71 136.45
Ireland 0.47 0,97
Community 624,90 266,07
lin million EUA)
Total Balance loaned outstanding
Position at 31 . 1 2. 1 980
-
-214,00 115,37
53,58 19,28
287,99 234,52
66,82 40,50
8,90 8,35
29,08 10,80
229,16 204,16
1.44 1.44
890,97 634.42
1 After adjustment for the new exchange rates adopted for the conversion of national currencies to European units
of account, listed on page 4.
B - Breakdown by industry
I
Catagory Amount fin million EUA) %I
1. Manufacture of motor vehicles
and accessories 275,9 30,97
2. Iron and steel industry 145,9 16,38
3. Coal, gas 66,5 7.46
4. Global loans 63,2 7,09
5. Chemicals 61,8 6,94
6. Non-ferrous metals 32,0 3,59
7. Food industries 29.4 3,30
8. Industrial estates 27,8 3,12
9. Paper and printing 26,2 2,94
1 0. Mechanical engineering 25,6 2,87
11. Rubber 22,8 2,56
12. Power stations 22,2 2.49
13. Cast iron, steel and other
metal products 21,1 2,37
14. Textiles and clothing 12,5 1.40
15. Electrical equipment 12,1 1,36
16. Ceramic ware, glass, lime and stone 11,9 1,34
1 7. Joinery and furniture manufacture 10,9 1,22
1 8. Processing of plastics 6,0 0,67
19. Miscellaneous 17,2 1,93
of which Aeronautical engineering 4,5 Metal engineering 1,5
Transport 1,3
-Total 891:0 100,00
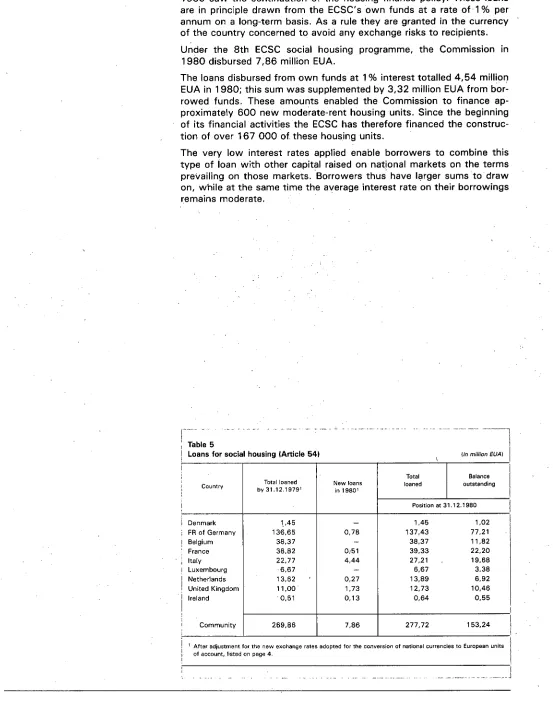
3. Loans for housing (Article 54)
1980 saw the continuation of the housing finance policy. These loans are in principle drawn from the ECSC's own funds at a rate of 1 o/o per annum on a long-term basis. As a rule they are granted in the currency of the country concerned to avoid any exchange risks to recipients.
Under the 8th ECSC social housing programme, the Commission in 1980 disbursed 7,86 million EUA.
The loans disbursed from own funds at 1 o/o interest totalled 4,54 million EUA in 1980; this sum was supplemented by 3,32 million EUA from bor-rowed funds. These amounts enabled the Commission to finance ap-proximately 600 new moderate-rent housing units. Since the beginning of its financial activities the ECSC has therefore financed the construc-tion of over 167 000 of these housing units.
The very low interest rates applied enable borrowers to combine this type of loan with other capital raised on national markets on the terms prevailing on those markets. Borrowers thus have larger sums to draw on, while at the same time the average interest rate on their borrowings remains moderate.
~---- -
-Table 5
Loans for social housing {Article 541
i
Total Balance Country Total loaned New loans loaned outstanding
by31.12.19791
in 19801
Position at 31. 1 2. 1980
i
Denmark 1.45 - 1.45 1,02FR of Germany 136,65 0,78 137.43 77,21
Belgium 38,37 - 38,37 11,82
France 38,82 0;51 39,33 22,20
Italy 22,77 4.44 27,21 19,68
Luxembourg ·6,67
-
6,67 3,38Netherlands 13,62 0,27 13,89 6,92
United Kingdom 11,00 1,73 12,73 10.46
Ireland 0,51 0,13 0,64 0,55
Community 269,86 7,86 277,72 153,24
I
I
I
1 After adjustment for the new exchange rates adopted for the conversion of national currencies to European units
I
of account, listed on page 4.
29
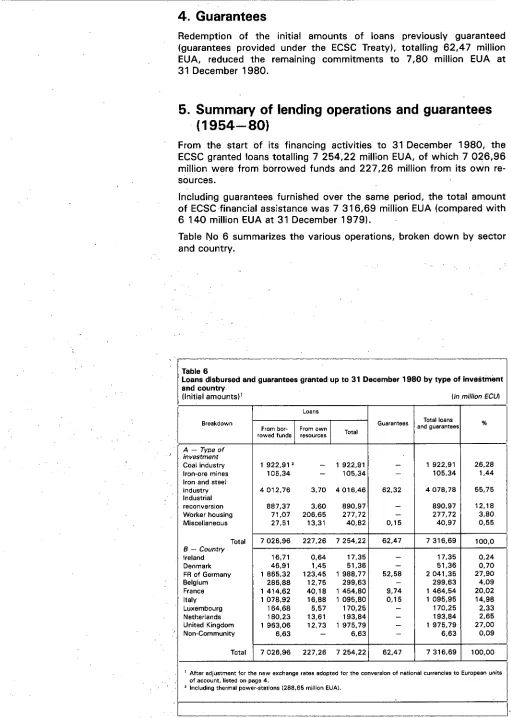
[image:23.582.29.582.82.786.2]4. Guarantees
Redemption of the initial amounts of loans previously guaranteed (guarantees provided under the ECSC Treaty), totalling 62,4 7 mi)lion EUA, reduced the remaining commitments to 7,80 million EUA at 31 December 1980.
5. Summary of lending operations and guarantees
(1954-80)
From the start of its financing activities to 31 December 1980, the ECSC granted loans totalling 7 254,22 million EUA, of which 7 026,96 million were from borrowed funds and 227,26 million from its own re-sources.
Including guarantees furnished over the same period, the total amount of ECSC financial assistance was 7 316,69 million EUA (compared with 6 140 million EUA at 31 December 1979).
Table No 6 summarizes the various operations, broken down by sector and country.
Table 6
Loans disbursed and guarantees granted up to 31 December 1980 by type of investment and country
(Initial amounts) 1 (in million ECUI
Loans
Breakdown Guarantees Total loans %
From bar-
I
From ownI
and guaranteesrowed funds resources Total
A -Type of investment
Coal industry 1 922,912
-
1 922,91 - 1 922,91 26,28Iron-ore mines 105,34 - 105,34 - 105,34 1,44
Iron and steel
industry 4 012,76 3,70 4 016.46 62,32 4 078,78 55,75
Industrial
reconversion 887,37 3,60 890,97 - 890,97 12,18
Worker housing 71,07 206,65 277,72 - 277,72 3,80
Miscellaneous 27,51 13,31 40,82 0,15 40,97 0,55
Total 7 026,96 227,26 7 254,22 62,47 7316,69 100,0
8 - Country
Ireland 16,71 0,64 17,35 - 17,35 0,24
Denmark 46,91 1,45 51,36 - 51,36 0,70
FR of Germany 1 865,32 123,45 1 988,77 52,58 2 041,35 27,90
Belgium 286,88 12,75 299,63 - 299,63 4,09
France 1 414,62 40,18 1 454,80 9,74 1 464,54 20,02
Italy 1 078,92 16,88 1 095,80 0,15 1 095,95 14,98
Luxembourg 164,68 5,57 170,25 - 170,25 2,33
Netherlands 180,23 13,61 193,84 - 193,84 2,65
United Kingdom 1 963,06 12,73 1 975,79 - 1 975,79 27,00
Non-Community 6,63 - 6,63 - 6,63 0,09
Total 7 026,96 227,26 7 254,22 62,47 7 316,69 100,00
1 After adjustment for the new exchange rates adopted for the conversion of national currencies to European units
of account, ·listed on page 4.
' Including thermal power-stations 1288,65 million EUA).
-I
[image:24.582.34.545.47.765.2]I
Changes in reserves and provisions
The table below shows the changes in ECSC reserves and provisions between 31 December 1979 and 31 December 1980.
Table 7 (in million EUA)
Position at Changes Position at
I
31.12.1979 in 1980 31.12.1980Reserves
- Guarantee fund 230,00 30,00 260,00
- Special reserve 140,00 3,50 143,50
- Former pension fund 41,53 0,32 41,85
Budgetary provisions
(a) for rehabilitation of workers 189,57 25,71 215,28
(b) for technical and
economic research 73,38 4,61 77,99
(c) assistance (Article 56) 20,56 23,15 43,71
(d) assistance (Article 54) 17,69 18,19 35,88
(e) assistance to coking coal 8,82 -4,94 3,88
Other provisions 105,03 14,23 119,26
Total 826,58 114,77 941,35
I
Unallocated balance 0,42 -0,28 0,14
Grand total 827,00 114,49 941,49
I
Revenue from the levy, which has been fixed at 0,31% since 1 January 1980 amounted to 116,60 million EUA in 1980, compared with 103,24 million EUA in 1979. This total comprises 28,80 million EUA from coal production and 87,80 million EUA from iron and steel production.
Revenue resulting from the management of liquid assets, i.e. from inter-est on own resources invinter-ested, was 74,68 million EUA and income from borrowed funds not yet disbursed was 22,11 million EUA.
Apart from this contribution to an icrease in reserves, these interest re-ceipts on own resources have enabled the Commission to finance direct aid (rehabilitation of workers, technical research, assistance to coking coal) and reduced interest loans, in accordance with the social, regional and industrial objectives of the Community.
[image:25.582.207.544.153.401.2]Annexes
I - Main characteristics of loans outstanding at
31 December 1980
II - ECSC balance sheet at 31 December 1980
and 1979
Annex I
Main characteristics of loans outstanding at 31 December 1980
Initial amount
Year of Interest Term Balance outstanding at
issue % p.a. I years)
I
equivalent in European 31.12.1980 lin Euro-in currency
units of account pean units of account)
1962 51/4 20 USD 25 000 000 1 9 089 361 '12 2 710 689,29
1964 51/4 20 30 000 000 22 907 233,34 6 108 595,56
1966 61/2 20 15 000 000 11 453 616,67 4 581 446,67
1966 6'/2 20 20 000 000 15 271 488,89 5 994 059,39
1967 61
/2 20 25 000 000 19 089 361 '12 8 704 748,67
1967 65/a 20 20 000 000 15 271 488,89 7 024 884,89
1973 7 15 30 000 000 22 907 233,34 20 616 510,01
1974 73/4 15 50 000 000 38 178 722,23 30 924 765,01
1974 91/4 8 100 000 000 76 357 444.47 76 357 444,47
1974 91/2 10 100 000 000 76 357 444.47 61 085 955,58
1974 10 10 200 000 000 152 714888,94 122171 911,15
1975 83/a 8 150 000 000 114536166,70 114 536 166,70
1975 83/4 7 50 000 000 38 178 722,23
30 542 977' 78
1976 83/4 5 65 000 000 49 632 338,90 49 632 338,90
1976 91/4 10 60 000 000 45 814 466,68 38 1 78 722,23
1976 9 7 50 000 000 38 178 722,28 38 178 722,23
1976 85/a 8 75 000 000 57 268 083,35 57 268 083,35
1976 9 20 100 000 000 76 357 444,47 76 357 444,4 7
1976 81
/2 10 23 000 000 17 562 212,23 13171 659,17
1976 T/a 5 30 000 000 22 907 233,34 22 907 233,34
1976 81/a 8 75 000 000 57 268 083,35 57 268 083,35
1976 87/a 20 75 000 000 57 268 083,35 57 268 083,35
1976 8 7 30 000 000 22 907 233,34 22 907 233,34
1977 71/4 5 50 000 000 38 178 722,23 38 1 78 722,23
1977 81/4 10 10 000 000 7 635 744,45 7 635 744.45
1977 73/4 5 25 000 000 19 089 361 '12 1 9 089 361 '1 2
1977 91/a 20 75 000 000 57 268 083,35 57 268 083,35
1977 75/a 7 30 000 000 22 907 233,34 22 907 233,34
1977 9 18 50 000 000 38 178 722,23 34 169 956,39
1977 81/a 5 20 000 000 15 271 488,89 15 271 488,89
1977 8 19 25 000 000 19 089 361 '12 12 217 191,12
1977 83/4 15 42 000 000 32 070 126,68 32 070 126,68
1977 81/4 12 50 000 000 38 178 722,23 38 178 722,23
1977 83/4 20 100 000 000 76 357 444,47 69 103 487,24
1978 83/a 7 30 000 000 22 907 233,34 22 907 233,34
1978 8'/2 8 40 000 000 30 542 977' 79 30 542 977' 79
1978 8'/2 12 20 000 000 15 271 488,89 1 5 271 488,89
1978 83/4 10 15 000 000 11 453 616,67 11 453 616,67
1978 83/4 9 20 000 000 15 271 488,89 15 271 488,89
1978 83/4 9 15 000 000 11 453 616,67 11 453 616,67
1978 9 15 25 000 000 1 9 089 361 '12 17 791 284,56
1978 91/4 20 25 000 000
19 089 361 '12 17 791 284,56
1978 93/a 15 30 000 000 22 907 233,34 22 907 233,34
1978 91/lo 10 25 000 000 19 089 361,12
1 9 089 361 '1 2
1978 83/4 9 50 000 000 38 178 722,23 38 178 722,23
1978 9 10 20 000 000 15 271 488,89 15 271 488,89
1978 91
/2 15 25 000 000 1 8 089 361 '12 19 089 361,12
1978 91/2 15 20 000 000 15 271 488,89 15 271 488,89
1978 9'/2 15 20 000 000 15 271 488,89 15 271 488,89
1978 9112 15 10 000 000 7 635 744,45 7 635 744,45
1978 91/4 12 18 000 000 13 744 340,00 13 744 340,00
1978 91/4 12 40 000 000 30 542 977,79 . 30 542 977,79
1978 9-93/4 20 50 000 000 38 178 722,23 38 178 722,23
1979 111/4-91/4 12 15 000 000 11 453 616,67 11 453 616,67
1979 93/4 10 10 000 000 7 635 744,45 7 635 744,45
Annex I
Main characteristics of loans outstanding at 31 December 1980
Initial amount
Year of Interest Term Balance outstanding at
issue % p.a. (years)
I
equivalent in European 31.12.1980 (inEuro-in currency
units of account pean units of account)
1979 11 1/2-93/s 10 USD 20 000 000 15 271 488,89 15 271 488,89
1979 103/4-9 1/4 12 150 000 000 114 536 166,70 114 536 166,70
1979 93/4 20 125 000 000 95 446 805,59 95 446 805,59
1979 12-101/2 7 100 000 000 76 357 444.47 76 357 444.47
1980 11 1/2 8 40 000 000 30 542 977,79 30 542 977' 79
1980 115/s 10 50 000 000 38 1 78 722,23 38 178 722,23
1980 11 1/2 8 100 000 000 76 357444,47 76 357 444.47
1980 11 7 25 000 000 19 089 361 '12 19 089 361 ,12
1980 111/4 10 50 000 000 38 178 722,23 38 178 722,23
2 335 010 651,81 2 171 300 290,87
1955 33/4 25 DM 50 000 000 19 488 922,50 1 169,33
1965 51/2 18 150 000 000 58 466 767,49 13 447 356,53
1968 6 1/4 13 60 000 000 23 386 707,- 2 338 670,70
1969 6 1/4 15 40 000 000 15 591 138,- 6 236 455,20
1969 6 1/2 13 50 000 000 19 488 922,50 3 897 784,50
1971 71/2 15 100 000 000 38 977 844,99 23 386 706,99
1972 61/2 15 100 000 000 38 977 844,99 27 284 491,49
1972 7 15 150 000 000 58 466 767,49 40 926 737,24
1973 6 1/2 15
' 1973 73/4 15 150 000 000 100 000 000 58 466 767,49 38 977 844,99 46 773 413,99 31 182 275,99
1974 10 7 50 000 000 19 488 922,50 19 488 922,50
'""!' 1974 9
3
/4 7 150 000 000 58 466 767.49 58 466 767.49
1975 8 1/2 10 56 000 000 21 827 593,20 13 642 245,75
1975 8 1/2 7 20 000 000 7 795 569,00 7 795 569,00
1975 81/2 10 150 000 000 58 466 767.49 36 541 729,68
1975 8 7 150 000 000 58 466 767,49 58 466 767.49
1976 73/4 10 80 000 000 31 182 275,99 23 386 706,99
1976 8 1/4 10 45 000 000 17 540 030,25 8 770 015,13
1976 8 5 50 000 000 19 488 922,50 19 488 922,50
1976 73/4 7 125 000 000 48 722 306,24 48 722 306,24
1976 73/4 10 75 000 000 29 233 383,74 29 233 383,74
1977 7 12 81 630 000 31 817 614,87 31 817 614,87
1977 7 12 19 800 000 7 717 613,31 7717613,31
1977 6 12 16 000 000 6 236 455,20 6 236 455,20
1977 6 12 32 000 000 12 472 910,40 12 472 910.40
1977 53/4 8 20 000 000 7 795 569,00 4 872 230,63
1977 51/2 8 20 000 000 7 795 569,00 4 872 230,63
1977 51/2 8 20 000 000 7 795 569,00 4 872 230,63
1977 51/2 8 20 000 000 7 795 569,00 4 872 230,63
1977 6 14 98 000 000 38 1 98 288,09 30 012 940,64
1977 51/2 8 18 000 000 7 016 012,10 4 385 007,57
1977 51/:i 8 12 000 000 4 677 341.40 2 923 338,38
1977 6 1/s 10 25 000 000 9 744 461,25 9 744 461,25
1978 53/4 10 30 000 000 11 693 353,50 11 693 353,50
1978 57/s 10 20 000 000 7 795 569,00 7 795 569,00
1978 5 1/4 12 150 000 000 58 466 767,49 58 466 767,49
1978 6 1/2 15 15 000 000 5 846 676,75 5 846 676,75
1978 61/2 15 50 000 000 19 488 922,50 1 9 488 922,50
Annex I
Main characteristics of loans outstanding at 31 December 1980
Initial amount
Year of Interest Term Balance outstanding at
issue % p.a. (years)
I
equivalent in European31.12.1980 lin
Euro-in currency
units of account pean units of account}
1978 6 12 OM 70 000 000 27 284 491,50 27 284 491,50
1978 61/2 15 32 400 000 12 628 821,78 12 628 821,78
1978 6 1/4 10 9 000 000 3 508 006,05 3 508 006,05
1978 6 10 150 000 000 58 466 767,49 58 466 767,49
1978 61/2 6 16 200 000 6 314 410,89 4 209 607,27
1978 6 1/2 12 20 000 000 7 795 569,00 7 795 569,00
1978 63/4 10 20 000 000 7 795 569,00 7 795 569,00
1978 6 6 20 000 000 7 795 569,00 7 795 569,00
1979 6 1/2-63/4 6 34 000 000 13 252 467,30 13 252 467,30
1979 63/4 6 50 000 000 19 488 922,50 19 488 922,50
1979 6 1/2-63/4 7 10 000 000 3 897 784,50 3 897 784,50
1979 7 12 150 000 000 58 466 767,49 58 466 767,49
1979 8 10 25 000 000 9 744 461,25 9 744 461,25
1979 8 10 25 000 000 9 744 461,25 9 744 461,25
1979 71/2 12 40 000 000 1 5 591 138,00 15 591 138,00
1979 73/4 15 50 000 000 19 488 922,50 19 488 922,50
1979 8 1/4 10 40 000 000 15 591 138,00 15 591 138,00
1979 8 1/a 10 60 000 000 23 386 707,00 23 386 707,00
1979 8 1/4 10 12 000 000 4 677 341,40 4 677 341,40
1980 77/a 10 150 000 000 58 466 767,49 58 466 767,49
1980 8 10 40 000 000 15 591 138,00 15 591 138,00
1980 9,65 10 50 000 000 19 488 922,50 19 488 922,50
1980 8 3/4 8 40 000 000 15 591 138,00 15 591 138,00
1980 8 1/4 8 70 000 000 27 284 491,50 27 284 491,50
1980 8 1/a 8 35 000 000 13 642 245,75 13 642 245,75
1980 8 1/e 8 10 000 000 3 897 784,50 3 897 784,50
1980 8 1/s 8 50 000 000 19 488 922,50 19 488 922,50
1980 8-10 12 12 000 000 4 677 341,40 4 677 34.1 ,40
1980 8 12 12 000 000 4 677 341,40 4 677 341,40
1980 8 12 12 000 000 4 677 341,40 4 677 341,40
1980 7,9 12 12 000 000 4 677 341,40 4 677 341,40
1980 77/s 12 150 000 000 58 466 767,49 58 466 767,49
1980 8,35 8 250 000 000 97 444 612,48 97 444 612,48
1980 9,5 8 150 000 000 58 466 767,49 58 466 767,49
1 730 628 011 '14 1 482 769 064,18
1963 51/2 20 LIT 1 5 000 000 000 12 322 352,75 2 464 470,55
1966 6 20 1 5 000 000 000 12 322 352,75 4 928 941,10
1966 6 20 1 5 000 000 000 12 322 352,75 4 928 941,10
1968 6 20 1 5 000 000 000 12 322 352,75 6 571 921,47
1968 6 20 1 5 000 000 000 12 322 352,75 6 571 921,47
1972 7 15 20 000 000 000 16 429 803,66 11 500 862,56
1972 7 15 20 000 000 000 16 429 803,66 11 500 862,56
1974 7 15 1 0 000 000 000 8 214 901,83 7 393 411,65
1975 10 10 30 000 000 000 24 644 705,50 15 402 940,94
127 330 978,40 71 264 273,40
Annex I
Main characteristics of loans outstanding at 31 December 1980
Initial amount
Year of Interest Term Balance outstanding at
issue % p.a. (years)
I
equivalent in European 31.1 2:1980 (in Euro· in currency
units of account peen units of account)
1957 3 1/2 25 BFR 200 000 000 4 838 502,87 570 943,34
1957 3 1/2 25 20 000 000 483 850,29 57 094,33
1962 51/4 20 300 000 000 7 257 754,31 1 016 085,61
1963 51/2 20 300 000 000 7 257 754,31 1 524 128,41
1968 63/4 15 750 000 000 18 144 385,76 6 531 978,87
1970 83/4 20 500 000 000 12 096 257,18 8 068 203,54
1971 73/4 15 700 000 000 16 934 760,05 10 160 856,04
1973 73
/4 12 1 000 000 000 24 192 514,35 15120 321,47
1975 8 1/4 10 1 500 000 000 36 288 771,53 29031017,22
1978 81/2 8 2 000 000 000 48 385 028,70 48 385 028,70
1980 133/a 8 2 000 000 000 48 385 028,70 48 385 028,70
1980 131/2 8 500 000 000 12096257,18 12 096 257,18
236 360 865,23 180 946 943,41
1964 5 20 FF 150 000 000 25 256 096,82 6 314 024,21
1971 8 1/2 18 150 000 000 25 256 096,82 17 510 893,79
1972 71/4 15 150 000 000 25 256 096,82 17 679 267,78
1973 71/2 15 60 000 000 10 102 438,73 8 081 950,99
1973 71/2 18 150 000 000 25 256 096,82 23 993 291 ,98
1975 10 7 125 000 000 21 046 747,35 . 17 679 267,78
1976 101/4 5 40 000 000 6 734 959,15 1 346 991,83
1976 10 5 60 000 000 10 102 438,73 2 020 487,74
1976 10 7 50 000 000 8 418 698,94 8418698,94
1976 1 0 1/s 18 250 000 000 42 093 494,70 42 093 494,70
1976 101/2 7 50 000 000 8 418 698,94 5 051 219,36
1977 1 P/a 5 60 000 000 10 102 438,73 10 102 438,73
1977 11 12 300 000 000 50 512 193,64 50 512 193,64
1978 11 4/10 6 4 000 000 673 495,92 673 495,92
1978 11 4/10 7 4 000 000 673 495,92 673 495,92
1978 108/10 15 275 000 000 46 302 844,1 7 46 302 844,17
1978 101/2 7 50 000 000 8 418 698,94 8 418 698,94
1978 10-9,5/10 12 50 000 000 8418698,94 8 418 698,94
1978 10 10 300 000 000 50 512 193,64 50 512 193,64
1979 97/10 15 325 000 000 54 721 543,11 54 721 543,11
1979 11 20 100 000 000 16 837 397,88 15 852 756,23
1979 11 1/2 20 23 000 000 3 872 601,51 3 651 920,23
1980 ·1 07/a 8 20 000 000 3 367 479,58 3 367 479,58
1980 12,225 12 20 000 000 3 367 479,58 3 367 479,58
1980 123/4-13 1/4 15 80 000 000 13 469 918,30 13 469 918,30
1980 14,25 6 150 000 000 25 256 096,82 25 256 096,82
1980 14 12 400 000 000 67 349 591,52 67 349 591,52
1980 13,30 5 20 000 000 3 367 479,58 3 367 479,58
1980 13,60 5 10 000 000 1 683 739,79 1 683 739,79
1980 13,95 8 20 000 000 3 367 479,58 3 367 479,58
1980 14,30 7 15 000 000 2 525 609,68 2 525 609,68
1980 14,30 7 20 000 000 3 367 479,58 3 367 479,58
Annex I
Main characteristics of loans outstanding at 31 December 1980
Initial amount
Year of Interest Term Balance outstanding at
issue % p.a. {years)
I
equivalent in European31.12.1980 {in Eura-in currency
units of account pean units of account)
1961 41/2 20 HFL 50 000 000 17 915 945,55 1 110 788,63
1962 4 3/4 25 6 000 000 2149 913.47 611 975,77
1962 43/4 20 25 000 000 8 957 972,77 1 272 032,13
1963 45/a 30 1 750 000 627 058,09 273 755,64
1964 53/4 20 25 000 000 8 957 972,77 2 454 484,54
1965 53/4 20 40 000 000 14 332 756.44 4 837 305,30
1975 81/2 15 60 000 000 21 499 1 34,66 14 332 756.44
1975 85/a 10 20 000 000 7 166 378,22 3 583 189,11
1976 8 7 60 000 000 21 499 134,66 21 499 134,66
1976 8 3/4 25 25 000 000 8 957 972,77 7524697,13
1976 85/a 25 30 000 000 10 749 567,33 9 029,636,56
1976 8 3/4 20 14 000 000 5016464,7~ 5 016 464,75
1978 71/4 15 100 000 000 35 831 891,10 35831891,10
1978 75/a 15 14 000 000 5016464,75 5 016 464,75
1980 1 07/a 10 50 000 000 17 915 945,55 17 915 945,55
186 594 572,88 130 300 522,06
1957 53/a 25 LFR 100 000 000 2 419 251.44 360 611,33
1961 51
/4 25 100 000 000 2 419 251.44 971 151.74
1961 5 25 100 000 000 2 419 251.44 957 742,85
1962 51/a 25 250 000 000 6 048 128,59 2 747 260,78
1964 53/a 20 150 000 000 3 628 877,15 967 700,57
1971 7 15 250 000 000 6 048 128,59 5 201 390,59
1971 73/4 12 300 000 000 7 257 754,31 3 096 641,84
1972 63/4 12 300 000 000 7 257 754,31 3 265 989.45
1972 63
/4 15 400 000 000 9 677 005,74 6 773 904,02
1973 63
/4 15 300 000 000 7 257 754,31 5 806 203.45
1973 7 12 800 000 000 19 354 011.48 12 096 257' 17
1973 7 15 800 000 000 19 354 011.48 15 483 209,18
1973 8 12 300 000 000 7 257 754,31 4 064 342,42
1973 8 12 200 000 000 4 838 502,87 2 709 561,60
1973 71/4 15 500 000 000 12 096 257,18 11 128 556,61
1973 71/2 8 250 000 000 6 048 128,59 967 700,58
1974 10 7 400 000 000 9 677 005,74 2 419 251,43
1975 9 10 500 000 000 12 096 257,18 10 160 856,03
1975 9 9 100 000 000 2 419 251,44 1 935 401 '15
1976 9'{2 8 500 000 000 12 096 257,18 11 612 406,89
1976 9'{2 8 200 000 000 4 838 502,87 2 419 251.43
1977 81/2 10 500 000 000 12 096 257,18 12 096 257,18
1978 73/4 10 250 000 000 6 048 128,59 6 048 128,59
1978 73
/4 10 600 000 000 14 515 508,61 13 910 695,75
1978 8 6 200 000 000 4 838 502,87 4 838 502,87
1979 83
/4 8 500 000 000 12 096 257,18 12 096 257,18
1980 10 10 500 000 000 12 096 257,18 12 096 257,18
1980 12-10 8 250 000 000 6 048 128,59 6 048 128,59
1980 11,75 8 400 000 000 9 677 005,74 9 677 005,74
241 925 143,58 181 956 624,19
Annex I
Main characteristics of loans outstanding at 31 December 1980
Initial amount
Year of Interest Term Balance outstanding at
issue % p.a. (years)
I
equivalent in European 31.12.1980 (in Euro-in currency
units of account pean units of account)
1976 9 7 CAD 50 000 000 32 061 558,19 32061558,19
1977 9 7 25 000 000 16 030 779,10 16 030 779,10
48 092 337,29 48 092 337,29
1975 73/4 15 SFR 80 000 000 34 560 669,09 34 560 669,09
1976 6 1/4 5 30 000 000 12 960 250,91 12 960 250,91
1976 61/z 7 30 000 000 12 960 250,91 12 960 250,91
1976 53/4 15 80 000 000 34 560 669,09 34 560 669,09
1977 4 1/2 8 65 000 000 28 080 543,64 28 080 543,64
1977 4 1/2 16 80 000 000 34 560 669,09 34 560 669,09
1978 3 3/4 4 100 000 000 43 200 836,37 43 200 836,37
1978 3 1/4 3 52 500 000 22 680 439,09 22 680 439,09
1978 3 3/a 4 57 500 000 24 840 480,91 24 840 480,91
1978 35/s 5 37 500 000 16.200 313,64 16 200 313,64
1978 3 1/s 5 25 000 000 10 800 209,09 10 800 209,09
1978 3 1/4 6 25 000 000 10 800 209,09 10 800 209,09
1978 3 5 20 000 000 8 640 167,27 8 640 167,27
1978 21/2 3 100 000 000 43 200 836,37 43 200 836,37
1979 3 8 123 500 000 53 353 032,91 53 353 032,91
1979 1 2 18 000 000 7 776 150,55 3 888 075,28
1979 3 5 45 000 000 19 440 376,37 19 440 376,37
1979 29/1o-3 1/4 4 25 000 000 10 800 209,10 10 800 209,10
1979 4 3/4 10 7 000 000 3 024 058,55 3 024 058,55
1980 51/4 6 38 000 000 16 416 317,82 16 416 317,82
1980 51/4 6 17 000 000 7 344 142,18 7 344 142,18
1980 6 1/4 5 30 000 000 12 960 250,91 12 960 250,91
1980 6 10 80 000 000 34 560 669,09 34 560 669,09
1980 57/s 5 20 000 000 8 640 167,27 8 640 167,27
512 361 919,31 508 4 73 844,04
1966 53/4 20 u.a.1 20 000 000 35 287 309,27 14 644 233,35
1977 95/a 12 UKL 20 000 000 36 422 574,71 32 871 373,67
1979 131/s-11 1/2 10 5 000 000 9 105 643,68 9 105 643,68
1980 17-143/4 5 25 000 000 45 528 218,39 45 528 218,39
1980 131/z 8 20 000 000 36 422 574,71 36 422 574,71
162 766 320,76 138 572 043,80
6 167 180 620,62 2 5 440 828 165,83
1 At present, this unit of account (u.a.) has the same value as that used by the former European Payments Union, as defined in Article 26 (a) of its Charter, i.e. 0,88867088 grams of fine gold. This value could change under certain cir-cumstances.
Annex II
42
I
European Coal and Steel Community
Balance sheet at 31 December 1980 and 31 December
1979
(in European units of account)
1980 1979
Cash and balances with central banks 5 760 379 466 829
loans and advances to credit institutions
repayable on demand 24 838 983 24 060 906
with agreed maturity dates or periods of notice 523 345 753 424 331 208
548 184 736 448 392 114
Debt securities held in portfolio (Note 1) 264 243 139 206 634 624
loans outstanding (Note 2) 5 514 673 415 4 793 911 983
Unamortized issuing costs and reimbursement
premiums (Note 3) 72 722 065 70 902 275
Banks deposits for coupons and securities due
but not presented for payment 55 471 293 40 376 952
land and buildings (Note 4) 286 389 260 752
Other assets (Note 5) 25 201 409 32 069 955
Accrued income (Note 6) 155 563 851 128 356 011
6 642 106 676 5 721 371 495
l
The annexed notes are an integral part of these accounts.Coupons and securities due but not presented for payment
Amount owed to credit institutions repayable on demand
with agreed maturity dates or periods of notice
Medium and long-term borrowings (Note 7)
Other liabilities
Accrued interest and commission payable (Note 8)
Total liabilities due to third parties
Commitments concerning the ECSC operational budget (Note 9)
Financial aid Other
Reserves (Note 1 0) Guarantee fund Special reserve Former pension fund
Unallocated surplus of revenue
Annex II
Liabilities
1980 1979
55471223 40 376 859
8 268 671
5 405 735 297 4 675 047 371
14 823 929 3 850 471
224 587 699 166 822 885
5 700 618 148 4 894 366 257
376 741 857 310021337
119 259 059 105 033 906
496 000 916 415 055 243
260 000 000 230 000 000
143 500 000 140 000 000
41 847 043 41 530 962
445 347 043 411 530 962
140 569 419 033
6 642 106 676 5 721 371 495
_j
European Coal and Steel Community Commission of the European Communities
F.-X. ORTOLI Vice-President of the Comm(ssion
Annex Ill
44
European Coal and Steel Community
Revenue and expenditure for the years ended 31 December
1980 and 31 December 1979
(in European units of account)
,
-1 Expenditure
Interest paid
Commissions paid
Contribution to administration costs (Note 11 t
Value adjustments for losses on loans and provisions for general risks relating to ECSC activities
Value adjustments in respect of securities (Note 121 Realized losses in respect of securities (Note 131
Amortization of issuing costs and reimbursement premiums
(Note 31
Other changes Research expenditure
Rehabilitation expenditure
Assistance to coking coal and metallurgical coke
Interest subsidies under Article 54
Interest subsidies under Article 56
Loss on exchange
Surplus of revenues over expenditure
1980 1979
429 401 595 363 208 185
3 870 354 3 864 210
5 000 000 5 000 000
11 572 097 BOO 000
580 265 10 387 727
941 235
16 052 529 14 510 254
439 909 462 587
40 962 596 33 101 821
35 667 540 33 020 436
10 942 478 4 570 486
7 437 504 5 374 622
10 593 799 6 399 500
1 691 396 297 923
114 483 290 104 050 368
Interest received (Note 14)
Profit on repurchased securities (Note 7)
Miscellaneous
Levy and fines (Note 15)
Realized gains in respect of securities
Contributions from Member States
The annexed notes are an integral part of these accounts.
I
1980538 682 392
4 110 303 2 239 285
116 604 607
28 000 000
689 636 587
Annex Ill
Revenue
J
1979445 380 452
2 739 281 4 514 726
1 04 041 363 .. 372 294
28 000 000
585 048 116
European Coal and Steel Community Commission of the European Communities
F.-X. ORTOLI Vice-President of the Commission
46
European Coal and Steel Community
Statement of allocation of funds -
Excess of revenue over
expenditure for the years ended 31 December 1980 and
31 December 1979
(in European units of account)
,----~---.---.---~
I
---L---L---~ 1980 1979Surplus of revenue over expenditure at 1 January
Surplus of revenue over expenditure for the year, to be allocated
Allocation: (Note AI Guarantee fund Special reserve Former pension fund Financial aids Other
Total available for allocation
Surplus of non-allocated revenue over expenditure
at 31 December
419 033
114 483 290
114 902 323
30 000 000 3 500 000 316 081 66 720 520 14 225 153
114 761 754
140 569
113 045
104 050 368
104 163 413
30 000 000 1 500 000 468 300 42 937 063 28 839 017
103 744 380
419 o33 1
I