Universities of Leeds, Sheffield and York
http://eprints.whiterose.ac.uk/
This is an author produced version of a paper published in Journal of the American Society for Information Science and Technology.
White Rose Research Online URL for this paper:
Published Paper
Cox, A.M., Clough, Paul and Siersdorfer, Stefan (2011) Developing Metrics to Characterise Flickr Groups. Journal of the American Society for Information Science and Technology, 62 (3). pp. 493-506.
Running head: DEVELOPING METRICS TO CHARACTERISE FLICKR GROUPS
Developing Metrics to Characterise Flickr Groups
Andrew Cox, Paul Clough and Stefan Siersdorfer
Abstract
Flickr, the large-scale online photo sharing website, is often viewed as one of the ‘classic’
examples of Web2.0 applications. Flickr is becoming the “eyes on the world” by capturing and
recording a visual archive of contemporary life on a diverse and extensive range of subjects.
Through sites, such as Flickr, researchers are able to observe the social behaviour of online
communities and extract, process and analyse content and metadata for a range of purposes. One of
the main features of the online photo storing and sharing web site, Flickr, is groups. They provide
a means to organise, share and discuss photos of potential interest to group members. This paper
explores the scale of group creation on Flickr and proposes a novel scheme for characterising
groups in Flickr. It suggests a set of metrics derived partly from previous studies, looking at
aspects of membership, communication activity and communication structure. These metrics
could be applied more generally than Flickr to capture characteristics of various online groups or
communities. To provide the data to examine these metrics we first gathered a population of as
many groups as possible, from which we randomly sampled 1,000 groups. Data about the groups
sampled were collected using a variety of approaches and analysed with respect to the proposed set
of metrics. The results of our analysis provide new insights into group behaviour in Flickr. We find
that, in addition to very large groups in terms of members and photos, the data analysis uncovered
a large number of small groups with low activity. Most groups, especially large ones, were not
dominated by a few individuals as expected. The contributions of this paper include (1) a novel set
of metrics for characterising online groups that extend existing schemes; (2) an approach for
sampling Flickr to estimate the population of groups based on a form of dictionary-lookup; (3) new
insights into Flickr groups based on results from analysing detailed information of 1,000 randomly
selected groups; and (4) reflections on our experiences with using publicly accessible data to
1.Introduction
Large Web2.0 sites and other “megawebsites” like Flickr are difficult to grasp because of
their sheer scale. In October 2009 Flickr claimed to have 4 billion photos1, having passed the 3
billion mark just 6 months earlier. The site may produce many rich personal experiences, but it is
hard to get a feel for what the whole site is like. Individual impressions can be quite different
because it is more like a place where many communities grow than itself a community (Perez
2007).
One of the most studied features of the Internet as a phenomenon is the active involvement
of users in creating online or virtual communities. Usenet, Listservs and Web forums, such as
Yahoo! Groups have supported the emergence of vibrant collectivities. Web2.0 sites, such as
Flickr and Facebook, however, seem to be based primarily on a more social network model. Thus
Flickr would be understood via individual users uploading and organising personal collections of
photos, making social contacts through browsing profiles and responding to comments. Yet Flickr
does have a group function too. To what extent should this be understood through the online
community model? Is part of the success of Flickr its combination of ego-centred activity with the
online community concept?
Flickr is a large site based on user generated photos and often cited as a ‘classic’ example
of Web2.0 (Cox et al. 2008, Cox 2008, Miller and Edwards 2007, van House et al 2005). Flickr
itself and content derived from the site has been studied from and used for a variety of purposes,
such as providing recommendations for tagging photos (Sigurbjörnsson & van Zwol, 2008),
investigating users motivations for publishing and tagging on Flickr (Nov et al., 2008; Angus &
Thelwall, 2010) and automatic automatically assigning geographic coordinates to Flickr photos
(Van Laere et al., 2010). Flickr groups2 have a pool of photos, discussion space and a list of
members. Anyone can set up a group, choosing a name, defining some simple functions and
1http://blog.flickr.net/2009/10/12/4000000000/
becoming “Admin”. There are private and public groups. Generally users can join a group just by
clicking on a button. They can then choose to surface one of their photos in the group pool. Several
different types of group seem to have emerged on Flickr (Davies 2006, Malinen 2010). Some are a
place to collect together photos around a particular topic, theme or photographic technique, be this
very specific, such as pictures of a type of tree, or something very broad, such as black and white
photos. Given that tagging only partly solves the problem of organising the vast collection of
photos on Flickr, adding photos to groups is a form of emergent topical classification. Other
groups are organised to hold competitions or make awards, effectively highlighting good photos.
These groups can be themselves thematic or very broad in scope. How the awards are made varies,
but often the group Admin and helpers choose who to reward. The existence of this type of group
is linked to the desire to identify good photos, again in an emergent way. Flickr’s own way of
calculating how good a photo is, is an interestingness algorithm, which uses evidence such as
number of time a photo has been viewed, commented or favourited to priorities photos in searches.
The award groups are another bottom up approach to organizing photos by quality, which allows
many different criteria of goodness to be coexisting on Flickr. A third type of Flickr group has
quite a strong geographical basis, collecting photos of a particular town or village, and these seem
to be the most likely to organize meet-ups and develop into social groups.
On a superficial level this resembles the organisation of something like Yahoo! groups. In
fact, a comparison of the organisation of Flickr and Yahoo! groups is instructive. Whereas Yahoo!
groups are relatively clearly bounded and can be browsed as separate entities, because of the rich
navigation paths it is very easy within Flickr to navigate out of any Flickr group, e.g. from a photo
in the pool to the “photostream” of its author or from the membership list to the profile of
individual members, their photos, favourite or contacts. There is no function to browse Flickr
groups. Actually Flickr is far less organised around groups, rather it is focussed on individuals,
their uploading and organising of their own photos, monitoring traffic on these photos and
favourites, contacts and group memberships). Data based on reciprocal commenting would be the
most direct way to explore this social network (Recuero 2007, Prieur et al 2008). However, the
groups exist and clearly play some function within this very successful and engaging site. Given
the scale of Flickr, it is useful to try and use some quantitative approaches to understanding the role
of groups. This paper provides the foundations for such an approach by the following research
objectives. Firstly, to establish the scale of group creation on the site. Secondly, to develop a set of
metrics that use publicly accessible data to characterise. groups in Flickr. And thirdly, using these
metrics to characterise the extent of the “groupness” of Flickr groups.
2. Related Work
Although some fascinating Flickr group related tools have been designed, such as Group
trackr3, there has been relatively little academic research on Flickr groups as such. A notable
exception is the work of Negoescu and Gatica-Perez (2008). They looked at group behaviour from
a collection of the 500 most recent photos from 22,414 recently active users. They found that only
around a half of the sample had ever surfaced a photo in a group pool. Paying members of Flickr
(“pros”) put more photos in groups than non-paying members, perhaps partly as a function of their
having more photos. About a quarter had “shared” photos in over 50 groups; 10% in over 200
groups. 15% of the people who had put a photo in a group had shared all the photos they had shared
with just one group; 45% had shared at least one photo with more than 20 groups. Thus, on the
whole where people do surface photos in groups they tend to use multiple groups. But the authors
found that users tended not to share lots of photos with a particular group; “loyalty” was low. 85%
of users had an average of less than 15 photos in any particular group. On the other hand, the same
photo is not put in lots of groups - there is not much “photo recycling” - the average is about 3.1
groups per photo, implying that most users do not try and promote a photo on lots of groups, even
though, as Sigurbjörnsson and van Zwol (2008:5) found, there is a correlation between the number
of times a photo is viewed and the number of groups it is in.
The measures that Negoescu & Gatica-Perez (2008) investigate tell us something broadly
about the average sort of behaviour in groups, but they do not tell us very much about the character
of groups themselves. To develop a fuller range of descriptive metrics for Flickr groups a useful
starting point is Butler’s (1999) working paper on Listservs (see also Cummings, Butler & Kraut
2002). Here he is considering whether Listservs should be best understood as analogous to small
groups or voluntary associations, and he proposes sets of measures under the headings of
membership, communication activity and participation structure to explore this. His metrics are
summarised in Table 1.
Table 1: Descriptive metrics for online collectives (Butler 1999)
A. Membership
Size
Growth / Loss / Change
B. Communication activity
Average number of messages per day Percentage of all groups with zero activity
C. Participation structure
Average thread length
Proportion of messages receiving no reply Interactive or episodic pattern of messaging
Participation ratio - proportion of members who contribute at least one message Gini coefficient for the distribution of participation among active participants Proportion of all messages sent by two top participants
These metrics are well chosen to capture the basic scale and turnover of membership; the
raw level of communication; and the character of participation, whether it seems to reflect
reciprocation and what proportion of the membership are involved in discussion. With some
modification the metrics also seem relevant to measuring the “groupness” of Flickr groups. The
membership measures are relevant, although it might be hypothesised that because the effort
involved in being a member of a listserv is greater than joining a Flickr group - one has to do
because there is little incentive to leave a group on Flickr. Listservs function through the
circulation of text messages; on Flickr normally the key group activity is surfacing photos in the
pool. Thus the equivalent to the average number of messages would be the rate of posting of
photos. In addition to photo related activity, discussions on the Flickr group forum could also be
considered in a way more obviously analogous to Butler’s metric. Participation structure is slightly
more difficult to translate for Flickr. The obvious analogous measure for Butler’s first three
structural measures which are about interaction, would be in terms of responses from surfacing a
photo in terms of viewing, favouriting and commenting. This is much more difficult to estimate in
Flickr, partly because a photo may be found through a number of routes and so the level of viewing
may not be linked to it being placed in a group pool. Thread length etc can be found for the group
forum. The second three measures are more about levels of participation and the distribution of
activity across the whole group or a small core of users. This is possible in theory to calculate for
Flickr, eg what proportion of all pool photos were posted by the most frequently posting members.
Butler’s (1999) work provides an excellent starting point for understanding appropriate
group metrics, but surprisingly we can find few subsequent studies that extend these metrics for
discussion forums or other types of site. Similar types of metric have been proposed for
communities of practice (Castro 2006) and for marketing communities (Cothrel 2000). Schoberth,
Preece & Heizel (2003) look at some of the same measures in relation to longitudinal group
activity and Smith and colleagues have produced many metrics and visualisations for usenet in the
Netscan project (e.g. Smith, 2002). Another interesting approach is offered by Backstrom et al’s
(2008) study of Yahoo! groups. Some of their metrics are summarised in Table 2.
Table 2 Yahoo! groups metrics Backstrom et al. (2008)
Base line traffic - 2 messages in every monthly interval Base line users - 10 distinct users post in a year
Dense period - 2 month period which in every 7 day period there are 10 + posts
Whereas Butler is trying to characterise the communicative character of online collectives,
Backstrom et al (2008) are seeking to identify segments of the groups that are active, so they
propose critical levels of membership or activity that indicate the strength of the group. On this
basis they segment Yahoo! groups with active small/private groups and less active, very large
public groups. While this does not add to Butler’s measures it does suggest an approach to how to
use the figures, i.e. to segment the whole population.
Whereas the quantitative study of online community has not been very fully developed,
there have been many qualitative studies of online communities. Many of these have been
motivated by a desire to explain what features of these groups make users feel them to be
communities. As part of an attempt to operationalise these parameters for content or linguistic
analysis, Herring (2004) usefully summarises some of the key features of online groups that have
been identified as indicating community. These are summarised by her in the quotation below:
1) Active, self-sustaining participation: a core of regular participants
2) Shared history, purpose, culture, norms and values
3) Solidarity, support, reciprocity
4) Criticism, conflict, means of conflict resolution
5) Self-awareness of group as an entity distinct from other groups
6) Emergence of rules, hierarchy, governance, rituals (Herring 2004)
Not surprisingly, these qualitative aspects of a group are quite hard to operationalise, in a
form whose collection can be automated. However, 1) does seem to relate closely to the second
three aspects of Butler’s (1999) participation structure and 3) to the first three. We also suggest that
for Flickr some limited indication of the existence of 6) could be taken from the length of the group
3. Proposed Metrics
From previous literature, we produced a preliminary set of metrics for Flickr groups prior
to considering what was technically feasible. The purpose of such quantitative measures is to try
and characterise the strength of “groupness” of Flickr groups, after Butler (1999). As the
discussion of Herring (2004) points out, this can only be a very partial view of a complex,
somewhat subjective phenomenon but is still a potentially useful exercise if understood with that
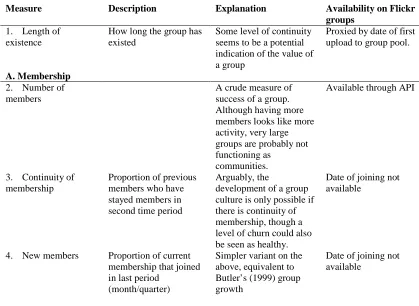
qualification. Table 3 lists potential metrics with a description, expanded explanation and
statement about its availability either through the publicly-accessible Flickr Application
Programming Interface (API4) or through data or Web-scraping (i.e. automatically extracting
[image:10.595.88.507.413.719.2]relevant data from the HTML source of relevant Flickr Web pages).
Table 3 Theoretical Flickr group metrics and potential in gathering these metrics from Flickr
Measure Description Explanation Availability on Flickr
groups
1. Length of existence
How long the group has existed
Some level of continuity seems to be a potential indication of the value of a group
Proxied by date of first upload to group pool.
A. Membership
2. Number of members
A crude measure of success of a group. Although having more members looks like more activity, very large groups are probably not functioning as
communities.
Available through API
3. Continuity of membership
Proportion of previous members who have stayed members in second time period
Arguably, the
development of a group culture is only possible if there is continuity of membership, though a level of churn could also be seen as healthy.
Date of joining not available
4. New members Proportion of current membership that joined in last period
(month/quarter)
Simpler variant on the above, equivalent to Butler’s (1999) group growth
Date of joining not available
5. Internationalisation Proportion of members from outside USA - either based on stated nationality or time zone of posting or time of day of posting
This would give us a sense of how diverse groups were
Not available, because Flickr users do store location in their profile, this is an uncontrolled text field.
6. Gender balance Proportion of membership who are female
While topics may have different levels of interest between sexes, the balance of gender overall might be seen as an indicator of “health”
Not available, as not currently recorded in Flickr profiles.
B. Communication Activity
7. Total number of photos posted
Available through API
8. Average number of photos per member
Total photos or recent photos divided by membership
Available through API
9. Number of recent Photos
Number of photos posted in last month/time period
A crude measure of activity
Date photo added to pool not available
10. Number of discussion threads
Total discussions threads ever initiated by group
Discussion about the group etc as opposed to simply uploading photos could be seen as evidence of group development.
Available by screen scrape
C. Participation Structure
11. Levels of viewing of pooled photos
If photos in the group pool get a lot of hits, it suggests the group is active, although clearly one cannot simply attribute a high level of hits to group
membership.
Not available in the database
12. Number of recent photos, interactively posted
Number of photos posted in last
month/time period and that are heavily clustered in a particular short time span
Implies a wave of activity in the group, where one set of postings sets off others.
Hard to collect automatically
13. Level of in-group commenting
Proportion of all comments on a sample of group photos that are from group members
Hard to collect automatically
14. Uniqueness of group (“photo recycling”)
Proportion of all photos that have only been posted to this group
If a photo is posted to lots of groups, presumably the photo is more important than the group. If the photo has only been added to this group it implies that the photo
perfectly fits the purposes of this group and this group only.
15. Thread length (Discussions)
Average number of replies to discussion postings
The more replies to a discussion posting, the more evidence there is of group interaction
Hard to collect automatically
16. Message length (Discussions)
Number of words in messages
Longer messages implies more complex discourse
Hard to collect automatically
17. “Participation ratio” - Proportion of different members surfacing a photo in the group
Number of members who have recently (or ever) posted a picture as a proportion of total membership
Measures “rate of participation”
Not available
18. Core user dominance
Proportion of all photos uploaded by two most active members
Measures the extent to which the group is dominated by a few people
Available by screen scrape, as Flickr records number posted by most active and top five posters of photos 19. “Lurking” Proportion of members
who have not recently posted / ever posted an image
Very hard to collect automatically
D. Formalisation
20. Rules Number of words in the rules of group
More complex rule making and description implies more activity in explaining the group. Unlikely to occur if the group is inactive.
Available by screen scrape from group home page
21. Administration Number of owners, administrators, moderators
The more effort is being put into organizing the group more formally, the more active and self aware the group would seem likely to be.
Available by screen scrape from membership listing, except where the group has chosen special names for Admin roles
This set of metrics adds to Butler’s (1999) work in a number of ways. Butler did not look at
the length of existence of groups, but we considered this might be an interesting metric to gather
because it seems obvious that some level of continuity is needed for community feelings to
develop. As regards “Membership”, we thought that it might be desirable to collect some data
about the character of members, particularly given the claim of Flickr to be the “eyes on the world”
(Naaman, 2006), implying an inclusive membership. We proposed looking at the degree to which
system. We also wanted to look at the gender balance of membership. In reality this information is
not available. Although there is a field in the Flickr profile for a member’s location, this is an
uncontrolled text field, so it would have been difficult to reliably establish the geographical
location of people in the sample. Again gender is not recorded in users’ profiles so this could not
be gathered.
As regards “Communication activity”, we wanted to again look at the volume of activity.
10 relates specifically to forum activity, as opposed to photo related activity. As regards
“Participation” structure, there were two elements of this in Butler (1999) the interactivity of
postings and the level of participation of members. Again here we have 11-16 are equivalents of
the first category of metric; 17-19 are equivalent to the second. Unfortunately all the possible
interactivity measures were very hard to collect automatically. In addition, we have added a new
section, some measures of the formalisation of the group, which relate to Herring’s sixth aspect of
virtual community.
4. Methodology
To carry out the study, a two-stage methodology was used: (1) an initial empirical study of
Flickr groups to provide overall group statistics based on a method to gather the numbers of
groups; (2) a more detailed analysis of a random sample of 1,000 groups to derive characteristics
of “groupness” and validate the proposed metrics. Data was collected from Flickr using the
publicly-available API5, combined with data-scraping for additional information not available
through the API. The initial data was collected during September 2008 and the main sample in
December 2008.
To analyse Flickr groups in-depth requires gathering a list of all possible groups from
which to sample. Each Flickr group is referenced by a unique identifier and this is required to
gather further information about each group (either with the API or using data-scraping). However,
no publicly-available list of groups is provided by Flickr; the population is indeterminate. Our
experience has shown that estimating the number of Flickr groups and creating a list of them is
non-trivial. Initially we searched Flickr.com (group title and description) for the <space>
character, assuming that most groups, regardless of language, would use such a character and this
would occur with high frequency. This approach returned a total of 461,272 groups (as of 9:49:14
on October 15th 2008). However, Section 5.1 shows that such results can be misleading due to
effects such as server load balancing and that the results will only include public groups. To
generate a list of group identifiers we would have to execute multiple searches and extract the
group identifiers from the HTML of the Web pages. This is possible but requires multiple calls
which, without careful consideration, can put a high load on the hosting Web server and lead to
being banned. Searching for Flickr.com using <space> is also now not possible and returns no
results.
The more appropriate and repeatable approach is to use the publicly-accessible API
provide by Flickr. The API also does not allow searches using characters such as whitespace.
Therefore, to compile a list of as many groups as possible within the constraints of using the Flickr
API, the following approaches were used: (1) compile lists of common words (or stopwords) in a
range of languages6 (English, Spanish, Portuguese, Italian, French, German, Dutch, Japanese,
Chinese, Romanian, Swedish, Polish, Finnish, Arabic, Russian, Czech and Bulgarian), including
punctuation markers (‘approach 1’); (2) use the 20 most popular Flickr tags (as of 30/09/08) and
translate these into the previously listed multiple languages (‘approach 2’). Translation was carried
out automatically using the publicly-available Google Translate tools7 and verified manually. The
Flickr API is then used to search for groups containing the given stopwords and tags. Using both
approaches we were able to obtain a list (containing group identifier and name8) of 299,688
6
Lists of common words in multiple languages are taken from the Snowball stemmer: http://snowball.tartarus.org/
7 Google Translate: http://translate.google.com/
8 Example groups include: “10003140@N00, Widescreen Wallpaper”, “10005441@N00, ODD CHICAGO!!”,
distinct groups in total. The group identifier was used to gather more detailed information about
each group using the Flickr API. Although this excludes private groups it gives an order of
magnitude for Flickr groups and provides a large population from which to sample groups from
and to gathering data for the proposed group metrics.
From the list of total Flickr groups we randomly sampled 1,000 groups and developed a
custom crawler (using the Flickr API and data-scraping) to gather detailed information about the
groups based on our proposed metrics. This enabled groups to be characterised and facilitated
further analysis. Descriptive statistics for the sample group are: number of members (mean = 1,054
members; std dev = 2,497) and the length of written description, in characters, about each group
(mean = 1,314 members; std dev = 2,646). To check the coverage of subjects for the sample group,
a tag cloud was created for the top 200 tags from each using the most frequent 100 tags.
Comparing this to a tag cloud for all photos in Flickr on 30/09/08 it was found that 84% of tags
were the same, thereby indicating a similar coverage of topics for the photos in the sample group
compared to Flickr as a whole.
Information gathered for each group includes the following: (1) Number of members, (2)
Description length, (3) First page of discussion history (most recent discussions), (4) Number of
uploaded photos, (5) Number of discussions, (6) First and last uploaded photo, (7) 200 most
popular tags (and font size), (8) 5,000 most recent uploaded photos (if available) ~2M photos. For
each photo (from ~2M gathered from 1,000 groups) we gathered the following information: Title,
Owner, Tags and Date posted. For all owners from the photos collected previously we also
gathered information about: the owner’s geographical location, their Pro Account status, the total
number of photos uploaded to date and a number of attributes capturing social links (contacts,
favourites, group membership). This gathered information for the 1,000 groups provides a wealth
of detailed information with which to study group behaviours.
5. Results and Analysis
5. 1 Overall Flickr Group Statistics
As mentioned in Section 4, searching the group title and description fields of Flickr.com
returned a total of 461,272 groups, but due to constraints with executing searches on Flickr.com
(overloading the server with requests can lead to being banned) this is not a sustainable (or
feasible) approach for longer term data collection from Flickr. Using the previous approach to
compute an estimate of the overall number of groups is also problematic as the figure provided by
Flickr.com changes and is subject to various inconsistencies. For example, load balancing
performed by the Web servers hosting Flickr causes unpredictable results, with the number of hits
changing each time Flickr is queried, and the estimated number includes only publicly-accessible
groups and some groups will not contain whitespaces within the title or description. A more usable
metric is not a specific figure for the number of groups, but rather an estimate of the rate of change.
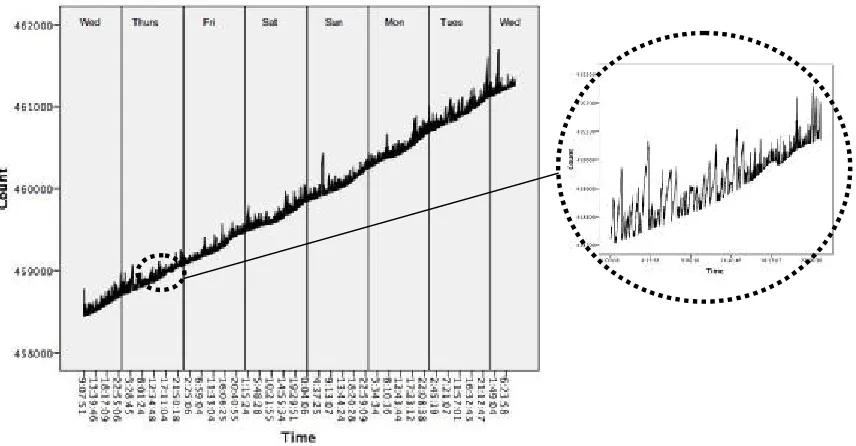
To perform this, we recorded the number of groups (plus uploaded photos and new users) that
include whitespace in the title or description fields at 10s intervals using Flickr.com during the
course of one week. This resulted in 36,733 data samples for: (1) the number of groups, (2) the
number of users, and (3) the number of photos. A steady increase in numbers should indicate new
groups/user/photos being added and over the course of one week the effects due to sampling
Figure 1 Illustration of the rate of growth for the number of groups on Flickr (36,733 samples for 1 week period).
The growth rates (or rates of change) help to indicate the scale of Flickr and users involved
in interacting with the application. Figure 2 shows an example of the resulting growth rate for the
number of groups on Flickr based on searching titles and descriptions with the whitespace
character. The growth appears linear and fitting a linear regression line to the data gives the
following: y = 0.077x + 458447 (R2 = 0.993; p<0.001). According to this linear regression line,
∆y/∆x = 0.073: on average a new group is added every 13 intervals or 2.2 mins (13 x 10s = 130s/60
= 2.2 mins). Sampling the growth rate for the number of uploaded photos containing whitespace
characters in the title or description, a total number of 1,011,909,272 publicly-accessible photos
have been uploaded. A resulting linear regression line of y = 255.221x + 1.002*109 (R2 = 0.872;
p<0.001) suggests that, on average, a new photo gets uploaded every 0.004 intervals (0.004 x 10s
= 0.04s), i.e. in every 10 second interval around 255 photos are uploaded (26 photos uploaded per
second). Finally, the number of registered Flickr users that are found using whitespace to search
titles and descriptions is 30,480,789, with a resulting linear regression line: y = 3.064x + 3.036e7
(R2 = 0.995; p<0.001). This implies that, on average, a new member joins Flickr every 0.33
growing, a characteristic of most “megawebsites”.
Figure 2 Proportion of groups across languages (ordered by using filtered top 20 tags).
Using the data collection described in the methodology section, a total of 299,688 unique
group identifiers (and titles) were gathered and form the population from which to sample groups.
The aim of this stage was to gather a complete list, where possible, of all group identifiers. Figure
1 shows the estimated language distribution (as proportion of groups) of collected groups based
on: (1) using the lists of language-dependent stopwords, (2) using the top 20 tags9 translated into
multiple languages, and (3) using a filtered version of the top 20 tags whereby only tags that do not
appear as tags in other languages are used. This latter version gives a truer perspective on the
language distribution because the same tags may be shared between languages (e.g. if loan words),
thereby mis-representing the language of the group. Unsurprisingly, English and Spanish
dominate the language of the groups, followed closely by other European languages.
9 Top 20 most popular tags (30/07/2008): water, white, light, portrait, flower, sunset, tree, yellow, girl, clouds, summer,
fun, new, sea, photography, family, park, architecture, show.
0.00 5.00 10.00 15.00 20.00 25.00 30.00 35.00 E ng lish S pa n ish P o rt ugue se It a li an F ren ch G e rm an D u tch J a p ane se C h ine se R o m a n ian S w e d ish P o lish F in n ish A ra b ic R u s s ian C z e ch B u lga ri an P ropo rt ion o f g ro up s c on ta in ing l a n guage -s pe c if c t e rms
Us ing s topwords
Us ing top 20 tags (all)
5.2 Characteristics of the Flickr Group Sample
Based on data gathered for the proposed metrics in Section 4, we now present the results
for each metric and discuss the implications for group. The results are categoriesed under
membership (Section 6.3.1), communication activity (Section 6.3.2), communication structure
[image:19.595.183.413.263.423.2](Section 6.3.3) and formalization (Section 6.3.4).
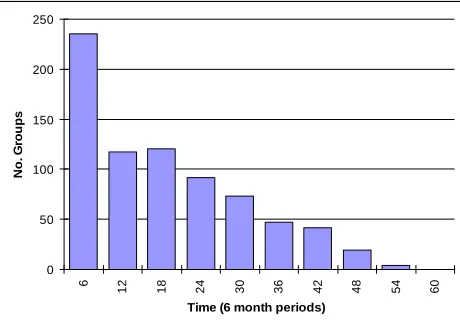
Figure 3 Distribution of length of group existence (based on 6 month time intervals), N=749.
5.2.1 Membership
Length of existence. The length of existence of the group provides a possible indicator of
the groupness, on the crude assumption that elapsed time allows groups to become closer. Figure 3
shows the length of existence for the Flickr group sample. The length of existence is calculated
using the date of the first upload of a photo to the group photo pool as a proxy for the date of the
foundation of the group. For 211groups no photo has been uploaded presumably because the group
was created but never used, so the date of creation cannot be inferred. For another 40 groups
unusable data was returned. For the 749 groups for which there was a date, the pattern indicates
that nearly 50% of the groups had been created in the last year. This suggests either a surge of
activity of group creation, or that groups are commonly deleted10, for example if they are not
successful or conceivably they might be hidden from the searches through which the sample was
10 A group can only be deleted if it contains no members (i.e. when the last remaining admin person leaves the group). 0
50 100 150 200 250
6
12 18 24 30 36 42 48 54 60
Time (6 month periods)
N
o
.
G
ro
u
collected.
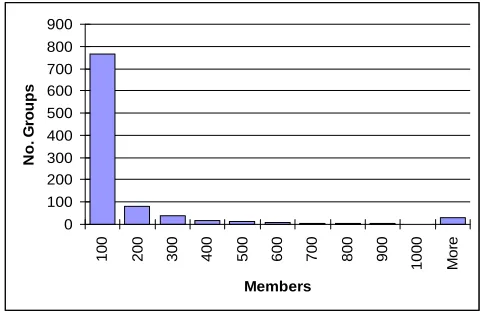
Figure 4 Distribution of number of members for group sample, N=967.
Number of members. From the group sample, 20% had only 1 member; nearly 50% had
less than 10 and nearly 80% of groups had less than 100 members (mean = 192; mode = 1; median
= 12; max = 29,021); thus many groups are small. Nearly 95% of groups have less than 500
members; only 3% (31 groups) have over 1,000 (see Figure 4). These figures show the groups
sizes as small, often akin to classic small groups examined in social psychology. Figures regarding
private groups cannot be publicly accessed but these, by their very nature, would probably be small
too, so the impression of Flickr is that there are significant numbers of small groups. The very
large groups are important and very visible, but there is an undergrowth of small groups that are
easily overlooked. Butler’s figure for the average membership of Listservs was 163; the maximum
2,245. The maximum for Flickr is vastly larger, showing how Flickr associations can be very
different in quality, even if many groups might be operating in comparable ways to yahoo groups.
5.2.2 Communication activity
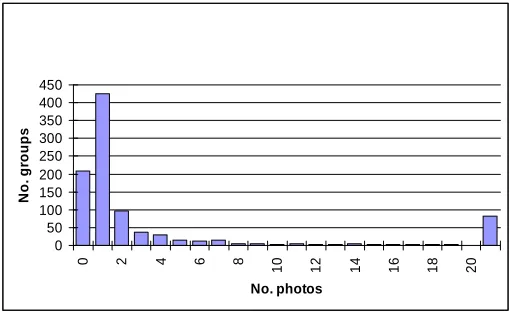
Total photos posted. 20% of groups had no photos, probably indicating groups that were
created but never really used. Nearly 50% of groups had less than 100 photos, see Figure 5. A few
groups have very large numbers of photos, with one group having over 1 million and three others
over 100,000 photos (mean = 2,983; mode = 0; median = 79; max = 1,315,519).
0 100 200 300 400 500 600 700 800 900
100 200 300 400 500 600 700 800 900
1000 Mo
re
Members
N
o
. G
ro
Figure 5 Distribution of number of photos posted for group sample, N=967.
Figure 6 Average photos uploaded per day, N=959.
Average number of photos uploaded per day. 41 groups with an apparent existence of
less than 1 day were excluded, since they produced absurd potential upload rates. In about 20% of
groups the average upload per day was 0 because no photos were ever posted. In 44% of all groups
the average was 1; in another 10% of groups it was 2 (see Figure 6). This compares “favourably”
for the activity levels on Butler’s Listservs, where the mean is only 1.635 messages per day (mean
= 6.22; median = 0.58; maximum = 1,055).
0 100 200 300 400 500 600 700 800 5 00 10 00 15 00 20 00 25 00 30 00 35 00 40 00 45 00 50 00 M o re
No. of photos posted
Fre q u e n cy 0 50 100 150 200 250 300 350 400 450
0 2 4 6 8
10 12 14 16 18 20
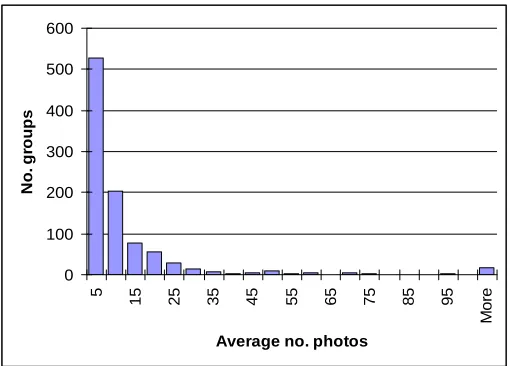
[image:21.595.171.426.348.504.2]Figure 7 Average number of photos in group pool per member, N=967.
Average number of photos per member. Over 50% of groups have less than 5 photos
uploaded per member and around 80% have less than 10 photos per member (mean = 21.09; mode
= 0; median = 4.41; maximum = 8,876), see Figure 7. These figures support Negoescu &
Gatica-Perez’s (2008) observation of low “group loyalty” (defined as a tendency to post most of
one’s photos to one group). There were 17 groups with more than 100 photos per member, only
one had more than 6 members; it had 111 members. Thus, it does not seem to be the big groups that
attract large numbers of contributions from a single individual.
0 100 200 300 400 500 600
5
15 25 35 45 55 65 75 85 95
M
o
re
Average no. photos
N
o
.
g
ro
u
ps
0 100 200 300 400 500 600
0
10 20 30 40 50 60 70 80 90
1
00
M
o
re
No. discussions
N
o
.
gro
Figure 8 Total number of discussions per group, N=1,000.
Total number of discussions. 50% of groups have never had any discussions. 40% of groups have
had 1 discussion, i.e. one forum thread (see Figure 8). Nine groups had had more than 100
discussions. The figures support an interpretation that generally photos, with comments, not
[image:23.595.174.424.248.385.2]textual discussion are the centre of Flickr.
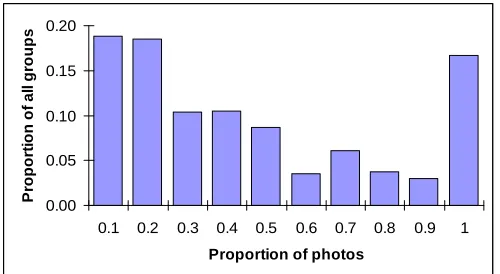
Figure 9 Proportion of all photos posted by most active poster, N=769.
5.2.4 Communication structure
Core user dominance. In around 20% of groups the top poster had posted only 10% of all
photos; in another 20% they had posted more than 10 and less than 20% (see Figure 9). This, again,
suggests significant numbers of groups where the power law of contribution does not apply; a few
individuals are not dominating participation. In contrast, in another 17% of groups one individual
had posted between 90 and 100% of all photos; with 100 groups where 100% of photos were by
one person. Yet these were all small groups with less than 10 members and around half of them
only had one member. Butler found that typically the two most active posters were posting more
than 30% of postings (1999: 34). The figures here are not quite comparable, but imply lower levels
of concentration, except in some small groups.
5.2.5 Formalisation
0.00 0.05 0.10 0.15 0.20
0.1 0.2 0.3 0.4 0.5 0.6 0.7 0.8 0.9 1
Proportion of photos
P
ropo
rt
ion
o
f
a
ll
g
ro
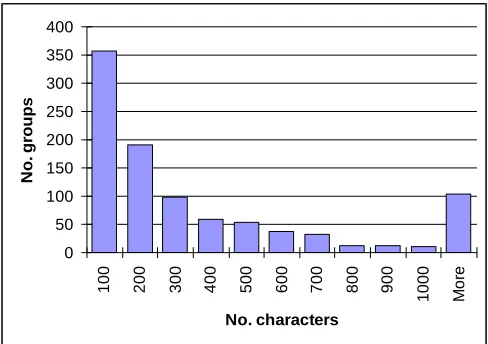
Number of characters in rules of group. 66 groups had 0 characters in their description
and another 30% have less than 100 characters (see Figure 10), i.e. the description is no more than
a sentence long (the sentence you have just read, up to the brackets, is 122 characters long).
Nevertheless, there were over 100 groups with more 1000 characters and two groups with more
[image:24.595.176.420.249.421.2]than 10,000 (mean = 484; median = 158; mode = 0; maximum = 23,581).
Figure 10 Length of group description (in characters), N=967.
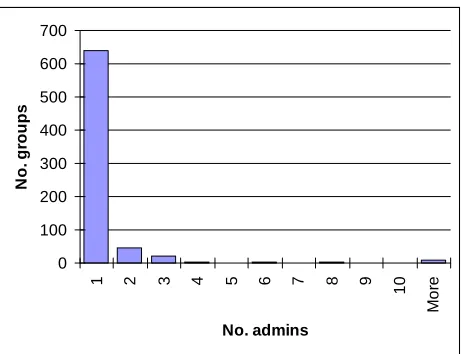
Group administration. 274 groups in the sample had apparently no Admins, this could be
because the admin had hidden their ID from the listing or because they had actually left a group
after they set it up, but it was probably mostly because they had customised the name of the role,
meaning that the screen scrape we used to collect the data would not collect information as this
was based on searching for the term “Admin” on the group web page. This was unfortunate as it
would seem the most active groups might be difficult to gather data for on this metric. Nearly 90%
of the groups with any admin, have 1 only (see Figure 11). This is the default in Flickr, where the
creator of the group is automatically admin. Ten groups had over 10 Admins (mean = 1.57; mode =
1; median = 1; maximum = 121).
0 50 100 150 200 250 300 350 400
100 200 300 400 500 600 700 800 900 1000 More
No. characters
N
o
.
g
Figure 11 Number of Admins, N=725.
Figure 12 Number of moderators, N=725.
To examine the pattern of moderation, the 25% of all the groups that had no Admins were
not counted. Some groups do appear to have moderators without an admin. 90% of groups had no
moderators. 18 had one (see Figure 12). Three groups had more than 10 moderators.
5.3 Characteristics of large and small groups
While the sample contained a lot of smaller groups, 20% of groups had more than 100
members. Typically these had up to 1,000 members, a few (about 30) more than this. Such groups
were rather massive in their activity, the average membership across them was 855, the average
number of photos posted was 13,721 photos. Not surprisingly the profile of length of existence
0 100 200 300 400 500 600 700
1 2 3 4 5 6 7 8 9
10
M
o
re
No. admins
N
o
.
g
roups
0 100 200 300 400 500 600 700 800
0 1 2 3 4 5 6 7 8 9 10
M
o
re
No. moderators
N
o
.
gro
u
[image:25.595.181.416.307.465.2]was a bit different from the whole sample, nevertheless 10% of the large groups had been created
in the previous six months and a quarter were less than a year old. Interestingly, the top poster only
accounted for about 3% on average of the photo pool in the large groups and for nearly 90% of
these groups the top poster accounted for less than 20% of photos. Thus there isn’t this sense of
one or a few members dominating participation. Of the sample of 1,000 groups, 466 had 1-10
[image:26.595.175.423.273.428.2]members, 202 had 1 member only (see Figure 13).
Figure 13 Distribution of the number of members for groups with 10 or less members, N=466.
Figure 14 Distribution of the number of photos for groups with 10 or less members, N=466.
194 groups or 40% of groups with fewer than 10 members have no photos see Figure 14);
149 of these only have one member. However, fifty have more than 100 and one group has 8876 0
50 100 150 200 250
1 2 3 4 5 6 7 8 9 10
No. members
N
o
.
g
ro
ups
0 50 100 150 200 250
0 10 20 30 40 50 60 70 80 90
100
M
o
re
No. photos
N
o
.
g
ro
u
[image:26.595.174.423.483.643.2]photos. It would require qualitative studies to confirm this, but the impression is that most small
[image:27.595.176.419.157.330.2]groups are not especially active.
Figure 15 Distribution of the length of descriptions for groups with 10 or less members, N=466.
10% of such groups have no description (see Figure 15). 37% have less than 100 character
description.
Thus rather than being very active, the small groups are probably better understood as often
being failed groups. Three quarters do not have much activity. This impression might be changed
if we had data on private groups, which could be quite active with a restricted membership. Given
the scale of Flickr, however, the fraction of small groups that are or have been active provide an
important part of the system as a whole.
Table 4 The 5 largest groups from our group sample
Group No. of
members
Desc. length (chars)
Uploads by 1st poster
No. of photos
No. of moderators No. of admins Avg. uploads/ member
Closer and Closer Macro
Photography
30,525 3,301 2,172 46,827 6 0 15
Green is Beautiful 29,645 636 901 278,346 0 1 9
Sunrise: Sunset --
Anything Sun!
24,187 213 533 38,836 0 2 10
Urban Fragments
(No People)
23,886 2,120 1118 32,498 3 3 14
0 20 40 60 80 100 120 140 160 180 200 0
100 200 300 400 500 600 700 800 900 1000 Mo
[image:27.595.82.513.587.727.2]visit the world - the travel guide
19,303 1,903 12,666 64,886 0 0 34
Tables 4 and 5 provide details of the 5 smallest and largest groups from the sample
(ordered by the number of members) indicating the diversity of groups exhibited within the
[image:28.595.84.518.272.462.2]sample.
Table 5 The 5 smallest groups from our group sample
Group No. of
members
Desc. length (chars)
Uploads by 1st poster
No. of photos
No. of moderators
No. of admins
Avg. upload/ member
Balbriggan Counrt
Dublin
2 0 74 74 0 1 37
For-all-Religions/ 2 93 3 4 0 0 2 St. Patrick´s Day
Shenanigans
2 35 1 1 0 0 1
Kitty Pics 1 34 115 115 0 1 115 TREES OF
IRELAND
1 0 77 77 0 1 77
6. Discussion
In order to produce a more detailed characterization of Flickr groups, we proposed
emulating Butler’s (1999) earlier study of Listervs to look at aspects of membership,
communication activity and communication structure in Flickr groups, using the API and
data-scraping to collect data for a large sample of groups. One contribution of the paper is to
establish the order of magnitude of groups on Flickr. Butler was interested in what the metrics for
different online groups suggested about the most appropriate metaphor to describe them, be that
small group, voluntary association or online collective. Taking into account the differences
between photo sharing and online discussions, we proposed a number of other potentially
interesting metrics. For example, we suggested looking at formalisation of rules and roles..
Another contribution of the paper is to take forward a discussion about the most appropriate
adapted for analysing Flickr.
What stands out from the group metrics is the large number of groups with only a handful
of members and low levels of activity. Nearly 50% of groups have less than 10 members; 20%
have only 1. This undergrowth of small groups may be an important part of the ecology of Flickr.
On the other hand, there are also some large and very groups, whose scale is very much larger than
those seen in Butler’s work, in terms of numbers of members and contributions. The big groups
tend not to be dominated by a few individuals. So although many writers have talked about a
power law in participation, this does not seem to apply to Flickr groups as such.
Web2.0 as the “social web” is different in quality from the world of online communities.
The social network model of design seems to be superseding or more accurately overlaid on the
online community model. Yahoo! groups, for example, organize social activity around
participation and interaction in interest groups, where the group is a central reference point. In the
SN model the individual is central, and membership of groups more fleeting, less exclusive. Much
Flickr activity is not really centred on groups. 50% of people do not ever post to groups (Negoescu
& Gatica Perez 2008). The sites are social in that content is created by a mass of individuals, but
the levels of direct interaction are not always very high. Yet groups do also form and the large
number of Admins and moderators point to a level online community feeling emerging too.
A further contribution of the paper revolves around the accessibility of information about
large sites such as Flickr. Despite the existence of much publicly available information for Flickr
and an open API, there is much that is not or cannot be known about such sites. This arises from
two main factors. Firstly, some information is simply not recorded. Thus although profiles on
Flickr did originally have a field for sex, this was removed, so it is not recorded in profiles. The
place where the member is based is a free text field, so this data is hard to process. It is also hard to
interpret: the information could be about where the person originates or were born, but it could just
be about where they are now. Secondly, the structure of the database makes it very hard to extract
limited. Thus it would be interesting to look at the extent to which group members commented on
each other’s photos. But the only way to measure this would be to scrape the IDs of (a sample of)
photos in the group pool, then scrape commenter IDs from the photo’s page, and then compare
these to the list of group members (which would itself have to be scraped from the member listing).
Thus many of the questions one would like to ask are not easily answerable from the accessible
data.
7. Conclusions and Future Work
This paper has explored the role of groups on Flickr. It has discussed suitable metrics for
examining activity levels, especially to capture the “groupness” of a group. It has shown how
many groups there are. It has also begun to show what Flickr groups are typically like. It has
pointed to the importance of small groups on Flickr. This was not apparent before because the
large active groups are more visible, e.g. in search results. Thus although it is vast in terms of
numbers of photos and members, groups in Flickr operate at a more human scale. This might be
one aspect of its success: that nested within the larger groups there are patches of activity and
organisation. Some feel for the overall character of groups on Flickr allows us to benchmark
specific groups. The paper has also demonstrated some quite profound obstacles to fully exploring
the character of participation, at least to doing so efficiently.
It is not part of our suggestion that groups are necessarily central to the experience of Flickr
for many users. Only committed users join groups. But it is one aspect of Flickr, and clearly in
complex ways has contributed to the success of the design. Understanding how individual centred
activity such as organizing one’s own photos or commenting on those of others links to online
community activity in such web sites is important. Qualitative studies could examine the character
of different sized groups, looking more closely at the different types of group, how these relate to
References
Butler, B. S., 1999. When is a group not a group: An empirical examination of metaphors for
online social structure. Working paper Katz Graduate School of Business, University of Pittsburgh.
http://www.pitt.edu/~bbutler/KatzWorkingPaper2001.pdf, [accessed 01.08.05].
Backstrom, L., Huttenlocher, D., Kleinberg, J. & Lan, X. (2006). “Group formation in large social
networks: Membership, growth, and evolution,” Proceedings of the Twelfth ACM SIGKDD
International Conference on Knowledge Discovery and Data Mining (Philadelphia), pp. 44–54.
Castro, M.C. (2006). The Macuarium set of community of practice measurements.
http://www.macuarium.com/cms/index.php?option=com_remository&Itemid=0&func=fileinfo&
id=447
Cothrel, J.P. (2000). Measuring the success of an online community, Strategy and Leadership 28
(2) 17-21.
Cox, A.M., Clough, P. & Marlow, J. (2008). "Flickr: a first look at user behaviour in the context of
photography as serious leisure." Information Research 13 (1)
http://informationr.net/ir/13-1/paper336.html.
Cox, A.M. (2008). Flickr: A case study of Web2.0 Aslib Proceedings 60 (5) 493-516.
Cummings, J. N., Butler, B., and Kraut, R. (2002). “The quality of online social relationships,”
Davies, J. (2006). Affinities and beyond! Developing ways of seeing in online spaces, E-learning,
3 (2).
Herring, S. C. (2004).“Computer-mediated discourse analysis: An approach to researching online
behavior,” In S. Barab, R. Kling, & J. H. Gray (Eds.), Designing for Virtual Communities in the
Service of Learning. New York: Cambridge University Press.
Malinen, S. (2010). Photo exhibiton or online community? Fifth International Conferencce on
Internet and Web Applications and Services, Barcelona, Spain.
Miller, A.D. & Edwards, W.K. (2007). Give and take: a study of consumer photo-sharing culture
and practice, Proceedings of CHI 2007, San Jose, California.
Naaman, M. (2006) Eyes on the World, IEEE Computer, 39(10): 108-111.
Negoescu, R. A. and Gatica-Perez, D. (2008). Analyzing Flickr groups. In Proceedings of the 2008
international Conference on Content-Based Image and Video Retrieval (Niagara Falls, Canada,
July 07 - 09, 2008). CIVR '08. ACM, New York, NY, 417-426.
Nov, O., Naaman, M., and Ye, C. 2008. What drives content tagging: the case of photos on Flickr.
In Proceeding of the Twenty-Sixth Annual SIGCHI Conference on Human Factors in Computing
Systems (Florence, Italy, April 05 - 10, 2008). CHI '08. ACM, New York, NY, 1097-1100.
Nov, O., Naaman, M. & Ye, C. (2009). Analysis of participation in an online photo-sharing
community: a multidimensional perspective, Journal of the American Society for Information
Prieur, C., Cardon, D., Beuscart, J.-S., Pissard, N., and Pons, P. The strength of weak cooperation:
A case study on flickr, Feb 2008. http://arxiv.org/abs/0802.2317
Perez, J.C. (2007). Flickr co-founder talks about growth plans.
http://www.macworld.com/article/56711/2007/03/flickr.html
Recuero, R. (2007) Communities in Social Networks: A Case Study of Brazilian Fotolog. In:
Internet Research 8.0: Let's Play, 2007, Vancouver. Proceedings of AIR 8.0.
Swart, M. (2008). An analysis of group behavior and commenting on Flickr, MA Dissertation,
Department of Information Studies, University of Sheffield.
Schoberth, T., Preece, J. & Heinzl, A. (2003). “Online communities: a longitudinal analysis of
communication activities,” System Sciences, 2003. Proceedings of the 36th Annual Hawaii
International Conference on System Sciences, vol. 7, pp. 216a (Track 7), 6-9 Jan. 2003
Sigurbjörnsson, B. and van Zwol, R. 2008. Flickr tag recommendation based on collective
knowledge. In Proceeding of the 17th international Conference on World Wide Web (Beijing,
China, April 21 - 25, 2008). WWW '08. ACM, New York, NY, 327-336.
Smith, M. (2002). Tools for navigating large social cyberspaces, Communications of the ACM, 45,
pp. 51-54.
van House, N., Davis, M., Ames, M., Finn, M. & Viswanathan, V. (2005). The uses of personal
of the CHI 2005, Portland, Oregon.
Van Laere, O., Schockaert, S., and Dhoedt, B. (2010) Towards automated georeferencing of Flickr
photos. In Proceedings of the 6th Workshop on Geographic information Retrieval (Zurich,
Switzerland, February 18 - 19, 2010). GIR '10. ACM, New York, NY, 1-7.
van Zwol, R. (2007) “Flickr: Who is looking?” In Proceedings of IEEE/WIC/ACM International
Appendix
[Insert Appendix Here]
Correlationsa
1 .488** .288** .884** .007 .044 .198** .501** .516**
.000 .000 .000 .853 .219 .000 .000 .000
.488** 1 .187** .416** -.002 .056 .101** .231** .240**
.000 .000 .000 .958 .123 .005 .000 .000
.288** .187** 1 .133** .341** .344** .037 .121** .096**
.000 .000 .000 .000 .000 .305 .001 .008
.884** .416** .133** 1 -.003 .000 .123** .548** .575**
.000 .000 .000 .930 .991 .001 .000 .000
.007 -.002 .341** -.003 1 .894** .000 .006 .002
.853 .958 .000 .930 .000 .992 .868 .952
.044 .056 .344** .000 .894** 1 -.012 -.009 -.004
.219 .123 .000 .991 .000 .748 .795 .908
.198** .101** .037 .123** .000 -.012 1 .195** .166**
.000 .005 .305 .001 .992 .748 .000 .000
.501** .231** .121** .548** .006 -.009 .195** 1 .900**
.000 .000 .001 .000 .868 .795 .000 .000
.516** .240** .096** .575** .002 -.004 .166** .900** 1
.000 .000 .008 .000 .952 .908 .000 .000
Pearson Correlation Sig. (2-tailed) Pearson Correlation Sig. (2-tailed) Pearson Correlation Sig. (2-tailed) Pearson Correlation Sig. (2-tailed) Pearson Correlation Sig. (2-tailed) Pearson Correlation Sig. (2-tailed) Pearson Correlation Sig. (2-tailed) Pearson Correlation Sig. (2-tailed) Pearson Correlation Sig. (2-tailed) NUMMEMBERS NUMDISCUSSIONS DESCRIPTIONLENGTH NUMPHOTOS MODERATORS ADMINS EXISTENCE TOP1AVGUPLOAD TOP5AVGUPLOAD NUMMEM BERS NUMDISC USSIONS DESCRIPTI ONLENGTH NUMPHOTOS MODERA
TORS ADMINS EXISTENCE
TOP1 AVGUPLOAD
TOP5 AVGUPLOAD
Correlation is significant at the 0.01 level (2-tailed). **.
Author Note
Footnotes
Table 1