0
University of Southern Queensland
Faculty of Health, Engineering and sciences
Research Topic
Deterioration of Timber Bridges Using a Fault Tree Analysis
A dissertation submitted by
Matthew Wilson
In fulfilment of the requirements of
ENG4111 and 4112 Research Project
Towards the degree of
Bachelor of Engineering (Civil) Honours
2
Abstract
The Department of Transport and Main Roads within the Mackay/Whitsundays region has 62 timber bridges which have progressively deteriorated and are nearing the end of their operational life expectancy. The department is responsible for providing a safe and operational road network which includes the appropriate maintenance of these timber structures. It is expected that within the Mackay/Whitsunday region there is an annual expenditure of approximately 5 million dollars allocated to maintain and rehabilitate timber bridges, which highlights the need for effective and timely maintenance scheduling. This dissertation will identify the probability of conditional state of movement for each structural member of a timber bridge.
The probability of deterioration of these structures are indicative of the deterioration rate over 3 time periods (2, 3 and 5 years). Inspection reports are used for the foundation of the data to identify and track the movement paths for the different condition states. The movement of condition states are then subjected to probability methods (Markov Chain, Fault Tree Analysis) to depict the chance of a member changing condition states over that time period.
3
University of Southern Queensland
Faculty of Health, Engineering and Sciences
ENG4111 & ENG4112 Research Project
Limitations of Use
The Council of the University of Southern Queensland, its Faculty of Health, Engineering and Sciences, and the staff of the University of Southern Queensland, do not accept any responsibility for the truth, accuracy or completeness of material contained within or associated with this dissertation.
Persons using all or any part of this material do so at their own risk, and not at the risk of the Council of the University of Southern Queensland, its Faculty of Health, Engineering and Sciences or the staff of the University of Southern Queensland.
4
Certification
I certify that the ideas, designs and experimental work, results, analyses and conclusions set out in this dissertation are entirely my own effort, except where otherwise indicated and acknowledged.
I further certify that the work is original and has not been previously submitted for assessment in any other course or institution, except where specifically stated.
Matthew Wilson
5
Acknowledgement
Firstly, I would like to acknowledge my supervisor Dr Weena Lokuge (USQ) for the constant support, motivation and immense knowledge throughout this dissertation. Dr Weena Lokuge guided and assisted my learning and development while researching and writing this project. I am extremely thankful and indebted to her for the constant guidance.
In addition, I would like to recognize Nathan Salter, Alan Voll and Tyrell Webster for their constant insight into timber bridges within the Mackay/Whitsundays region. The guidance and expertise supplied by Nathan and Tyrell to help develop my understanding of timber bridges coupled with the assistance to find information needed to complete this project has been invaluable.
I would also like to thank the Department of Transport and Main Roads in Mackay for the access to any information needed and the expertise on hand when needed. The Department of Transport and Main Roads generously provided the information required making access to key data and also providing constant technical support.
6
Table of Contents
Chapter 1 Introduction ... 11
Introduction ... 11
Project Aims and Objectives ... 13
Expected Outcomes... 14
Chapter 2 Literature Review ... 15
Introduction ... 15
Asset Deterioration Terminology... 17
Asset Management ... 19
Risk Management and Legal Liability ... 20
Inspections ... 21
Timber Bridge Deterioration Mechanisms ... 26
Deterioration Mechanisms Summary ... 33
Fault Tree Analysis ... 34
Chapter 3 Methodology... 37
Introduction ... 37
Dissertation phasing ... 37
Phase 1 – Start Up ... 37
Phase 2 – Data Collection ... 38
Phase 3 – Data Analysis ... 44
Phase 4 – Implementation ... 45
Chapter 4 Results and Discussion ... 46
Findings ... 47
Inspection reports ... 47
Excel Model ... 48
Deck ... 49
Kerb ... 49
Girder ... 50
Corbels ... 51
Piles ... 52
Headstocks ... 53
Whales and Bracing ... 54
Fault Tree Analysis ... 55
Chapter 5 Conclusion and Further Recommendation ... 58
Future Recommendation ... 59
Chapter 6 References ... 60
Appendix A - Project Specification ... 66
8
List of Figures
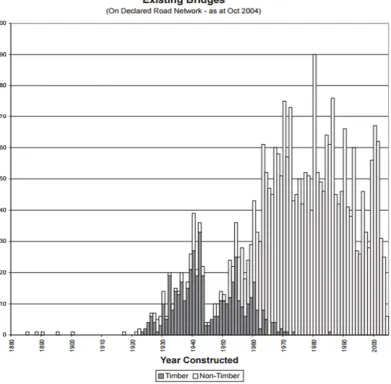
Figure 1.1 – Amount of Bridges Constructed Per Year (Timber bridge Maintenance
Manual, 2005)... 11
Figure 2.1 – Asset Life Cycle ... 18
Figure 2.3 - Termite Damage in Deck Planks ... 27
Figure 2.2 - Fungal Fruiting Body and Decay of Girder ... 27
Figure 2.4 - Splitting in Girder ... 27
Figure 2.5 - Rotted Ends of Deck Planks ... 27
Figure 2.6 - Weathered and Rotted Timber deck Planks ... 28
Figure 2.7 – Rotting of Abutment pile below ground level (possible marine deterioration) ... 28
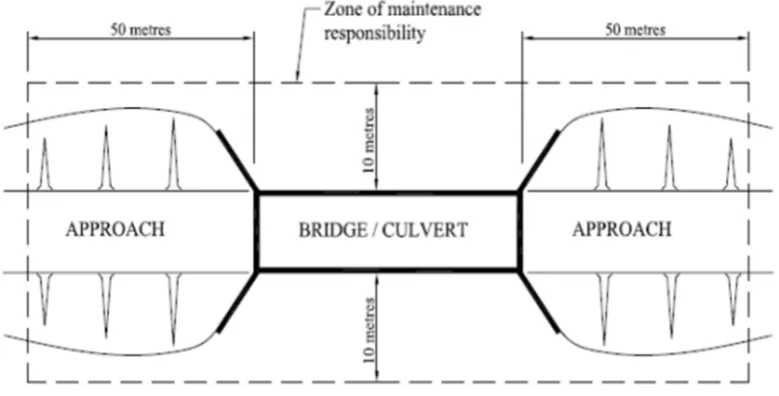
Figure 2.8 – Extent of servicing/maintenance envelope... 32
Figure 3.1 - Tracking of Condition State Movement ... 43
Figure 3.2 – Fault Tree Analysis model ... 45
Figure 4.1 - Probability of Condition State Movement – Deck ... 49
Figure 4.2 – Probability of Condition State Movement – Kerb ... 50
Figure 4.3 – Probability of Condition State Movement – Girders ... 50
Figure 4.4 – Probability of Condition State Movement - Corbels ... 51
Figure 4.5 – Probability of Condition State Movement - Piles ... 52
Figure 4.6 – Probability of Condition State Movement - Headstock ... 53
Figure 4.7 – Probability of Condition State Movement – Whales and Bracing ... 54
Appendix C 1 – Cross-Section of Timber Bridge ... 70
Appendix E 1 – FTA 2 Years 1-1 ... 89
Appendix E 2 – FTA 2 Years 1-2 ... 89
Appendix E 3 – FTA 2 Years 1-3 ... 90
Appendix E 4 – FTA 2 Years 1-4 ... 90
Appendix E 5 – FTA 2 Years 2-2 ... 91
Appendix E 6 – FTA 2 Years 2-3 ... 91
Appendix E 7 – FTA 2 Years 2-4 ... 92
Appendix E 8 – FTA 2 Years 3-3 ... 92
Appendix E 9 – FTA 2 Years 3-4 ... 93
Appendix E 10 – FTA 2 Years 4-4 ... 93
Appendix E 11 – FTA 3 Years 1-1 ... 94
Appendix E 12 – FTA 3 Years 1-2 ... 94
Appendix E 13 – FTA 3 Years 1-3 ... 95
Appendix E 14 – FTA 3 Years 1-4 ... 95
Appendix E 15 – FTA 3 Years 2-2 ... 96
Appendix E 16 – FTA 3 Years 2-3 ... 96
Appendix E 17 – FTA 3 Years 2-4 ... 97
Appendix E 18 – FTA 3 Years 3-3 ... 97
Appendix E 19 – FTA 3 Years 3-4 ... 98
Appendix E 20 – FTA 3 Years 4-4 ... 98
Appendix E 21 – FTA 5 Years 1-1 ... 99
Appendix E 22 – FTA 5 Years 1-2 ... 99
Appendix E 23 – FTA 5 Years 1-3 ... 100
Appendix E 24 – FTA 5 Years 1-4 ... 100
Appendix E 25 – FTA 5 Years 2-2 ... 101
Appendix E 26 – FTA 5 Years 2-3 ... 101
Appendix E 27 – FTA 5 Years 2-4 ... 102
Appendix E 28 – FTA 5 Years 3-3 ... 102
Appendix E 29 – FTA 5 Years 3-4 ... 103
9
List of Tables
Table 2.1 – Transport and Main Roads Terminology and Definitions ... 17
Table 2.2 – Inspection Frequency ... 24
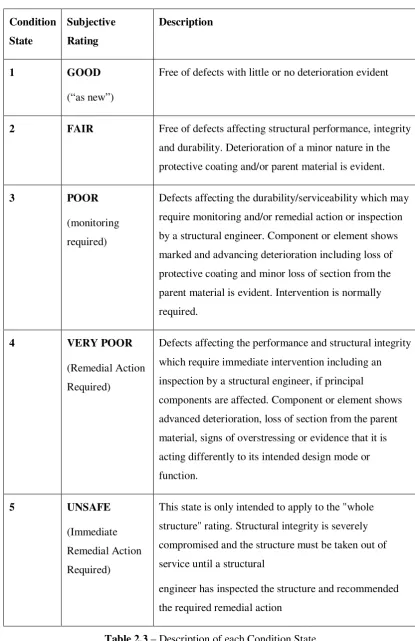
Table 2.3 – Description of each Condition State ... 25
Table 2.4 – Significance Rating for Component (Bridge Inspection Manual, 2004) ... 29
Table 2.5 – Hazard Levels for different service conditions (Main Roads, 2008) ... 31
Table 2.6 – Fault Tree Gate Symbol and Descriptions (Ericson, 1999) ... 34
Table 2.7 – Fault Tree Event Symbols and Descriptions (Ericson, 1999) ... 35
Table 3.1 – Timber Bridges in the Mackay/Whitsundays Region (TMR)... 40
Table 3.2 – Piles Excel model from Inspection Reports Data ... 41
Table 3.3 – Standard Component Matrix (Bridge Inspection Manual, 2004)... 42
Table 4.1 - FTA Probabilities ... 55
Table 4.2 – FTA for 2 Years for CS movement 1-4 ... 56
Table 4.3 – FTA for 3 Years for CS movement 1-4 ... 56
Table 4.4 – FTA for 5 Years for CS movement 1-4 ... 57
Appendix B 1 – Personal Risk, Likelihood and Consequence Matrix ... 67
Appendix B 2 – Personal Risk Assessment for Each Activity ... 68
10
Glossary
FTA Fault Tree Analysis FTD Fault Tree Diagram
BIS Bridge Information System BAM Bridge Asset Management
TMR Department of Transport and Main Roads USQ University of Southern Queensland CS Condition State
AADT Annual Average Daily Traffic UV Ultraviolet
11
Chapter 1
Introduction
Introduction
[image:11.595.106.498.346.730.2]The Department of Transport and Main Roads (Mackay, Queensland) has responsibility for 2,670 kilometres of road network with 297 bridges (62 timber bridges). The majority of timber bridges were constructed in the early 20th century (Figure 1.1) which is indicative of their current Condition State (CS). As depicted in the Bridge Inspection Manual (2004), only 3 bridges have been constructed from timber since 1970 (Figure 1.1). Generally timber bridges have performed well under the conditions to which they are subjected, however due to the age of these structures, the efficient operation of these bridges are nearing their end.
12 Timber bridges are constructed with piles, waling, bracing, pile caps, girders, corbels, stringers, decking and balustrades (Appendix. Timber bridge deterioration can be natural (rotting) or human made (new truck suspension system, damage from vehicle impacts), predictable or totally unexpected which has the ability to range from minor to critical which can cause considerable damage and threat to road users and the public. The speed of deterioration of timber bridges can be slowed if correct maintenance is performed, however this can be expensive and time consuming.
Their asset value, operational and strategic importance make these timber bridges a critical components of the state-controlled road network. The Mackay and Whitsundays district road network is limited in comparison to the area of the region (158,167km²), and therefore if a structure is closed due to failure it is arduous and uneconomical for the local populous. The Annual Average Daily Traffic (AADT) and heavy vehicles depict the safe performance requirements of that structure which is indicative of the maintenance schedule (outlined by Department of Transport and Main Roads).
The Department of Transport and Main Roads (TMR), Queensland is responsible for the maintenance and condition of timber bridges which is conducted through bridge inspection reports, Bridge Asset Management (BAM), Whichbridge and Bridge Information Systems (BIS). Bridge inspection reports are documented and entered into BIS which is controlled by the BAM and analysed by the Whichbridge software. It is predicted that Condition States of timber bridges can be analysed using algorithms, however probability deterioration of these timber bridges cannot be determined until the failure occurs.
13
1.1 - Project Aims and Objectives
The scheduling and funding provided for timber bridges are limited to inspection reports and the rating given from the Whichbridge program. On this basis, the aim of the project is to provide a relevant probability of timber bridge deterioration using a Fault Tree Analysis of the failing components. Further development of the objectives within this report are:
• Determine the probability of timber bridges to move Condition State • Identify the possible deterioration mechanisms within the timber structure
• To compare the probability of movement and the causes with deterioration probability software
Deterioration mechanisms vary depending on many factors such as the environment, Annual Average Daily Traffic (AADT) and the maintenance performed. This investigation into the deterioration of timber bridges will result in the probability of the structure moving from a known condition state to a higher rating. These structures will then be examined from the prepared Fault Tree Analysis (FTA) to determine the causes of movement and the failure mechanisms that caused the shift. A comparative analysis will then be undertaken on the model (constructed from excel) which will then be examined with other probability software (e.g. Whichbridge).
14
1.2 - Expected Outcomes
The expected outcomes from this dissertation is to identify the probability of movement of condition states over 3 constant time periods. It is expected that a linear change in condition state will be present in accordance with the periods of time. The deterioration of each member to a timber bridge is expected to be constantly declining. The expected outcome is that the probability of condition state movement will constantly change in even intervals (assuming no maintenance has been completed on the member).
15
Chapter 2
Literature Review
Introduction
The Department of Transport and Main Roads recognise the essential requirements of managing timber bridge assets and their deterioration to certify that the road network is of the highest level of safety to their customers (road users) as possible. Constant deterioration of timber bridges highlights the importance and requirement to replace and maintain structures so they meet the current standards. Bridge maintenance has a large impact on the department’s budget and therefore proactive measures must be implemented by:
• Developing bridge maintenance programs (Whichbridge, BridgeGuide) • Collating and updating bridge conditions
• Formulating programs that assist in programming maintenance • Integrating related maintenance and scheduling strategies
Maintenance and management of timber bridge systems involve a rational and systematic approach to ensure correct programming and implementation on a state-wide scale. Bridge Asset Management (BAM) systems will assist in efficient maintenance programming, however correct implementation of maintenance programs must be supervised by a responsible, competent and knowledgeable bridge manager or engineer. In determination of maintenance programs the responsible persons must consider the previous performance, condition state, environment, cost estimates and political, legal and social factors (Local Roads Bridge Management Manual, 2000).
16 management performance. The following is an extract from the Transport Infrastructure Asset Management policy:
“The following principles collectively guide the current management and future development of TMR’s transport infrastructure assets:
• Implement international best practice benchmarks for asset management
• The British Standards Institution’s (BSI) Public ally Available Specification (PAS) 55-1:2008 Asset Management will be the international benchmark used by TMR
• Deliver a ‘fix it first’ approach
• Use the full potential of existing assets by proactively repairing or rehabilitating networks rather than replacing them to ensure their sustainability
• Ensure whole-of-life costs are factored into transport infrastructure developments
• Capital expansion programs and projects will be accompanied by a clear position on the ongoing funding required to maintain and operate the new assets and services
• Provide ‘fit for purpose’ transport solutions
• Maintain existing assets to a ‘fit for purpose’ condition that is sustainable
• TMR will define appropriate, affordable levels of service which balance performance, costs and
risks over the asset’s life to ensure the transport network is sustainable.”
17
2.1 - Asset Deterioration Terminology
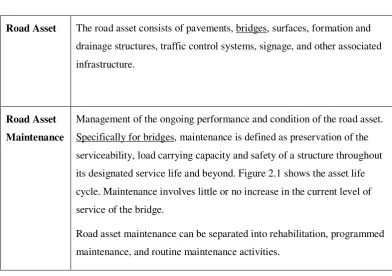
Asset deterioration and asset maintenance terminology with their definitions is portrayed in the Transport and Main Roads ‘Engineering Policy Statement (1999)’ which is depicted in Table 2.1.
Road Asset The road asset consists of pavements, bridges, surfaces, formation and
drainage structures, traffic control systems, signage, and other associated
infrastructure.
Road Asset
Maintenance
Management of the ongoing performance and condition of the road asset.
Specifically for bridges, maintenance is defined as preservation of the
serviceability, load carrying capacity and safety of a structure throughout
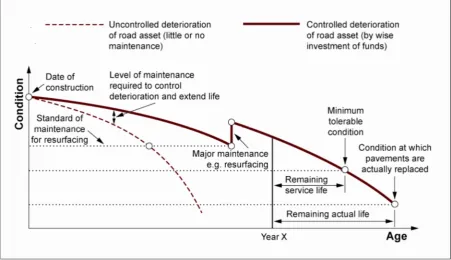
its designated service life and beyond. Figure 2.1 shows the asset life
cycle. Maintenance involves little or no increase in the current level of
service of the bridge.
Road asset maintenance can be separated into rehabilitation, programmed
[image:17.595.99.492.200.476.2]maintenance, and routine maintenance activities.
18
Figure 2.1 – Asset Life Cycle
(Source: Austroads, Guide to Asset Management, 2009)
19
2.2 - Asset Management
Asset management is essential for the effective and efficient operation of TMR and it is essential to monitor and document assets and their condition. Depicted by Austroads ‘Guide to Asset Management Part 1: Introduction to Asset Management’ (2009):
To ensure a safe and operation road network it is essential to have a strategic view to manage demand and match this demand through ongoing provision of new and upgraded links and maintenance of existing stock. To limit the long term cost to the community and road users this system must be efficient.
To ensure efficient and effective asset management a guide can be established to offer guidance and best practices, which can be defined by Austroads ‘Guide to Asset Management Part 1: Introduction to Asset Management’ (2009):
• adoption of a rigorous, and cyclic process-based approach which is policy-driven and results oriented and customer focused
• manages current assets and provides for future assets • provides a defined level of service
• develops cost-effective programs for the long-term • manages risks associated with asset failures
• requires performance monitoring, audit and feedback
• employs appropriate quality information and decision support tools
• encourages continuous improvement in asset management practices and human resource skill development
• encourages development of clear business processes and organisational accountabilities.
20
2.3 - Risk Management and Legal Liability
The Department of Transport and Main Roads are the authority for the state-controlled road networks and its assets. TMR has a duty of care to the public and its road users which is implemented through maintenance, repairs and replacements. The Queensland government may be liable for injuries and losses if the road authority did not provide a safe and appropriate operational network, however depending on the situation, the evidence will determine the extent (if any) of liability.
In order for TMR to satisfy its duty of care to road users, TMR must demonstrate and execute a reasonable schedule for the inspection of the road network (including timber bridges) to identify any failures or defects. Additionally, the road authority must also implement a reasonable and responsible schedule for planning, repairs, maintenance, replacements and upgrades.
21
2.4 - Inspections
The majority of bridges built prior to the middle of the 1900’s were constructed from timber with the majority of these only present on low volume roads. Although these structures are present on low AADT roads, the heavy vehicle usage and environment conditions effect the condition and rating of these bridges. To ensure the safe operation and to adhere to the duty of care undertaken by TMR, frequent inspections are required to establish if there are any defects or failures or if any are imminent or likely to occur.
Bridge inspection reporting is a method of controlling the safety and condition of structures throughout road networks. A three level hierarchy system is used to control the safe operation of bridges throughout the state which was introduced in March 1998. The scope of each level of inspection reports are depicted below (Bridge Inspection Manual, 2004):
Level 1 – Routine Maintenance Inspection
Inspection of approaches, waterway, deck/footway, substructure, superstructure and attached services to assess and report any significant visible signs of distress or unusual behaviour, including active scours or deck joint movements.
Check of miscellaneous inventory items, including the type, extent and thickness of the bridge surfacing as well as details of existing services.
Recommendation of a Bridge Condition Inspection if warranted by observed distress or unusual behaviour of the structure.
Identify maintenance work requirements, and record on the Structure Maintenance Schedule form (M1).
22 Level 2 – Bridge Condition Inspection
Compiling, verifying and updating inspection inventory element items as appropriate. Visual inspection of the principal bridge components (including measurement of crack widths, etc.) and an assessment of condition using a standard condition rating system as defined in the inspection procedures.
Visual inspection to identify any suspected asbestos containing material.
The inspection of timber bridges will be supplemented by a drilling investigation, and will also include the identification and reporting of undersized timber members.
‘Soundings’ to determine the presence of active scour.
Reporting the condition of the principal bridge components and determining an aggregate rating of the structure as a whole.
Identifying and programming preventative maintenance requirements and recording on the Structure Maintenance Schedule form (M1). If access equipment is required to conduct the inspection, then routine / preventative maintenance may also be completed in conjunction with the inspection.
Requesting a detailed bridge inspection by a bridge engineer if warranted by apparent rapid changes in structural condition and/or apparent deterioration to condition state 4.
Development of "Structure Management Plans" in conjunction with Structures Division for all defective structures. Refer to Appendix F for plan guidelines.
Underwater inspections of those elements in permanent standing water at the specified frequency.
Recommending requirements for the next inspection and nominating components for closer monitoring as appropriate.
Recommending supplementary testing as appropriate.
23 Level 3 – Inspection
Undertake numerical modelling or other calculations.
To prepare a Structural Management Plan based on Level 2 inspection data that the engineer believes is comprehensive and adequately describes the structure. This occurs where it is considered that the risk can be adequately managed with known data without visiting the site again.
Management of Potentially Structurally Deficient Bridges based on Level 2 inspection and other data that the engineer believes is comprehensive and adequate to determine if the theoretical deficiency is consistent with the observed condition of the bridge component. This occurs where it is considered that the risk can be adequately managed with known data without visiting the site again.
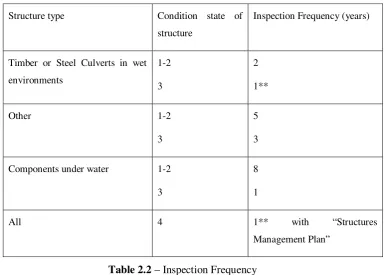
24 Structure type Condition state of
structure
Inspection Frequency (years)
Timber or Steel Culverts in wet
environments
1-2
3
2
1**
Other 1-2
3
5
3
Components under water 1-2
3
8
1
All 4 1** with “Structures
[image:24.595.114.499.78.353.2]Management Plan”
Table 2.2 – Inspection Frequency
25
Condition
State
Subjective
Rating
Description
1 GOOD
(“as new”)
Free of defects with little or no deterioration evident
2 FAIR Free of defects affecting structural performance, integrity
and durability. Deterioration of a minor nature in the protective coating and/or parent material is evident.
3 POOR
(monitoring required)
Defects affecting the durability/serviceability which may require monitoring and/or remedial action or inspection by a structural engineer. Component or element shows marked and advancing deterioration including loss of protective coating and minor loss of section from the parent material is evident. Intervention is normally required.
4 VERY POOR
(Remedial Action Required)
Defects affecting the performance and structural integrity which require immediate intervention including an inspection by a structural engineer, if principal
components are affected. Component or element shows advanced deterioration, loss of section from the parent material, signs of overstressing or evidence that it is acting differently to its intended design mode or function.
5 UNSAFE
(Immediate Remedial Action Required)
This state is only intended to apply to the "whole structure" rating. Structural integrity is severely compromised and the structure must be taken out of service until a structural
[image:25.595.87.503.48.690.2]engineer has inspected the structure and recommended the required remedial action
26
2.5 - Timber Bridge Deterioration Mechanisms
Considering timber bridges were constructed up until the middle of the 1900’s it could be construed that they have performed adequately, however due to the nature of timber these structures are inevitably deteriorating. The majority of timber bridges are on low volume trafficable road networks with just under one quarter of all structures being constructed from timber. The deterioration of timber bridges can be in many forms including (Bridge Inspection Manual, 2004):
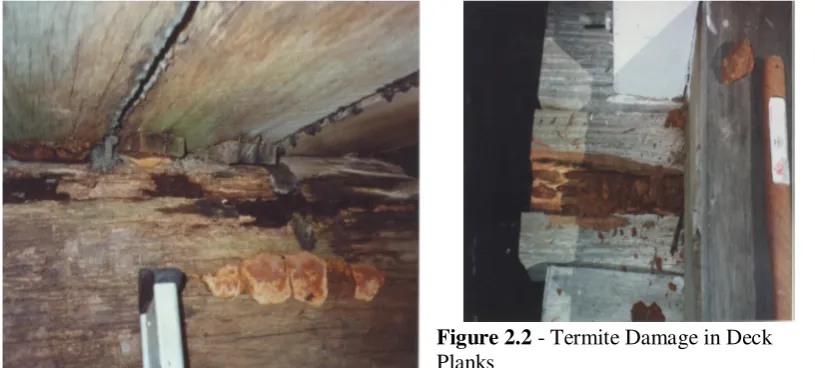
1. Fungal (rotting) - decay of timber by fungi from internal and external growth (Figure 2.2).
2. Termites - identified as subterranean termites that consume dead timber which leave the bridge components weak and brittle (Figure 2.3).
3. Shrinkage and Splitting - due to the timbers (green/new) drying below its fiber saturation point the components start to shrink and/or split (Figure2.5).
4. Marine organisms - underwater timber is damaged via marine borers (Figure 2.6). 5. Corrosion of Fasteners - a chemical reaction causing rusting and ‘loss of section’
causing significant strength loss.
6. Fire damage – when timber burns the density starts to decay causing the structure to become weak and brittle.
27 (Source – Timber Bridge Maintenance Manual, 2005)
(Source – Timber Bridge Maintenance Manual, 2005)
[image:27.595.98.506.82.266.2]Figure 2.3 - Fungal Fruiting Body and Decay of Girder
[image:27.595.336.496.411.588.2]Figure 2.2 - Termite Damage in Deck Planks
[image:27.595.99.312.414.594.2]28 (Source – Timber Bridge Maintenance Manual, 2005)
Figure 2.6 - Weathered and Rotted Timber deck Planks
29
30 Each component of the structure can be classified according to its significance within the bridge (Table 2.4). The higher the weighting the more significant that component has on the integral structure, and subsequent risk of failure. Deterioration of timber bridges can vary depending on the environment and conditions to which the structure is subjected. It is therefore imperative that a systematic interpretive system be established to reasonably predict the probability and possible cause of failure. Deterioration from fungal growth is evident in timber with more than 20% of moister with a serious decay occurring between 28-30 percent (Wacker, 2015). If the structure is subjected to this moisture content for an extended period, the fungal growth has a considerable impact on the integrity of the timber (Wacker, 2015, White, Ross, 2014). Fungi growth in timber structures will thrive when the following conditions are present (Main Roads 2008):
• Moisture >20%
• Oxygen (submerged timber greater then 600mm is rarely attached)
• Temperature >25˚C to <40˚C is ideal for deterioration with temperatures 5˚C to 40˚C retarding growth
• Food source (e.g. minerals and carbohydrates)
31
Table 2.5 – Hazard Levels for different service conditions (Main Roads, 2008)
Weathering is the process of wetting, drying, and exposure to ultraviolet (UV) radiation which decays timber and other components. If timber is untreated/maintained the structure can deteriorate rapidly and cause major structural faults (Timber Bridge Maintenance Manual, 2005, Main Road, 2008). Untreated/maintained timber can cause splitting in components, corrosion of fasteners and weakening of microstructure (Main Road, 2008, Timber Bridge Maintenance Manual, 2005, Faber, 2006). The exposure to weather is dependent on the location of the structure, therefore asset management should reflect this (Main Roads, 2008, Timber Bridge Maintenance Manual, 2005).
32
Figure 2.8 – Extent of servicing/maintenance envelope
In the case a fire impacts a timber bridge, inspection and testing must be carried out to ensure the microstructure of the component is sound (Bridge Inspection Manual, 2004). Fire damage can weaken timber by deteriorating the density of the components which cause the strength to decrease and intern the structure. If the timber component has sign of deterioration (e.g. fungi, weather, termite) the temperature of ignition will become lower causing the structure to be at risk.
33
2.6.1
Deterioration Mechanisms Summary
34
2.7 - Fault Tree Analysis
Fault Tree Analysis (FTA) was developed by H.A. Watson of Bell Laboratories who was directed by the United States Air Force to create a risk assessment tool (
Ericson, 1999)
. FTA consists of both qualitative and quantitative risk assessments. Qualitative analysis depicts a visual model of events prior to failure/defect their relationships (Ericson, 1999). FTA depicts a ‘top’ symbol (e.g. Timber Bridge) and uses gate and event symbols to illustrate possible faults/defects of each component in the analysis. This analysis (for timber bridges) can be used for individual components or whole structures.Gate Symbol Gate Name Description
OR Output event occurs if one of the input events occurs
AND Output event occurs if all the input events occurs
EXCLUSIVE OR Output event occurs if one but not both of the input events occurs
INHIBIT GATE Output event occurs if a single input event and a conditional event occur
[image:34.595.100.507.294.696.2]PRIORITY AND Output event occurs if all input events occur in a specific sequential order
35
Event Symbol Event Name Description
INTERMEDIATE An event that results from one or more preceding
events acting through logic gates
BASIC Initiating event which
cannot be further developed
UNDEVELOPED An event that cannot be further developed due to insufficient information
CONDITIONAL A specific condition applied to an INHIBIT or
PRIORITY AND gate
HOUSE An event which is
[image:35.595.101.500.51.514.2]expected to occur or not occur
Table 2.7 – Fault Tree Event Symbols and Descriptions (Ericson, 1999)
36 Deterioration of timber bridges can be exploited using the FTA to depict the failure mechanism and the path the failure took to reach a certain condition state. Utilizing the FTA will allow for a clear and concise path to why a timber bridge moves condition states and the path the deterioration took. While investigating the deterioration of a timber bridge, a FTA can be undertaken to depict the cause of movement of condition states based on the failure. The FTA will be used to illustrate the behavior of the case bridge (Davis-Mcdaniel et al, 2013; LeBeau and Wadia-Fascetti, 2007; Sianipar and Adams, 1997) and how movement of condition states are conducted.
37
Chapter 3
Methodology
Introduction
The Management of all information associated with timber bridges is a complex and difficult task which is ideally suited to a computerized management system. Therefore, it is essential to program these systems (Whichbridge, BridgeGuide) to correctly represent timber bridges. To ensure the accuracy of this research, it is imperative that all input information is accurate and timely.
3.1 - Dissertation phasing
3.1.1 Phase 1 – Start Up
To ensure that the correct procedures are implemented and TMR are notified of the intention to investigate deterioration of timber bridges on state controlled roads, informing staff and managers must be completed. An investigation and plan has been conducted to ensure the information required by TMR (BIS, inspection reports) will be made available for the purpose of the dissertation.
To achieve optimal efficiency, the appropriate staff must be notified of the detailed action plan and the information/outcome required. Authorised staff are to be notified, as it is essential to apply and be given approval to collect, investigate and report on the findings (inspection reports). If required, the correct procurement processing must be followed as per TMR standards which depicts the requirement to receive approval.
38
3.1.2 Phase 2 – Data Collection
The dissertation is dependent on the information acquired from TMR and therefore it is essential to collect all inspection reports necessary and any other information (Whichbridge models and methodology). This collection phase will be conducted internally with access being previously obtained to BIS, BAM and all inspection reports. Constant discussions are essential between Project Managers and inspectors to identify any structures which conform to the requirements of the dissertation (timber).
Collecting inspection reports require expertise of what will be analyzed and the required outcome of the project. During the analysis phase it is anticipated that each component will be investigated individually. It is imperative that the timber components of the structure be specifically examined as this is the material most likely to show signs of fatigue or potential failure. Inspection reports and the coding of each component will depict the material and the condition state. Within the Bridge Information System, inspection reports can be split into 13 sections which depict the different components of that report (e.g. condition rating, timber drill report).
39
ID STRUCTURE NAME MATERIA L
ROA D
CHAINAG E
C S
LENGT H
WIDT H
SPAN S
7243 Mcgregor Creek TIMB 536 14.483 2 15.2 7.4 2
7385 Lonely Creek TIMB 33B 13.421 4 38 7.2 4
7384 Fiery Creek TIMB 33B 9.962 4 45.7 7.3 5
7223 Rock Creek TIMB 517 23.75 4 25.1 5.5 3
7212 Prospect Creek TIMB 512 208.691 4 41.1 6.7 5 7572 Carpet Snake
Creek TIMB 88B 0.596 4 15.24 5.49 2
7412 Suttor River TIMB 88B 68.085 3 27.43 3.66 4
7244 Dalrymple Creek TIMB 536 23.16 4 42.7 5.5 4
1151 Bottletree Creek TIMB 512 55.776 4 24.7 7.3 3 7206 Boothill Creek TIMB 512 180.822 4 27.4 3.7 3
7238 Cattle Creek TIMB 532 61.945 4 49.4 7.9 6
7265 Isaac River TIMB 5122 12.975 4 42 3.7 5
7220 Bell Creek TIMB 517 12.725 4 33 5.5 4
7279 Fursden Creek TIMB 5302 4.108 4 54.9 5.5 6
1152 Plumtree Creek TIMB 512 57.645 3 16.5 7.3 2
1157 Clarke Creek TIMB 512 83.046 4 36.6 7.3 4
7268 Main Creek TIMB 5124 38.635 4 18.3 3.7 2
7390 Kirkup Bridge TIMB 33B 78.183 4 36.6 6.8 4
7254 Victor Creek TIMB 854 12.875 3 15 3.7 2
7245 Murray Creek TIMB 536 24.92 4 36.6 5.5 4
7246 Silent Grove Ck TIMB 536 33.06 4 9.1 3.7 1
7280 Unnamed Creek TIMB 5302 21.865 3 8 3.7 1
7273 East Funnel
Creek TIMB 5126 22.474 4 27.4 3 3
7386 Boundary Creek TIMB 33B 16.681 4 38 7.2 4
7387 Cut Creek TIMB 33B 24.212 4 56 7.2 6
7276 Jubilee Creek TIMB 5127 6.465 3 9 3.7 1
7236 Palm Tree Creek TIMB 532 41.392 4 53.3 6.8 5
7274 Mango Creek TIMB 5127 0.098 4 16 3.7 2
7275 Scrubby Creek TIMB 5127 4.991 4 21 3.7 2
7277 Hut Creek TIMB 5127 8.554 3 21 3.7 2
8314 Miclere Creek TIMB 98A 19.528 2 24.3 6.6 3
8223 Belyando River TIMB 552 103.121 4 18.3 3.7 3
1158 Yatton Creek TIMB 512 94.531 4 45.7 7.3 4
1349 Sheepskin Creek TIMB 512 127.734 4 28 7.3 4
2189 Connors River TIMB 512 139.031 4 79.6 3.7 9
1159 Two Mile Creek TIMB 512 99.176 4 18.4 7.3 2
1153 Clive Creek TIMB 512 62.359 4 42.65 7.3 5
8699 Spring Creek TIMB 512 91.955 4 19 7.3 2
1154 Stockyard Creek TIMB 512 72.475 3 45.7 7.3 5
1156 Grave Gully TIMB 512 82.023 4 24.69 7.3 3
7247 Parnells Gully TIMB 536 34.485 2 9 3.7 1
7269 Station Creek TIMB 5126 1.094 3 23 3.6 3
7203 Horse Creek TIMB 512 160.2 4 16.5 7.3 2
40 7209 Three Mile Creek TIMB 512 192.967 4 36.6 5.5 4
7210 Back Creek TIMB 512 195.442 4 36.56 6.7 4
7211 Stony Creek TIMB 512 208.14 4 24.7 6.7 3
7201 Plain Creek TIMB 512 150.39 2 15.2 7.3 2
7202 Main Range
Creek TIMB 512 157.663 2 17.1 7.3 2
7278 Prospect Creek TIMB 5127 12.327 4 32 3.7 3
7288 Mcnamaras
Gully TIMB 5342 4.037 4 18 3.7 3
7219 Alligator Creek TIMB 517 6.747 4 24.69 5.5 3
7221 Spring Creek TIMB 517 13.35 4 10.7 5.5 1
7286 Broken River TIMB 5324 5.338 4 32 3.7 3
7239 Sandy Creek TIMB 533 12.807 4 27.4 7.3 3
7284 Seven Mile
Creek TIMB 5323 8.11 4 27 3.7 4
7207 Funnel Creek TIMB 512 187.489 4 73.2 3.7 8
7241 Dows Creek TIMB 536 10.695 4 21.3 5.5 4
7248 Ossa Creek TIMB 536 36.505 2 15.2 3.7 2
7253 Cluney Creek TIMB 854 11.051 2 15 3.7 2
7242 Unnamed Creek TIMB 536 14.005 2 9.1 6.3 1
1160 Lotus Creek TIMB 512 119.455 2 45.75 3.7 5
[image:40.595.101.497.54.386.2]7272 Dents Gully TIMB 5126 19.722 2 9 3.7 1
41
Year 2001 Year 2003
Structur e ID Compo nent % in CS1 % in CS2 % in CS3 % in CS4 % in CS1 % in CS2 % in CS3 % in
CS4 1-1' 1-2' 1-3' 1-4' 2-2' 2-3' 2-4' 3-3' 3-4' 4-4'
7221 56T 83.3 5.6 11.1 0.0
100.
0 44.4 27.8 11.1 16.7 100 44. 44 27. 78 5.5 6 5.5 6 0.0 0 5.5 6 11. 11 0.0 0 0.0 0 0.0 0 100. 00
7209 56T 50.0 12.5 18.8 18.8
100.
0 68.8 12.5 18.8 0.0 100 68. 75 0.0 0 0.0 0 0.0 0 12. 50 6.2 5 0.0 0 6.2 5 6.2 5 0.0 0 100. 00
1158 56T 52.9 23.5 23.5 0.0
100.
0 41.2 5.9 35.3 17.6 100 29. 41 11. 76 5.8 8 11. 76 0.0 0 11. 76 5.8 8 17. 65 5.8 8 0.0 0 100. 00
1153 56T 60.0 10.0 20.0 10.0
100.
0 26.7 16.7 36.7 20.0 100 26. 67 10. 00 23. 33 10. 00 6.6 7 3.3 3 0.0 0 10. 00 3.3 3 6.6 7 100. 00
2189 56T 64.0 24.0 12.0 0.0
100.
0 52.0 0.0 16.0 32.0 100 52. 00 0.0 0 16. 00 8.0 0 0.0 0 0.0 0 12. 00 0.0 0 12. 00 0.0 0 100. 00
7242 56T 21.4 7.1 35.7 35.7
100.
0 21.4 7.1 21.4 50.0 100 14. 29 0.0 0 0.0 0 14. 29 7.1 4 0.0 0 0.0 0 21. 43 35. 71 7.1 4 100. 00
7385 56T 86.7 10.0 3.3 0.0
100.
0 56.7 23.3 10.0 10.0 100 56. 67 23. 33 6.6 7 0.0 0 0.0 0 3.3 3 6.6 7 0.0 0 3.3 3 0.0 0 100. 00
7241 56T 48.0 20.0 20.0 12.0
100.
0 48.0 24.0 20.0 8.0 100 48. 00 4.0 0 0.0 0 0.0 0 20. 00 0.0 0 0.0 0 20. 00 0.0 0 8.0 0 100. 00
7243 56T 81.3 6.3 6.3 6.3
100.
0 31.3 12.5 12.5 43.8 100 18. 75 6.2 5 12. 50 43. 75 6.2 5 0.0 0 0.0 0 0.0 0 12. 50 0.0 0 100. 00 0.00
Total 547.62 118.98 150.69 82.71 900.
00 390.38 129.80 181.75 198.06 900. 00 359 .0 83. 1 69. 9 93. 4 52. 6 30. 2 35. 7 75. 3 79. 0 21. 8 900. 0
P1-1 P1-2 P1-3 P1-4 P2-1 P2-2 P2-3 P2-4 P3-1 P3-2 P3-3 P3-4 P4-1 P4-2 P4-3 P4-4
0.7 0.2 0.1 0.2 0.0 0.4 0.3 0.3 0.0 0.0 0.5 0.5 0.0 0.0 0.0 1.0
[image:41.595.59.780.119.495.2]65.6 15.2 12.8 17.0 0.0 44.2 25.4 30.0 0.0 0.0 50.0 52.4 0.0 0.0 0.0 100.0
42
43
44
3.1.3 Phase 3 – Data Analysis
Microsoft excel will be used to enter the data recorded from the inspection reports where each component will be allocated into different tabs. Each component will be analyzed via 2, 3 and 5 year periods to highlight the deterioration over time. The movement of condition states is then indicative of the deterioration of that member over that time period. To ensure the input of the inspections are correct, the condition rating for each component is tracked individually from one inspection to the next. All members which are maintained or are replaced with another material are disregarded which will limit the amount of inspection reports available for all three time periods.
Once each members condition state has been tracked over the three periods, an analysis is made to calculate the probability of movement from one condition state to another (only deterioration has been reported as improvement of condition state is disregarded). The Markov Chain equation 1 (Ranjith, Sujeeva, Gravina, Vankatesan, 2013) is then used to depict the probability of movement of condition states for each movement (for example, CS 1 to 2). The probability from the Markov Chain is then subjected to graphical representation and the average taken to find the probability of movement for each year period.
=
. 1
Where is the number of transitions from state i to j within a given time period and is the total number of elements in state I before the transition.
45 The FTA will have a top element of the structures deterioration followed by a gate to the substructure and superstructure. Each element will then be linked to the required structures component with an average of deterioration. The FTA will be allocated into 3 periods of time which will depict the probability of movement (indirectly the deterioration) of each element. The FTA will follow the outlined model depicted in Figure 3.2
Figure 3.2 – Fault Tree Analysis model
3.1.4 Phase 4 – Implementation
The FTA will be constructed from the data gathered from inspection reports and results of meetings of appropriate personnel. This data will be traced from final fault through to the construction of the bridge (no failures). A deterioration path will follow the typical design of FTA with specific information being formed from data collected. This FTA will then be subjected to the excel model which will then generate the probability of movement.
46
Chapter 4
Results and Discussion
In this chapter the results of the data from inspection reports are represented and presented. The problems and issues detailed in chapter 1 are subjected to the methodology outlined in chapter 3. The fundamental objectives to collect the data from inspection reports were to ensure all members were timber throughout the 3 time periods indicated in the methodology and that the data was tracked correctly throughout its life (changes to condition states). The combination of both of these goals made the availability of data minimal and difficult to report on, however representative. These goals were accomplished and presented within this chapter to demonstrate the probability of condition state movement from a theory and practice.
47
4.1 - Findings
4.1.1 Inspection reports
The 10 inspection reports investigated depicted that deterioration of timber bridges were predominately rapid when subjected to natural weathering conditions (e.g. deck, whales, bracing), however the rate was slower when away from these elements (e.g. corbels, girders). The reports also indicate that workmanship of the installation impacted the condition state/deterioration of that member (highly evident in corbels from over sniping). Inspection reports were examined in conjunction to all 3 periods at the same time to ensure that the condition state movement could be tracked (Figure 3.1).
48
4.1.2 Excel Model
The excel model of the deterioration of timber bridges within the Mackay/Whitsunday district was a visual and mathematical representation of the inspection reports. Each excel model was subjected to the methodology in chapter 4 which depicts the average percent of movement of condition states. All three periods for each element has been investigated separately from the FTA to represent the probability of each component moving.
The results depicted in Appendix C represent the chance of moving from one condition state to another (e.g. 1 to 2) for each component. These results are individual tracking of inspection reports (condition states) to depict the probability of movement over set given periods of time (2, 3 and 5 years).
49
4.1.3 Deck
[image:49.595.99.498.295.461.2]The probability of movement of the deck on timber bridges is depicted in Figure 4.1 which demonstrates the likelihood of condition state change over the 3 time periods. The deck is depicted to have a higher chance of moving condition states with the more deteriorated of the member. The data available for decks were concentrated to represent the whole deck as a one member when the member became more deteriorated. It is also evident that the maintenance completed on these structures were completed before deterioration had passed condition state 3.
Figure 4.1 - Probability of Condition State Movement – Deck
4.1.4 Kerb
Depicted in Figure 4.2, the probability of condition state movement for kerb over the 3 time periods and the chance the kerb will change condition state. The kerb depicted in Figure 4.2, there is a higher chance of the member remaining in the same condition state over the 2, 3 and 5 year periods. The 5-year period illustrates that the probability of movement of condition states increase as the member deteriorates.
When isolating the kerb into condition state 2, the 2-year period depicts that minimal probability of change is present, whereas the 5-year period illustrates more of a probability of movement than remaining in the same state. This is indicative to the deterioration of members over a greater period of time.
0.00 0.50 1.00
P1-1 P1-2 P1-3 P2-2 P2-3 P2-4 P3-3 P3-4 P4-4
%
(
*
1
0
0
)
Movement of Condition State
Probability of Condition State Movement - Deck
50
Figure 4.2 – Probability of Condition State Movement – Kerb
4.1.5 Girder
The girder data collected from inspection reports and represented in Figure 4.3 is a good representation of the condition of girders due to the amount of data available and the maintenance performed. The 3 time periods illustrated in Figure 4.3 depicts that the probability of condition state movement is significate from CS 1 to 2, 2 to 3/4 and 3 to 4.
The 5-year period depicts that when the member is in a condition state of 1 or 2 that deterioration is minimal, however when the structure reaches CS 3 the girder has a high potential to deteriorate and move condition states. The 2 and 3 year periods are similar to the 5 year, however the probability is lower (65% and 61% respectively).
Figure 4.3 – Probability of Condition State Movement – Girders 0.00
0.50 1.00
P1-2 P1-3 P2-2 P2-3 P2-4 P3-3 P3-4 P4-4
%
(
*
1
0
0
)
Movement of Condition State
Probability of Condition State Movement - Kerb
2 Years 3 Years 5 Years
0.00 0.50 1.00
P1-2 P1-3 P2-2 P2-3 P2-4 P3-3 P3-4 P4-4
%
(
*
1
0
0
)
Movement of Condition State
Probability of Condition State Movement - Girders
[image:50.595.100.500.545.709.2]51
4.1.6 Corbels
[image:51.595.97.498.306.473.2]The probability of condition state movement is indicative to the time period illustrated in Figure 4.4. Depicted in Figure 4.4, the probability of deterioration over 2 years is seen to be small movements (1 to 2), however when deteriorated this probability becomes high. The 3-year period has minimal change to condition states, however has a higher chance of sever deterioration than 2 years. This is indicative to the probability of movement from CS 1-3 (40%). The deterioration from the 5-year time period is depicted to be the most sever in respect to the highest deterioration movement (CS 2 to 4 to be 63%). This data suggests that maintenance is minimal on girders within Mackay/Whitsundays district, however the time period can directly relate to the deterioration.
Figure 4.4 – Probability of Condition State Movement - Corbels 0.00
0.50 1.00
P1-2 P1-3 P2-2 P2-3 P2-4 P3-3 P3-4 P4-4
%
(
*
1
0
0
)
Movement of Condition State
Probability of Condition State Movement - Corbels
52
4.1.7 Piles
[image:52.595.99.498.296.460.2]Depicted in Figure 4.5, the probability of condition state movement changes depending on the time period. The deterioration represented in Figure 4.5 is indicative to the environment the pile is subjected to (e.g. marine deterioration) which would speed the decaying rate. This is indicative to the change of condition states having the highest probability at the 3-year time period (CS 2-3 at 79% and 2-4 at 71%). The change of condition for the 2 and 5 years are consistent with deterioration over time. It can be depicted that maintenance on piles would be best performed within the 2 and 3 year periods.
Figure 4.5 – Probability of Condition State Movement - Piles 0.00
0.50 1.00
P1-2 P1-3 P2-2 P2-3 P2-4 P3-3 P3-4 P4-4
%
(
*
1
0
0
)
Movement of Condition State
Probability of Condition State Movement - Piles
53
4.1.8 Headstocks
[image:53.595.100.498.295.460.2]The data available for headstocks within the Mackay/Whitsundays district is limited as indicated in Figure 4.6. The time period of 3 years all depicted that there was a 100% chance of headstock remaining in CS1 over 3 years, however the time period of 2 years illistrated that the chance of movement was high when the member was in CS 2. The 2 year period depicted that the probability of movement has a medium (35%) chance of moveing from CS1 to 4, however when the headstock is already in a a CS of 2 a 50% chance is present to move from CS 2 to 3.
Figure 4.6 – Probability of Condition State Movement - Headstock 0.00
0.50 1.00
P1-2 P1-3 P2-2 P2-3 P2-4 P3-3 P3-4 P4-4
%
(
*
1
0
0
)
Movement of Condition State
Probability of Condition State Movement - Headstock
54
4.1.9 Whales and Bracing
[image:54.595.99.499.341.505.2]The whales and bracing data collected from inspection reports are similar to the availablility of headstocks. It has been established that the data available for whales and brace is limitied due to the ease of replacement. It has been concluded that whales and bracing is a component which can be changed to another material simply and therefore is one of the first components to be replaced when maintenance is scheduled. Depicted in Figure 4.7, the chance of deterioration of whales and bracing is minimal, however in one case it was found to be significant (3 year CS 2 to 4 of 20%). This could be indicitive of the situation if the maintenance was not performed within the 3 year period.
Figure 4.7 – Probability of Condition State Movement – Whales and Bracing 0.00
0.50 1.00
P1-2 P1-3 P2-2 P2-3 P2-4 P3-3 P3-4 P4-4
%
(
*
1
0
0
)
Movement of Condition State
Probability of Condition State Movement - Whales
and Bracing
55
4.2 - Fault Tree Analysis
The Fault Tree Analysis is used to graphically model the probability of movement of condition states over the 3 different time periods. Depicted in Table 4.1 is the overview of the FTA for each condition state movement illustrated in Appendix D. The top element in the deterioration FTA depicts that the probability of each of these cases (e.g. 1-2, 1-3, 1-4) will happen over each time period. An example can be used for 2 years with a probability of failure (CS4) is 56%. The results in Table 4.1, depicts the probability of the whole member moving these condition states.
Fault Tree Analysis Probabilities
P1-1 P1-2 P1-3 P1-4 P2-2 P2-3 P2-4 P3-3 P3-4 P4-4
2 Years 0.96 0.93 0.57 0.56 0.95 0.88 0.76 0.77 0.98 1
3 Years 1 0.95 0.47 0.11 1 0.88 0.91 1 0.81 1
[image:55.595.98.497.293.467.2]5 Years 0.97 0.87 0.21 0.39 0.95 1 0.85 0.79 1 1
Table 4.1 - FTA Probabilities
56 Table 4.2 – FTA for 2 Years for CS movement 1-4
58
Chapter 5 Conclusion and Further
Recommendation
The data recorded from inspection reports were adequate to support a firm conclusion that deterioration is directly related to time. The probabilities found from the FTA were also consistent with the estimated outcomes, however the probability is higher than anticipated. The information presented throughout this dissertation can draw the following conclusions:
• Super and substructure deterioration are consistent with all both sections of the timber bridges deteriorating simultaneously.
• Preventative maintenance scheduling can be done with probabilities.
• Probability of movement of condition states is high for movement from lower states to higher states when the time period increases.
• Each member should be investigated individually to depict the probability deterioration.
59
5.1 - Future Recommendation
Recommendations for further research would be to investigate other districts to determine the extent the geography has on the different timber members. In addition, an investigation into the following could add more validity to this dissertation:
• The different deterioration causes and draw a probability connection of same • How the different timbers used throughout the state deteriorate at varying rates • Investigate the AADT relationship with deterioration of timber members • Research additional time periods (e.g. 8, 10, 14)
60
Chapter 6
References
Agrawal, AK & Kawaguchi, A 2009, Bridge element deterioration rates: final report, project C-01–51, New York State Department of Transportation, New York, NY, USA.
Ataei, N., Stearn, M. and Padjett, J.E. (2010), "Response Sensitivity for Probabilistic Damage Assessment of Coastal Bridges under Surge and Wave Loading", Transportation Research Record: Journal of the Transportation Research Board, Vol. 2202, pp. 93-101.
Austroads (2009), Austroads Guide to Bridge Technology-Part 7 Maintenance and Management of Existing Bridges, Austroads Publication, Sydney, Australia.
AUSTROADS, 1991, Bridge Management Practice, AP-13/91. pp 118, Austroads, Sydney, NSW.
AUSTROADS. 2004, Summary of Austroads Strategy for Improving Asset Management Practice, http://www.austroads.com.au/assetmgmtstrategy.php.
Becker, A, Toilliez, J, Mitchell, T, 2015, Considering Sea Level Change When Designing Marine Civil Works: Recommendations for Best Practices, Handbook of Coastal Disaster Mitigation for Engineers and Planners, Chapter 32.
Bootle, K.R. (1983), Wood in Australia. Types, properties and uses, McGraw-Hill Book Company.
Brites, R.D., Neves, L.C., Machado, J.S., Lourenco, P.B. and Sousa, H.S. (2013), "Reliability analysis of a timber truss system subjected to decay", Engineering structures, Vol. 46, pp. 184-92.
Bulusu, S, Shinha, K, 1997, Comparison of Methodologies to Predict Bridge Deterioration, Transport Research Board.
61 Committee, TM-006, T.P.A.D. 2003, Australian Standard® Timber – Natural durability ratings standards. Australian International Ltd, Sydney.
Davis-McDaniel, C., Chowdhury, M., Pang, W. and Dey, K. (2013), "Fault-Tree Model for Risk Assessment of Bridge Failure: Case Study for Segmental Box Girder Bridges", Journal of infrastructure systems, Vol. 19, pp. 326-34.
Department of Transport and Main Roads, Queensland, June 2004, Bridge Inspection Manual, Second Edition, Bridge Asset Management, Structures Division, Road System and Engineering.
Department of Transport and Main Roads, Queensland, February 2005, Timber Bridge Maintenance Manual, Bridge Asset Management, Structures Division, Road System and Engineering.
Ejechi, B.O. (2003), "Microbial deterioration of partially submerged service timbers in a tropical inter-tidal zone", International biodeterioration & biodegradation, Vol. 51, No. 2, pp. 115-8.
Enright, M.P. and Frangopol, D.M. (1998), "Probabilistic analysis of resistance degradation of reinforced concrete bridge beams under corrosion", Engineering structures, Vol. 20, No. 11, pp. 960-71.
Ericson, C.A. (2005), Hazard Analysis techniques for system safety, John Wiley & Sons. Ericson, C. A., II., 1999, Fault Tree Analysis – A History, System Safety at the Dawn of a new Millennium, System Safety Society, Orlando, FL.
62 FHWA (2011), Framework for improving resilience of bridge design, Publication No. FHWA-IF-11-016. U.S. Department of Transportation, Federal Highway Administration.
Flyvbjerg, B. (2006), "Five misunderstandings about case-study research", Qualitative Inquiry, Vol. 12, No. 2, pp. 219-45.
Giummarra, G.J., McInerney, R. & Styles, E.T. 2003, 'Risk Assessment For Road Networks and Bridges', IPWEA (Qld) 2003 State Conference, Mackay.
Johnson, P.A. (1999), "Fault tree analysis of bridge failure due to scour and channel instability", Journal of infrastructure systems, Vol. 5, No. 1, pp. 35-41.
Kleiner, Y, 2001, Scheduling inspection and renewal of large infrastructures assets, Journal of Infrastructure Systems, .7, pp. 136-143.
Kurz, J.H. and Boller, C. (2015), "Some background of monitoring and NDT also useful for timber structures", Journal of Civil Structural Health Monitoring, Vol. 5, pp. 99-106.
LeBeau, K. and Wadia-Fascetti, S. (2000), 'A fault tree model of bridge deterioration', in 8th ASCE Specialty Conference on Probabilistic Mechanics and Structural Reliability.
LeBeau, K. and Wadia-Fascetti, S. (2007), "Fault tree analysis of Schoharie Creek Bridge Collapse", Journal of Performance of Constructed Facilities, ASCE, Vol. 21, No. 4, pp. 320-6.
Liu, M. and Frangopol, D.M. (2005), "Time-dependent bridge network reliability: Novel approach", Journal of Structural Engineering, Vol. 131, No. 2, pp. 329-37.
63 Mackenzie, C, 2005, Timber service life design, Design guide for durability, Wood Solutions, design and build.
Madanat, S, Mishalani, R, and Ibrahim, W, 1995, Estimation of Infrastructure Transition Probabilities from Condition Rating Data, Journal of Infrastructure Systems, 1, 120-125.
MainRoads-Queensland (2004), Bridge Inspection Manual, Department of MainRaods, Queensland.
Mainroads (2014), Detailed Visual Bridge Inspection Guidelines for Timber Bridges, Main roads, Western Australia.
Main Roads. 1999, Engineering Policy Statement No. EP109 – Road Asset Maintenance Policy and Strategy, Main Roads.
Morocus, G, 2013, Life-Cycle Assessment of Nebraska Bridges, Nebraska Department of Roads (NDOR).
National Vocational Education and Training Content NVETC, 2014, Introduction to hazards and risks, http://nationalvetcontent.edu.au.
Radford, D.W., Van Goethem, D., Gutkowski, R.M. and Peterson, M.L. (2002), "Composite repair of timber structures", Construction and Building Materials, Elsevier, Vol. 16, pp. 417-25.
Ranjith, S. (2010), 'Tools for diagnosis and prediction of deterioration of timber bridges in Australia', Masters thesis, RMIT University, Melbourne.
64 Sangree, R.H. and Schafer, B.W. (2008), "Field experiments and numerical models for the condition assessment of historic timber bridges: Case study", Journal of Bridge Engineering, ASCE, Vol. 13, No. 6, pp. 595-601.
Setunge, S., Zhu, W., Gravina, R. and Gamage, N. (2015), "Fault-Tree-Based Integrated Approach of Assessing the Risk of Failure of Deteriorated Reinforced-Concrete Bridges", Journal of Performance of Constructed Facilities, pp. 04015058-1-12.
Shellshear, M, 2008b, ‘Urban stormwater treatment using chitosan’, ENG4111/4112 research project dissertation, Faculty of Engineering and Surveying, University of Southern Queensland, Toowoomba.
Ranjith, S, Sujeeva, S, Gravina, R and Vankatesan, S. (2013), Deterioration Prediction of Timber Bridge Elements Using the Markov Chain, Journal of Performance of Constructed Facilities, May/June ed.
Sianipar, P.R. and Adams, T.M. (1997), "Fault-tree model of bridge element deterioration due to interaction", Journal of infrastructure systems, Vol. 3, No. 3, pp. 103-10.
Sorensen, J.D. (2011), "Framework for robustness assessment of timber structures", Engineering structures, Vol. 33, pp. 3087-92.
Van de Kuilen, J.W.G. (2007), "Service life modelling of timber structures", Materials and Structures, Vol. 40, pp. 151-61.
VicRoads (2006), VicRoads Bridge Maintenance Repair and Strengthening Guidelines., Roads Corporation, Victoria Australia.
Wacker, J.P., Brashaw, B.K. and Jalinoos, F. (2015), 'A field Assessment of timber highway bridge durability in United States', in Structures Congress: USA.
65 Weena, L, Nirdosha, G, Sujeeva Setunge, (2006), “Fault tree analysis method for deterioration of timber bridges using an Australian case study”, Build Environment Project and Management, Vol. 6 Iss 3 pp. 332 – 344.
White, R. H.; Ross, R.J. (2014). ‘Wood and Timber Condition Assessment Manual’, 2nd edition. General Technical Rpt. FPL-GTR-234. Madison, WI: U.S. Department of Agriculture, Forest Service, Forest Products Laboratory.
Wilkinson, K., Thambiratnam, D.P. and Ferreira, L. (2005), 'Capacity of notched timber girders', in 9th International Conference on Inspection, Appraisal, Repairs and Maintenance of Structures: Fuzhou, China.
Wilson, P.J. 2004, Programme for Replacement of Timber Bridges, Wide Bay District, Bundaberg.
Yin, R.K. (2009), Case study research: Design and methods, Thousand Oaks, CA.
66
67
Appendix B – Risk Assessment
To ensure the safe efficient operation of the project, two perspectives are analyzed. The two methods include the NVETC (2014) matrix which will be subjected to each objective (depicted from Table 4.2) and potential risks which may alter the efficiency of the project. The matrix outlined in Table 4.2, depicts a likelihood of occurrence vs. consequence of that event occurring. Each activity (Table 4.2) will be subjected to this matrix to determine the personal risk involved (Table 4.3). Once the risk is depicted for each activity, control
measures can be implemented (if required).
Legend
Low Risk Medium Risk High Risk
Consequence
A Minor
First Aid or some
medical treatment
B Moderate
Increased
medical
attention
C Major
Severe health
outcome or
injury
D Extreme
Intensive
care or death
L
ik
e
lih
ood
of
O
cc
u
rr
e
n
c
e
1 Rare A1 B1 C1 D1
2
Unlikely A2 B2 C2 D2
3 Likely A3 B3 C3 D3
4 Almost
certain A4 B4 C4 D4
68
Task Hazard Risk Minimisation
1
Injury by slips, trips, falls when walking. Low Risk
Be aware of where walking and only walk on even ground. 2
If given in paper copy, be sure to use
correct carrying techniques. Low Risk
Use a correct bag to carry, don’t lift heavy objects.
3, 4, 5
Poor circulation from sitting long
periods. Muscle aching. Fatigued. Low Risk
Take regular breaks, stretch and take regular walks.
Appendix B 2 – Personal Risk Assessment for Each Activity
69
Task Hazard Risk Minimisation
1 Required TMR staff is on leave.
Low
Risk
Allow a minimum of 6 weeks to inform TMR. Informing stage already completed. Resources are not
readily available. Medium Risk
Ensure the correct procedures have been implemented to gain access to both inspection reports and Whichbridge software (BIS).
TMR system is unavailable.
Low
Risk
Ensure adequate time is allocated. Acquire training with BIS.
2 BIS system is unavailable or access has been denied.
High
Risk
Ensure phase 1 is implemented correctly and adequate time is allocated.
Whichbridge
software is
unavailable of access has been denied.
High
Risk
Ensure phase 1 is implemented correctly and adequate time is allocated.
3, 4 Excel is unavailable, input data is not accessib


![Irreducible Polynomials in Ζ[x] That Are Reducible Modulo All Primes](data:image/gif;base64,R0lGODlhAQABAIAAAP///wAAACH5BAEAAAAALAAAAAABAAEAAAICRAEAOw==)