A floor sensor system for gait recognition
Lee Middleton, Alex A. Buss, Alex I. Bazin, and Mark S. Nixon,
School of Electronics and Computer Science,
University of Southampton,
United Kingdom.
{ljm,aab102,aib02r,msn}@ecs.soton.ac.uk
Abstract
This paper describes the development of a prototype floor sensor as a gait recognition system. This could even-tually find deployment as a standalone system (eg. a bur-glar alarm system) or as part of a multimodal biometric system. The new sensor consists of 1536 individual sensors arranged in a 3 m by 0.5 m rectangular strip with an
indi-vidual sensor area of 3 cm2. The sensor floor operates at
a sample rate of 22 Hz. The sensor itself uses a simple de-sign inspired by computer keyboards and is made from low cost, off the shelf materials. Application of the sensor floor to a small database of 15 individuals was performed. Three features were extracted : stride length, stride cadence, and time on toe to time on heel ratio. Two of these measures have been used in video based gait recognition while the third is new to this analysis. These features proved suffi-cient to achieve an 80% recognition rate.
1. Introduction
The aim of biometrics is to measure information from people which can be used to classify them uniquely. To achieve this goal there are many disparate parts of the body that can be employed. These include face, finger-print, and iris[1]. However, these all require close proxim-ity measurement. Gait has been proposed as a biometric[10] which overcomes this closeness problem. Formally, gait is the pattern or action of an individuals motion on foot. In gait recognition the entire action of walking is used as the biometric[10] and features such as hip angle are extracted from this motion. A second point of uniqueness of gait is that it is a dynamic measure of an individual. Consequently, gait is potentially more robust to forgery. For instance, a faked walk instantly looks wrong. There is however extra complexity that comes with this dynamic nature. It is diffi-cult to isolate which features of the motion are important. In fact, there is ongoing work studying the potency of the
var-ious features contained within human gait[4, 2]. The aim of this work is to aid existing studies into gait analysis by the addition of a footfall sensing system. This is novel as it can allow us to measure gait accurately without the need for video analysis. Furthermore, it allows an opportunity to study gait in a way that cannot be performed with video alone.
The method for gait analysis we propose is similar in purpose to that of [3] who found a linear relationship be-tween stride length and stride cadence. However, in their work the information was extracted via video analysis.
The use of floor sensors for studying the way we walk is commonly employed by physiologists. Patholog-ical gait[7] is a key indicator of several age related dis-eases such as Diabetic Polyneuropathy. Reilly et. al.[11] built a system to measure gait based on magnetostric-tive delay lines. However, they noted that their design was difficult to fabricate and required specially modi-fied shoes with a high permeability. Several commercial companies, such as Tekscan (www.tekscan.com) make tom systems for medical practitioners. They employ cus-tom materials which are force or pressure sensitive. How-ever, these systems are cost prohibitive for large areas and are unable to be employed in our application. An addi-tional problem with the commercial solutions is that the custom software that controls the system limits the users in-teraction with the data.
instru-ments. Each tile was hexagonal with a diameter of 40 cm and contained 20 sensors. The ORL active floor [9] used a large 1.5 m×1.5 m plate which was balanced on a4×4 ar-ray load cells. Using a hidden Markov model they showed a degree of recognition of individuals. However, this project was primarily intended for tracking so recognition was not fully studied. As part of the smart house project at Geor-gia Tech, Orr et al.[12], built an identification system which measured the force profile of a single footstep rather than an entire gait sequence. Ten features were measured from the load profile and individuals were recognised by their posi-tion in this feature space. They successfully demonstrated recognition capability. Mori et al.[13] built a robotic room to allow it to interact with users. In this project sensors were placed every 20 cm in both directions on the reachable floor area. Recent work[5] on this floor has increased the resolu-tion to give64×64sensors in an area of 500mm2. However, the custom fabrication process that they employed makes it difficult to replicate their work. Murakita[14] produced a system for tracking individuals. They employed a basic sen-sor size of 18 cm square to tile a large environment roughly 40m2. Their capture rate of 5 Hz whilst enough for track-ing is insufficient for gait analysis.
In summary, there is a shortage of floor sensing systems which are designed with gait recognition in mind.. They have either insufficient resolution, too lower sample rates, or are too costly. Where these problems are overcome the systems are expensive, hard to fabricate, and inflexible. The proposed system overcomes these problems by prototyping a simple and cheap design for the sensor system. The rest of this paper covers the details of the design of the gait ac-quisition system (section 2). Analysis of the sensor data is carried out and features pertinent to gait are proposed (sec-tion 3.1). Finally, the system is evaluated for effectiveness on a small population (section 3.2).
2. Floor Sensor System
A number of constraints were placed upon the overall system design. The primary of these were that it should be low cost and scalable. However, additional constraints on the size of the environment and the sensor resolution were also imposed. The room in which the acquisition system will be placed has a constrained space in which the sens-ing floor can be placed. A domestic or office environment can accommodate a large number of sensors. However, due to time constraints a smaller floor was considered. A width of 0.5 m was chosen from empirical evaluation of the re-quired width for a person to walk in a straight line comfort-ably. The length was decided from studies of average stride lengths. Perry[7] puts the upper limit for a single stride at approximately 1.5 m so in order to capture 2 complete gait cycles for most people a 3 m length of track would be
[image:2.612.320.551.71.176.2]suf-(a) (b)
Figure 1. The effect of sensor resolution on foot profile (a) low resolution (b) high resolu-tion
ficient. As well as the physical dimensions of the track the sensor density is also a system constraint. For a typical foot (roughly24 cm×9 cm) the effect of different sensor densi-ties (5 cm2and 1 cm2) is illustrated in figure 1. The foot is well represented by the high density sensor array but not so well represented by the low density one. Empirically it was discovered that a sensor size of 3 cm2was sufficient to de-tect gait. This fixed size lead to an array of 96 by 16 sensors to cover the mat area. A foot is in contact with the ground for 60% of a 1 s gait cycle. During this time there are 4 ma-jor articulations of the foot giving a minimum sample fre-quency of 7 Hz. In this work 22 Hz was chosen as it is sev-eral times larger than the minimum frequency.
2.1. Type of sensors
Fundamental to the system is the choice of sensor. Ini-tial study lead to 3 distinctly different designs. These were 1) capacitive, 2) the use of coax cable as a delay line, and 3) resistive. Each of these were prototyped before a final deci-sion was made.
Capacitors can be utilised as pressure sensors. To do this capacitors were made with an elastic core such that the application of pressure would result in deformation of the core, decrease in plate separation, and an increase in capac-itance. These were manufactured using only household foil with cling-film as a dielectric. While capacitance increased smoothly and reliably with increased weight, experiments showed that using this method on a large scale would be practically impossible. The charge on the small capacitors leaked when connected to an amplifier or to any basic sys-tem that might be used to extract their value. Thus, a mat of 16 by 96 sensors would require 3072 wires and 1536 ca-pacitors with corresponding extraction circuits which is far from practical.
similar to a short circuit. A pulse transmitted down the cable will be reflected back from the point where pressure is plied. The size of this pulse is proportional to the force ap-plied to the cable. This approach was discarded due to the complexity of the electronics required to condition the sig-nal and detect the result.
The final approach was analogous to a computer key-board. In this design a simple binary switch is made by sep-arating a pair of wires by a deformable material such as foam. When force is applied to the construction the wires come into contact and the switch is closed. A large array of these switches can also be fabricated easily by creating a grid of wires - a pair for each required sensor. Thus the re-quired specification could be met by just 16 vertical and 96 horizontal wires. This design shows the simplicity and scal-ability required for the final acquisition system.
2.2. Design of the sensor mat
A schematic of a simple resistive sensor mat is shown in figure 2. In operation a voltage is scanned down each of the rows as illustrated by the switches on the left. When a volt-age is applied to a particular row, it is read off each of the columns in turn. If the resistor is connected (as shown by a gray circle in the image) then the voltage will be roughly the same as the voltage applied to the column. This design is simple but suffers from an affect known as ghosting. In ghosting a triangle of three points when pressed simulta-neously will also illicit an erroneous fourth point, shown in figure 2 by the unfilled circles. This is because the cur-rent can flow multiple ways to ground. In keyboard manu-facture they circumvent this problem by placing diodes at each switch to stop current flowing backwards. However, this is not possible for our application as it makes it much more difficult to build. Applying the assumption that peo-ple’s foot steps do not overlap along the line of their for-ward motion (which is almost always the case), and mak-ing the grid large enough so that one foot alone cannot con-nect three triangular points on the grid, then there will be no ghosting. The size of grid this requires depends on foot size, but is around 12 cm. However, as the sensor resolu-tion is too low this method is in inadequate.
[image:3.612.315.555.68.379.2]Instead of having a single grid for the entire mat, multi-ple electrically isolated grids could utilise the same space as a single grid. This way the ghosting could be eliminated by having a wide separation between connected points. This idea is illustrated in figure 3. Notice that to stop multiple grids interconnecting there is only a requirement that sulation is placed along diagonal lines. This solution in-creases the spatial resolution whilst simultaneously reduc-ing the ghostreduc-ing problem. A second way to increase the spa-tial resolution was to layer offset versions of the mat on top of each other. By offsetting the grids of a second layer so
Figure 2. The workings of a simple resistive mat.
Figure 3. Avoiding ghosting via 4 distinct grids.
that they lie in the centre points of the grid above them a higher resolution system was achieved. This design leads to the grids being aligned at 45◦degrees to the original hori-zontal and vertical wires. The final design incorporated both 4 isolated grids and 2 layers.
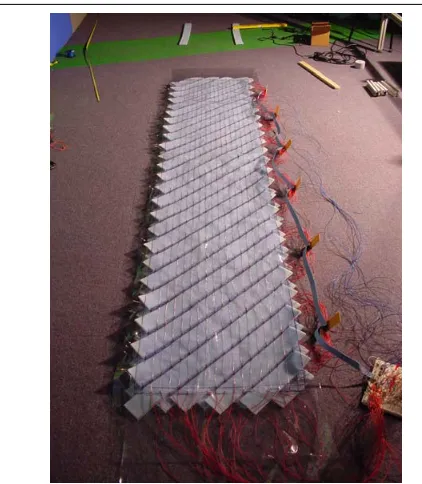
In the final prototype mat 2 plastic sheets were em-ployed. On the top one the wires were weaved vertically and the bottom one the wires were weaved horizontally. Sand-wiched between them were diagonal layers of foam rub-ber. The resulting prototype is shown in figure 4. The con-struction method is simple and cheap. The components that make up the mat cost less than $100. Larger mats can eas-ily be fabricated using this method.
2.3. Hardware interface
Figure 4. The final prototype sensor mat illus-trating 4 grids (to avoid ghosting) and 2 lay-ers (to increase resolution).
(a)
(b)
Figure 5. Typical gait cycle over the sensor mat (a) foot steps (b) time spent at each loca-tion
3. Results
In order to evaluate the performance of our system we collected sequences from volunteers in our labora-tory. Overall, 15 subjects were studied with 5 females and 10 males. Each person walked over the mat 12 times and in each case 2 complete gait cycles (4 foot falls) were cap-tured. The subjects walked without their footwear, in stock-ened feet, so as to remove the influence of footwear in the experiment.
0 2 4 6 8 10 12 14 16
0 10 20 30 40 50 60 70 80 90 100
f(x)
x
’footfalls’ ’footfalls’
Figure 6. The profile of the 4 footsteps on the sensor mat
3.1. Analysis of sensor data
The captured data is stored as a series of snapshots which indicates the status of all the sensors at a given time instant. They can be considered similarly to an image at a particu-lar time, viz:
In(x, y) =
1 if switch closed
0 otherwise
Where,nis the time instant or frame number which is less thanN the total number of frames.(x, y)are the image co-ordinates ranging from 0 to 15 forxand 0 to 95 fory. Con-sidering the set ofNframes some simple processing can be performed on the image data. For instance an aggregate im-age can be defined to be :
A(x, y) =
N−1
X
n=0
In(x, y)
The resulting aggregate image can be thresholded to give the position of the footsteps as shown in figure 5(a) or shaded to give the dynamic motion of the foot as illus-trated in figure 5(b) (brighter indicates the foot lingers at this switch longer). By summing acrossAa footstep pro-file can be found (see figure 6) :
f(x) =
95
X
y=0
A(x, y)
[image:4.612.61.272.73.315.2]the sole of the foot. In this way the profile we obtain is re-lated to the force applied by the subject as they walk.
Examination of figure 6 shows that the heel strikes (the first part of the gait cycle) occur ath = {10,32,54,77}. The heel strikes can be used to give the stride length. From the heel strikes the stride length can be computed as :
LS = (hi+1−hi)s
sis the sensor spacing or 3 cm. This gives a stride length, in the first case, of 0.67 m. Using the time at which each of the heel strikes are first performed can give a measure of the single step period,TS. The final feature that was employed
is the ratio of time that an individual spends on their toe heel compared to their toe,RHT. The toe locations can be
found similarly to the heel locations. The value of the pro-file at the heel and toe is a measure of how long was spent at this location. So given a heel location ofh0and a toe lo-cation oft0the ratio is :
RHT =
f(h0)
f(t0)
For most peopleRHT is between 1 and 1.5. It is an
indi-rect measure of the distribution of mass in the body when an individual walks. For instance, a woman on high heels walks with their weight considerably more forward than when wearing normal shoes. This would be seen as a higher value ofRHT.
3.2. Analysis of subjects
Analysis of the collected subject data was performed us-ingLS,TS, andRHT as discussed in section 3.1. A feature
vector can be formed:
g= (LS, TS, RHT)
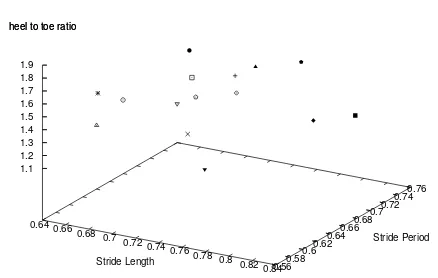
Whereg ∈ R3. As a consequence it is simple to plot the feature vectors according to each subject in 3D space. As an illustration figure 7 shows the mean feature vector for each individual. This was taken across all 12 trials. Notice that the subjects are clearly separated in space.
Using a standard distance metric the similarity,Sij, of
subjects i andj can be found. For instance employing a Euclidean distance, denoted byk.k, the similarity between subjectg1andg2is :
S12=kg1−g2k
Applying the similarity measure to the means of all the ex-perimental population a confusion matrix can be created. This is illustrated in figure 8. The image shows all of the individuals along the x and y axes. The similarity between them is shown by the colour of the square. In the figure, sim-ilarity is reflected by darkness; lighter areas mean subjects
0.64 0.66 0.68 0.7 0.72 0.74
0.76 0.78
0.8 0.82 0.84 0.56 0.58 0.6 0.62
0.64 0.66 0.68 0.7
0.72 0.74 0.76 1.1
1.2 1.3 1.4 1.5 1.6 1.7 1.8 1.9 heel to toe ratio
Stride Length
[image:5.612.330.549.102.241.2]Stride Period heel to toe ratio
[image:5.612.318.542.290.519.2]Figure 7. The mean feature vector for each of the 15 individuals.
Figure 8. Confusion matrix for the database.
are more different. Examination of the matrix shows that in 12 of the 15 subjects the best match is the subject them-selves. In the 3 cases where this was not the case the indi-viduals were found to walk with a bias towards their toes. This implies that the way in which the heel to toe ratio is measured needs to be re-examined.
3.3. Discussion
stud-ied in the literature and shown to provide reasonable dis-criminatory power. The third feature to our knowledge has never been explored perhaps because no-one has been able to detect it before. However, the heel to toe ratio is a good measure of identity. In 60% of the subjects this measure alone was sufficient to recognise their identity. This makes a case that the dynamic behaviour of the foot is a potent biometric in itself and further research is required. Using the three features as a feature vector gave good results with 80% of the individuals recognised. However, as previously acknowledged further evaluation of the features is needed.
4. Conclusion
In this paper a prototype system for acquisition of foot-fall data has been presented. The system has been designed to help study the gait by applying an alternate modality. The system consists of three main components : a large sensor mat, hardware interfacing, and analysis software.
The design of the mat is simple employing a switch made of perpendicular wires held apart by foam, which contact when force is applied. Due to the large array of wires that make up the mat it is possible to suffer ghosting where sen-sors are erroneously activated. This problem was solved by using four isolated grids and 2 layers of sensors. The sen-sor mat presented in this paper was approximately 3 m by 0.5 m and had a sensor size of 3 cm2. The employed sam-ple rate was 22 Hz. Control was achieved via 3 PIC micro-controllers and a USB driver chip. Overall, the construction materials are cheap and readily available.
From the sensor data information about the stride lengths, gait period, and heel toe ratio was extracted. This information was used as a feature vector in a sim-ple recognition system. The entire system was evaluated on a small database of 15 subjects and shown to per-form with a 80% success rate. The work introduced a new measure of gait - the heel to toe ratio. This feature empha-sizes the dynamic nature of gait and in isolation performs with a recognition rate of 60%.
Overall, the sensor system is a promising prototype. Fu-ture efforts may concentrate on how to increase the sen-sor resolution whilst keeping the cost down and the con-struction process simple. Furthermore, fusion with existing video extracted gait information is an interesting area to in-vestigate.
5. Acknowledgments
The authors gratefully acknowledge support by the De-fence Technology Centre 8-10 supported by General Dy-namics, UK.
References
[1] A. K. Jain, R. Bolle, and S. Pankanti, editors. Biometrics:
Personal Identification in Networked Society. Kluwer
Aca-demic Publishing (Dortrecht Nederlands), 1999.
[2] A. Veeraraghavan, R. Chellappa, and A. Roy Chowdhury. Role of shape and kinematics in human movement analysis. In Proceedings IEEE Computer Vision and Pattern
Recogni-tion, July 2004.
[3] C. BenAbdelkader, R. Cutler, and L. Davis. Stride and ca-dence as a biometric in automatic person identification and verification. In Proceedings of IEEE Face and Gesture
Recognition, pages 372–377, 2002.
[4] G. Veres, J. N Carter, and M. S. Nixon. What image in-formation is important in silhouette-based gait recognition. In Proceedings IEEE Computer Vision and Pattern
Recogni-tion, July 2004.
[5] H. Morishita, R. Fukui, and T. Sato. High resolution pres-sure sensor distributed floor for future human-robot symbio-sis environments. In IEEE/RSJ International Conference on
Intelligent Robots and Systems, volume 2, pages 1246– 1251,
2002.
[6] J. Paradiso, C. Abler, K. Hsiao, and M. Reynolds. The magic carpet: Physical sensing for immersive environments, 1997. [7] J. Perry. Gait analysis : Normal and pathalogical function.
SLACK incorporated, 1992.
[8] L. McElligott, M. Dillon, K. Leydon, B. Richardson, M. Fernstr¨om, and J. Paradiso. ForSe FIElds - Force sensors for interactive environments. In Proceedings of Ubicomp, 2002.
[9] M. D. Addlesee, A. Jones, F. Livesey, and F. Samaria. The ORL active floor. IEEE Personal Communications, 4(5):35– 41, 1997.
[10] M. S. Nixon and J. N. Carter. Advances in automatic gait recognition. In IEEE Face and Gesture Analysis, pages 139– 144, 2004.
[11] R. E. Reilly, M. R. Amirinia, and R. W. Soames. A two-dimensional imaging walkway for gait analysis. In
Pro-ceedings of the Fourth Annual IEEE Symposium Computer-Based Medical Systems, pages 145–152, 1991.
[12] R. J. Orr and G. D. Abowd. The smart floor: A mechanism for natural user identification and tracking. In Proceedings
of the Conference on Human Factors in Computing Systems,
2000.
[13] T. Mori, T. Sato, K. Asaki, Y. Yoshimoto, and Y. Kishimoto. One-room-type sensing system for recognition and accumu-lation of human behavior. In Proceedings IEEE/RSJ
Inter-national Conference on Intelligent Robots and Systems,
vol-ume 1, pages 344–350, 2000.
[14] T. Murakita, T. Ikeda, and H. Ishiguro. Human tracking us-ing floor sensors based on the markov monte carlo method. In Proceedings of 17th International Conference on Pattern