Network Performance and Quality of Experience
of Remote Access Laboratories
1
Alexander A. Kist and Andrew D. Maxwell
University of Southern Queensland, Toowoomba, Australia
Abstract—Remote Access Laboratories (RAL) have become important learning and teaching tools. This paper presents a performance study that targets a specific remote access architecture implemented within a universities operational environment. This particular RAL system provides globally authenticated and arbitrated remote access to virtualized computers as well as computer controlled hardware ex-periments. This paper presents system performance results that have been obtained utilizing both a set of automated and human subject tests. Principle objectives of the study were: To gain a better understanding of the nature of network traffic caused by experimental activity usage; to obtain an indication of user expectations of activity per-formance; and to develop a measure to predict Quality of Experience, based on easily measurable Quality of Service parameters. The study emulates network layer variation of access-bandwidth and round-trip-time of typical usage scenarios and contrasts against user perception results that allow classifying expected user performance. It demon-strates that failure rate is excellent measure of usability, and that round-trip-time predominantly affects user experience. Thin-client and remote desktop architectures are popular to separate the location of users and the actual data processing and use similar structures, hence results of this study to be applied in these application areas as well.
Index Terms—remote access laboratory; performance evaluation; quality of experience.
I. INTRODUCTION
Many modern learning tools rely on computing infra-structure and the Internet. A Remote Access Laboratory (RAL) environment that has been developed at the Uni-versity of Southern Queensland [1] motivates the work presented in this paper. As this university is a strong distance education provider, approximately 80% of the students are located off-campus, both domestically and internationally. In order to establish equivalent practical learning experiences similar to those of their on-campus peers, the RAL project was devised and implemented. The principal aim of this initiative was to provide remote Internet access to video supported laboratory based experimental activities. This permits all students, irrespec-tive of study mode, to undertake contextual action-oriented learning, of particular importance at this institu-tion as laboratory activities and practical exercises form an integral part of programs in many disciplines and are necessary for wider program accreditation.
RAL enables authenticated and mediated access to computer connected experimental activities. This system is accessible via the Internet. Two broad types of experi-mental activities can be hosted: software experiments and
hardware experiments. Software experiments are hosted on virtual machines in the local data centre, whilst hard-ware experiments are implemented as computer controlled rigs stored within the corporate network footprint. Access is provided by remote desktop control. Two main compo-nents makeup the RAL system: a remote desktop applica-tion, and a management and booking subsystem facilitat-ing experiments access. Additionally, the system also integrates with the Learning Management System (LMS). In terms of technical performance, and focus of this paper, only the remote desktop component is important.
More broadly, an increasing number of other scenarios exist where applications that use remote desktop access are relevant. This includes thin-client solutions. Essen-tially both use the same technology. User inputs such as key strokes and mouse moves are transmitted to a remote server, with display information then returned to the local device. Program code of applications and the operating system are executed only on the remote server. Either a software client on a personal computer or a thin-client, a low cost computer that mainly provides a display and handles user inputs, are typically used as clients. A num-ber of alternative desktop/application access options are widely in use. These include Citrix Presentation Server [2], Windows Remote Desktop Protocol (RDP) [3] and Virtual Network Computing (VNC) [4].
Network parameters, such as available data rate and Round Trip Time (RTT) have a major impact on the usability of these access systems. This is particularly relevant if these systems are used to provide off-site access. The bottleneck of the connection will be generally in the network located off-campus. The focus of this study is therefore how the performance or delivered quality of the RAL system is impacted conditions of the Wide Area Network (WAN). Quality of Experience (QoE) is dis-cussed in technical literature as a parameter that captures user expectations of a system. Despite a growing interest in the implications of this property there is no universal definition of QoE available.
The aim of this study is threefold: to gain a better un-derstanding of traffic conditions imposed by particular remote experimental activities; to develop a methodology allowing the performance evaluation of Internet access required for acceptable RAL experiment experience; and to obtain an understanding and indication of expected user performance for successful activity usage. Through this, the intention is to measure basic network parameters and subsequently be able to predict the usability of an experi-ment. This information then allows determining what Internet access options are required (e.g. access band-width) and what geographic locations can be supported (latency). The paper presents traffic profiles and initial usability results suggesting followup measurements and analysis.
The remainder of this paper is organised as follows: Section II discusses related work, Section III introduces the test environment and Section IV describes the meth-odology that has been used for measurements. Section V summarises the results of this study and Section VI concludes this work.
II. RELATED WORK
One of the key applications of remote desktop architec-tures is to provide remote access to office type applica-tions. This includes thin-client based applications as well as off-site desktop access. There have been a number of studies that have analysed the performance of thin clients. A performance study of Windows-based thin-client architectures is presented by [6]. The study reports that QoE for Microsoft Office applications using Citrix and RDP is comparable under normal network conditions. For applications with increased RTT and packet loss, RDP outperforms Citrix.
Tolia et al. [7] investigates interactive user experience on thin clients and reports that “thin-client computing is highly variable and depends on both the application and available network quality.” The study used both meas-urements and simulations and stresses that latency is the key limiting factor and not bandwidth. Lai and Nieh [8] evaluate in a comprehensive study thin-client performance over WAN networks and specifically Internet2. The study reports major differences in performance between various platforms. It also identifies latency as a key performance factor. Yang et al. [9] ad- dresses user perceived perform-ance in benchmarking for thin- client platforms. The study uses “slow-motion benchmarking” that correlates network traffic and user actions to predict performance of thin-client platforms. This study focuses on the performance and QoE of SGD in response to changing network condi-tions.
Quality of Experience has increasingly become a focus of networking and computer research. Technical disci-plines generally relate QoE to measures of to the Mean Opinion Scores (MOS) [10] of a user population. Such measures have been widely used in telephony systems. Other disciplines generally include personal factors as well. Quality of experience becomes a more inclusive term and goes well beyond the perception of the experi-ence of a particular service. In psychology, for example, quality of experience includes the effect of motivation on achievement related emotions, satisfaction and attitudes [11].
Both standardisation bodies such as the ITU-T [12] as the research community have proposed diverse definitions for QoE. In this research project “QoE is a measure of user performance based on objective and subjective psychological measures using a service or product to achieve a particular task or objective.” as proposed by [5]; an extension of the definition by Brooks & Hestnes [13, p. 12]. In the context of Internet applications, QoE has been discussed by a number of researchers. Kuipers et al. [14], for example, discusses ways to measure QoE. Martinez-Yelm et al. [15] consider “How QoE can be measured and how the district layer in a networking environment can influence (...) perceived QoE.”
Both research community and industry are working on ways to qualify and quantify mapping between Quality of Service and Quality of Experience. One dimensional examples include [16] that propose an exponential rela-tionship between QoS and QoE; and [17] that shows that experience and satisfaction follow logarithmic laws. A number of authors also propose multi-facet QoE con-structs such as [18] or [13] that take multiple factors into account. Most research does not explicitly account for the relationship between QoE and the task that is performed, i.e. experience relates to tasks; tasks involves one or more applications; and the applications rely on network connec-tivity to operate.
The framework introduced in [5] proposed a number of specific performance parameters such as objective Quality of Application (oQoA), i.e. application performance; and objective Quality of Use (oQoU), i.e. fitness for a purpose, to overcome the limitations of a general QoE definition in evaluating the usability of an application or service in an online environment. This paper focuses on two aspects, the subjective Quality of Application, i.e. the Mean Opinion Score; and the objective Quality of Use, i.e. is an experiment fit for purpose. In the context of this work fit for purpose is defined as the ability to successfully under-take and complete an online activity with specific tasks and outcomes.
This is particularly relevant in the context of teaching systems as QoE becomes Quality of Learning Experience [19]. There is a distinct difference between attempting to successfully complete a task and undertaking a learning ac- tivity. The extensive literature on online learning suggests that many other factors such pedagogy and learning tool design have a significant impact on learning in online environments [20].
Sambrook’s [21] study, for example, shows that user- friendliness, presentation, structure of tasks and navigation within tasks can affect the quality of online learning tools. Basic strategies such as a clear set of instructional goals, the perceived relevance of tasks in relation to these goals and the resultant motivation and cognitive processes of learners, are fundamental to how learners behave and perform in any learning environment [22], [23].
The authors suggest that network related technical per-formance of learning systems is not relevant as long as the service is satisfactory and traditional learning design factors are dominant. However, as soon as there are disruptions, they become a concern.
Another aspect is that learning tools might not be per-ceived as such [26] and this impacts on performance expectations. It is also important to note that the nature of these relationships is service (learning tool) and task specific. In this context, the performance study introduced in this paper only marks an initial millstone in an attempt to understand the QoLE of RAL learning activities.
III. TEST ENVIRONMENT
For system design and evaluation, it is important to be able to emulate the experience of off-site external stu-dents. Tests undertaken as part of this study use the active system and the active campus network. Figure 1 depicts an overview of the environment. Users, depicted on the right, access software and hardware experiments; depicted on the left. In-between, from the right to the left, the RAL system, campus network and WAN emulator are depicted. The two branches in the dashed boxes indicate the test environment and live user access.
1) Desktop Test System: Testers use standard issue Dell Optiplex Desktops, with 4GB memory, running Windows XP, service pack 2. Firefox 3 is used as a web browser. Clients connect via 100Mbit Ethernet to the WAN Emula-tor. Test scripts that emulate various user workflows are executed on these systems.
2) WAN Emulator: The WAN emulator implemented in an embedded Linux system with multiple Ethernet inter-faces. It features a VIA Nehemiah processor, 1GB mem-ory and runs Gentoo Linux, kernel 2.6.32. NetEm [27] is used to emulate network the various network conditions including different delays and bandwidth limitations. It is part of the Linux kernel traffic control facility and allows emulating delay and packet loss. All transit traffic is captured during a test using tcpdump. Wireshark is used for high level traffic trace analysis. Traffic management at line speed is supported by this unit, CPU utilisation remained well below 5% during tests. The emulator is placed in-between the user workstation and the corporate network. Testers can configure network conditions with a simple web interface. Survey data to record the subjective experience of the test subjects is also collected via the web interface.
3) Campus Network: The RAL system is hosted in a data centre; client and WAN emulator are located in an office. No dedicated link between WAN Emulator and RAL System exists. Instead the campus network, the cloud in Figure 1, provides connectivity. This is not seen as a major impairment for this study; as the key focus is performance and user experience on WAN networks and the Internet. Parameters that influence performance, such as Round Trip Time (RTT) and throughput are at least a magnitude better in the local network. RTTs on campus, for example, are typically below 1ms. From most loca-tions that are not connected to the Australia’s Academic and Research Network, RTT are at least 30ms.
[image:3.595.309.538.74.186.2]A similar situation applies to throughput. On campus, bandwidth is at least 100Mbit/s, most households have practical access speeds of well below 10Mbit/s.
Figure 1. RAL Test Environment showing the server infrastructure, and the WAN emulator.
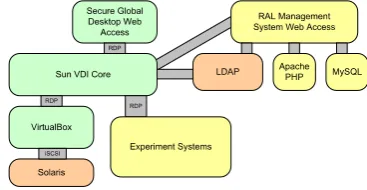
Figure 2. Technical RAL System Architecture showing the core components and system relationships.
4) RAL System: The RAL architecture consists of two key components: the management system, implemented in php/mysql, hosted on an apache web server and Oracle’s (previously Sun’s) Virtual Desktop Infrastructure 3.1 (VDI). Figure 2 depicts a top level system diagram of the current setup.
VDI itself is made up of four layers. On the he Desktop Access Layer a web browser uses Sun Secure Global Desktop (SGD) Software to initiate a virtual desktop session. The Session Management layer, the central component of this architect, uses RDP redirection to establish a connection to a virtual or real system via RDP. Both layers are hosted on a Sun Fire X4100 with 4Gb memory, Solaris 10, VDI 3.1, SGD 4.5, OpenDS 2.2.0.
The virtualisation layer creates, stores and manages Virtual Machines (VM) and is hosted on a Dell Power-edge 2950 with 32Gb memory, Solaris 10 and VirtualBox 3.05. The storage layer provides storage via iSCSI, hosted on a Sun X4100, 16Gb memory, 300Gb disk, Solaris 10. The RAL system is not a dedicated test setup, but the current system also used with live students and classes. This is largely due to complexity of the system and limited resources to duplicate the configuration for this study.
[image:3.595.328.512.233.328.2]This section introduces the test and evaluation method-ology used in this study. The tests target three areas: objective scripted episodes, test by individuals to establish whether an application is fit for a purpose; and a question-naire to evaluate the user perception of the service.
To produce objective performance results, a number of tasks are scripted. Under Windows, the AutoHotkey tool
key strokes and mouse moves for all tests. This open source tool can be used to check for changes to the dis-play, either by checking individual pixels or match screen images. The script performs a task and then waits for the screen to change. Using this technique, runtimes can easily be measured. Tests and scripts are specific to experiments being trialed.
For the Linux experiment, discussed in Section III-5, the following tasks are executed: open a terminal, delete the old script file, open a text editor, type an 8 line script, save the file, close the text editor, make the file executa-ble, open a web browser to display a webcam (640x480 pixels, 1 fps, MJPG) which points to the web controlled relay, run the script and verify that an LED turns on and off. These activities represent typical actions that have to be executed to drive the experiment. The same sequence was used for scripted (automated) tests as well as tests with individuals.
To make the test environment more accessible to the test subject, network parameters are related to practical access options and locations. The following locations and associated RTT were selected as typical locations for potential system users:
Local – Toowoomba (<1 ms) Melbourne (50ms)
Perth/New Zealand (100ms) Singapore/USA (200ms) Europe/Dubai (300ms) other locations.
These are only indicative values; in practice, RTT largely depends on routes packets take to their destination and routes depends on Internet Service Providers (ISP) and peering arrangements. In a related research project, network performance at various student locations will be sampled. For these initial investigations a low delay variation of 2% jitter has been imposed on the RTTs, further tests will evaluate the impact of jitter in more detail.
Broadband access options in Australia vary greatly and depend on the type of access and location, i.e. generally ADSL or wireless broadband access in metro areas, wireless broadband in fringe and rural areas and satellite access in some fringe and rural as well as remote areas. Bandwidth changes with evolving technology (e.g. ADSL, ADSL2+) and it is expected that the Australian National Broadband Network initiative will have a major impact on access bandwidth in the near future [28].
Whereas bandwidth is an important factor for many services and applications, in the context of RAL and remote desktop access, it defines a threshold rather than a parameter that has a variable impact on performance, i.e. either the bandwidth is sufficient or not. Additional bandwidth does generally not improve the performance. It is therefore enough to provide the amount of bandwidth
that is required to undertake a particular activity from a QoE perspective.
To evaluate the impact of limitations of diverse Internet access options, tests have to be performed. This study focuses on two aspects, subjective Quality of Application (QoA), i.e. the user perception of an activity; and the objective Quality of Use (QoU), i.e. if the activity is fit for a purpose. The latter will be evaluated by tests with individuals as well as automated tests. For this particular application, subjective QoA tests do not allow conclusions about usability as demonstrated in [5].
Tests with humans are a valuable, but more difficult to arrange than automated tests. However, these are neces-sary to provide a perspective for automated test and to develop a relationship between QoS and QoE in the context of remote laboratories. Testers performed the same tasks as for the automated tests and their completion their task completion time was recorded. They were also asked to rank their experience and their subjective impres-sions were recorded by a questionnaire after each test.
IV. TEST RESULTS
This section discusses measurement results in detail. The analysis focuses on upstream and downstream RDP traffic. As SGD uses https access all transmitted traffic is encrypted. Two aspects are evaluated: bandwidth usage and QoE performance measures.
A. Bandwidth Useage
The purpose of the bandwidth measurements is to put the performance results into perspective and highlight the traffic that is caused by undertaking the experiment. The focus is bandwidth and traffic that can be observed if no throttling is in place. For all tests described in this subsec-tion, WAN emulator features are disabled, i.e. local area network performance is measured.
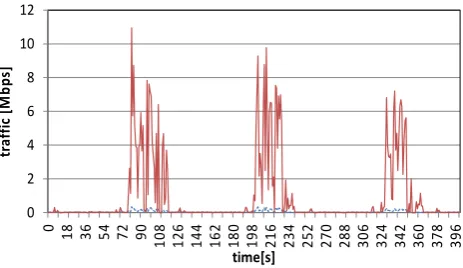
Figure 3 depicts three consecutive runs of the scripting test. Each test takes approximately 100 seconds. The graph shows measurements for one second intervals.
Upstream traffic encodes key strokes and mouse moves, downstream traffic consists of screen updates. The aver-age rate fluctuates around 10kbps for a ten second moving average downstream for the script typing and related screen updates. For major screen updates, such as opening a shell, the 10 second average rate is around 50kbps. Once the MPJEG stream is active, the 10 second moving average rate rises to approximately 5000kbps.
0 2 4 6 8 10 12
0 18 36 54 72 90
108 126 144 162 180 198 216 234 252 270 288 306 324 342 360 378 396
tr
affi
c
[M
b
p
s]
[image:4.595.307.539.592.726.2]time[s]
Figure 3. Traffic bandwidth during automated shell scripting tests. Shown are three replicate tests indicating traffic upstream (dashed) and
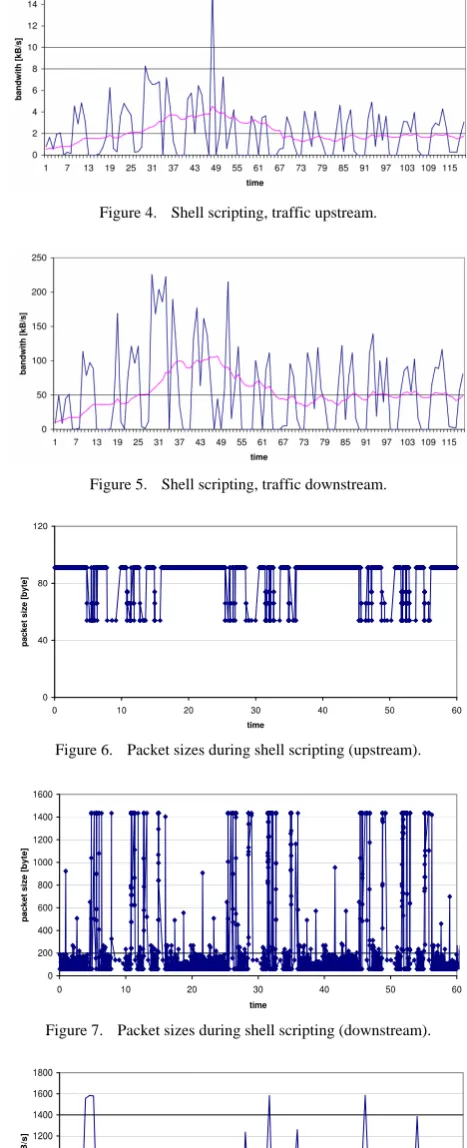
The next two graphs provide a more detailed view of scripting activity without a webcam active. Figure 4 depicts a 120 second upstream traffic trace for the script-ing activity.
The graph depicts one second measurements and 20 second moving average. Upstream traffic encodes key strokes and mouse moves. Zero traffic corresponds to periods of inactivity, e.g. waiting for screen updated. A typed command with a screen output, for example. The average rate fluctuates around 2kB/s upstream. Figure 5 depicts the traffic in the downstream direction for the same conversation.
The traffic reflects screen updates in response to user commands. The average downstream rate fluctuates around 50kB/s for this test.
The next set of graphs provides a look at the packet sizes that were encountered. Figure 6 depicts a scatter plot of corresponding packet sizes and times for the first 60 trace seconds.
As expected, upstream packets are small: 54bytes (11%), 66bytes (18%), 74bytes (4%) and 91 bytes (67%). Figure 7 depicts the same data for the upstream direction.
Packets are either 60 bytes (26%) or at the connection’s MTU of 1434 bytes (34%). Remaining packets (29%) are between 100 and 300 bytes.
The final set of graphs shows a comparison of webcam images that are transmitted as part of a RDP session and as a separate feed. Figure 8 depict a traffic trace for a webcam displayed in a browser inside a virtual machine.
The webcam is active and visible for the duration of the test. The graph depicts traffic rates for one second inter-vals and the moving average with a 20 second interval.
Figure 9 depicts the measurements, as above for a web-cam stream, in the local client browser.
The average rate is much lower. This demonstrates the large impact the video stream has in the virtual environ-ment. If the MJPG stream is transmitted separately, i.e. directly to a browser at the remote end, the traffic can be reduced considerably, in this example by a factor of 20. Displaying the MJPG stream directly at the client, limits the requirements to average rate of the actual MJPEG stream which is only 200 kbps.
These results are not surprising, but it demonstrates the advantages a direct webcam feed has for this particular application.
[image:5.595.309.540.73.178.2]This is relevant as webcams are a key feature of most physical experiments. Several measurements with limited access bandwidth demonstrate, that the impact of avail-able network bandwidth directly relates to the require-ments of the activity. The threshold requirement is at the level identified in the trace; for example depicted in Figure 3, 5000 kbps with video via RDP or approx. 200kbps with a separate video feed. If the necessary bandwidth is available, bandwidth has no impact on the usability or QoE of the activity; the critical parameter becomes latency, discussed in the following subsection. These results agree with the observations by Tolia et al. [7] and Lai and Nieh [8].
[image:5.595.303.537.84.659.2]Figure 4. Shell scripting, traffic upstream.
Figure 5. Shell scripting, traffic downstream.
[image:5.595.308.537.176.450.2]Figure 6. Packet sizes during shell scripting (upstream).
Figure 7. Packet sizes during shell scripting (downstream).
[image:5.595.313.537.617.736.2]Figure 9. Bandwidth for a RAL connected MJPEG webcam via direct HTTP, downstream traffic.
B. QoE and Latency
This section discusses the impact of variations in net-work latency. The tests were undertaken in the environ-ment dis- cussed in Section III for the Linux shell script-ing exercise. Four results are presented: the average time it took to complete the scripts for automated tests, the failure rate of automated tests, the relative changes in completion time for user-based tests and the average MOS values for user based tests.
The first graph in Figure 10 depicts objective QoU pa-rameters for the automated scripting activity. It shows duration and failure rate versus RTT, imposed by the WAN emulator.
The bars indicate 95% confidence intervals. The failure rate was calculated by identifying errors in the test script execution. If errors were detected, the test was terminated. Errors were generally caused by missed key strokes, hung keys or lost mouse clicks. Both test duration and variabil-ity of the duration are increasing with longer RTT. How-ever, there is no indication at what latency the usability of the activity is affected. The duration or variability of the automated tests does enable conclusions on usability of the activity.
Failure rate, on the other hand, shows a pronounced step change between 200ms and 300ms. Lost keys are not a real issue for human testers; however, the following tests with individuals demonstrate that the increased RTT also causes issues for human users at the same margin.
In the next step a number of human subjects undertook the scripting exercise. With each test iteration latency was increased. Figure 11 depicts the relative difference of individual results versus the RTT.
This normalisation was necessary as the test duration varied considerably for subjects, between two and ten minutes per test. For each subject the average duration of all runs and the relative difference between the test runs was calculated. For a RTT below 300ms, test duration is determined by skill and ability. The first run took the longest for most subjects, as they were not familiar with the activity. In the second and third attempt performance increased. Only one test subject was determined enough to finish the test for a RTT of 500ms. As for the automated tests, duration is not a good measure for usability of the system.
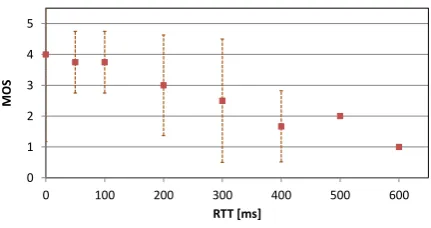
After each iteration the test subjects where asked to rate the (technical) quality of the remote access session accord-ing to their perceived impairment usaccord-ing the followaccord-ing qualifiers: Imperceptible (excellent, 5), perceptible but not annoying (good, 4), slightly annoying (fair, 3), annoying (poor, 2) and very annoying (bad, 1). Corresponding
Figure 10. Average script test duration & failure rate versus RTT for Automated tests.
0 0.5 1 1.5 2 2.5 3
0 100 200 300 400 500 600
pe
rc
e
nt
ag
e
of
av
e
ra
ge
du
ra
tion
RTT [ms]
Figure 11. Percentage of average human test duration versus Round Trip Time (RTT).
0
1
2
3
4
5
0 100 200 300 400 500 600
MO
S
RTT [ms]
Figure 12. Mean Opinion Score (MOS) versus Round Trip Time (RTT) during user tests.
quality perception and MOS scores are given in brackets. Figure 10 depicts the corresponding MOS scores and 95% confidence intervals for the tests.
These correspond closely to the failure rates in the automated tests. All test subjects did not believe that the activity was usable with RTT above 400ms: “There seems to be little difference between these last few tests, being 400, 500, and 600 ms. Seems once you hit this significant delay range, it’s all pretty much the same.” Most testers agreed that above 200ms, the activity becomes practically unusable. At 300ms lost and duplicated keys, as well as keyboard lag cause frustration. These results are inde-pendent of the access bandwidth and are particular rele-vant as it limits the geographical reach of the RAL system to Australia and close neighbours.
V. CONCLUSION
[image:6.595.308.538.71.184.2] [image:6.595.312.531.224.335.2] [image:6.595.313.529.376.490.2]Traces for webcam streams have shown that access via RDP caused traffic by a factor 20 larger then direct http access to the video stream. Streaming video within remote desktop should therefore be avoided.
Bandwidth requirements are largely experiment, i.e. activity, specific. These can be evaluated and optimised on an activity basis.
As has been reported by other studies, it has been veri-fied that RTT is the most important performance factor. Increasing RTTs lead to increased response times, which in turn result in a sluggish user experience. The overall framework for testing can be applied to other applications and results are applicable to other systems using SGD to provide thin-client or remote desktop access. The results restrict the use of interactive remote access to limited geographical region. If users are located further away, alternative options to RAL are necessary. RAL access via geostationary satellites is also not feasible due to the high latency.
The study has demonstrated duration of automated tests as well as the relative increase in duration for tests with individuals provides no measures that allow a judgment on the usability of a service or experiment. Failure rate for automated tests and the ability to successfully complete individual tests, on the other hand, are objective measures to determine if a service is fit for a purpose; the most important factor for remote experiment access.
The literal Quality of Experience, i.e. Quality of Learn-ing Experience, has not directly been discussed in this paper; however, initial results of a related study show that the learning experience is largely determined by other factors such as the quality of design and delivery of the activity. As long as an experiment or service is usable, the impact of reduced technical performance on the quality of the learning experience is minimal. The study in this paper has demonstrated that usability thresholds could be identified by both, the user based as well as the automated tests. Intuitively, failure rate and MOS values are related as lost mouse clicks and keystrokes also introduce a level of annoyance for users. Future work will investigate and model this relationship in more detail.
ACKNOWLEDGMENT
This work has been funded in part by a USQ Senior Learning and Teaching Fellowship. The authors would like to thank the test subjects for their time and feedback.
REFERENCES
[1] A. A. Kist and P. Gibbings, “Inception and management of remote access laboratory projects,” AaeE 2010: 21st Annual Conference of the Australasian Association for Engineering Education, 5-8 Dec 2010, Sydney, Australia, 2010.
[2] “Citrix systems, inc.” 2010. [Online]. Available:
[3] Microsoft, “Remote desktop protocol,” 2010. [Online]. Available:
[4] T. Richardson, Q. Stafford-Fraser, K. Wood, and A. Hopper, “Virtual network computing,” Internet Computing, IEEE, vol. 2,
no. 1, pp. 33 –38, jan/feb 1998.
[5] A. A. Kist, “A framework to evaluate performance from an application and user perspective,” 9-11November 2011 2011. [6] D. Schlosser, A. Binzenhofer, and B. Staehle, “Performance
comparison of windows-based thin-client architectures,” in Aus-tralasian Telecommunication Networks and Applications
Confer-ence, 2007. ATNAC 2007., 2-5 2007, pp. 197 –202.
[7] N. Tolia, D. Andersen, and M. Satyanarayanan, “Quantifying interactive user experience on thin clients,” Computer, vol. 39, no.
3, pp. 46 – 52, March 2006.
[8] A. M. Lai and J. Nieh, “On the performance of wide-area thin-client computing,” ACM Trans. Comput. Syst., vol. 24, no. 2, pp.
175–209, 2006.
[9] S. J. Yang, J. Nieh, and N. Novik, “Measuring thin-client per-formance using slow-motion benchmarking,” in Proceedings of the General Track: 2002 USENIX Annual Technical Conference. Berkeley, CA, USA: USENIX Association, 2001, pp. 35–49. [10] ITU-T Recommendation P.800, “Methods for subjective
determi-nation of transmission quality,” 1996. [Online]. Available:
[11] U. Schiefele and M. Csikszentmihalyi, “Interest and the quality of experience in classrooms,” European Journal of Psychology of Education, vol. 9, no. 3, pp. 251–269, 1994.
[12] ITU-T Recommendation P.10/G.100, “Amendment 2: Definitions for inclusion in recommendation itu-t p.10/g.100,” 2008. [13] P.BrooksandB.Hestnes,“Usermeasuresofqualityofexperience:why
being objective and quantitative is important,” Network, IEEE,
vol. 24, no. 2, pp. 8–13, 2010.
[14] F. Kuipers, R. Kooij, D. De Vleeschauwer, and K. Brunnstrm, Techniques for Measuring Quality of Experience, ser. Lecture Notes in Computer Science. Springer Berlin / Heidelberg, 2010, vol. 6074, pp. 216–227.
[15] I. Martinez-Yelmo, I. Seoane, and C. Guerrero, Fair Quality of Experience (QoE) Measurements Related with Networking Tech-nologies, ser. Lecture Notes in Computer Science. Springer Berlin / Heidelberg, 2010, vol. 6074, pp. 228–239.
[16] M. Fiedler, T. Hossfeld, and T.-G. Phuoc, “A generic quantitative relationship between quality of experience and quality of service,” Network, IEEE, vol. 24, no. 2, pp. 36–41, 2010.
[17] P. Reichl, B. Tuffin, and R. Schatz, “Economics of logarithmic quality-of-experience in communication networks,” in Telecom-munications Internet and Media Techno Economics (CTTE), 2010 9th Conference on, pp. 1–8.
[18] W. Wu, A. Arefin, R. Rivas, K. Nahrstedt, R. Sheppard, and Z. Yang, “Quality of experience in distributed interactive multimedia environ- ments: toward a theoretical framework,” pp. 481–490, 2009.
[19] A. A. Kist and A. P. Wandel, “Work in progress – performance evaluation of online learning tools,” Frontiers in Education 2011 Conference, October 12 - 15, Rapid City, SD, 2011.
[20] R. E. Mayer, “The promise of multimedia learning: using the same instructional design methods across different media,” Learning and Instruction, vol. 13, no. 2, pp. 125–139, 2003, doi: 10.1016/S0959- 4752(02)00016-6.
[21] S. Sambrook, “Factors influencing learners’ perceptions of the quality of computer based learning materials,” Journal of Euro-pean Industrial Training, vol. 25, no. 2/3/4, pp. 157–167, 2001, 215396195.
[22] R. Killen, Effective teaching strategies : lessons from research and practice, 5th ed. South Melbourne, Vic.: Cengage Learning, 2009, roy Killen. ill. ; Fourth edition published: South Melbourne, Vic. : Thomson Social Science Press, 2007. Includes index. Bibliogra-phy.
[23] Q. Department of Education, “Productive pedagogies: Classroom reflection manual,” 2002.
[24] S. A. Moebs, “A learner, is a learner, is a user, is a customer: Qos-based experience-aware adaptation,” pp. 1035–1038, 2008. [25]
J.Gilbert,S.Morton,andJ.Rowle,“e-learning:Thestudentexperience,” British Journal of Educational Technology, vol. 38, no. 4, pp. 560–573, 2007.
[27] S. Hemminger, “Network emulation with NetEm,” Proceedings of the 6th Australia’s National Linux Conference (LCA2005), Can-berra, Australia, April 2005.
[28] NBN Co., “NBN CO - about: Our purpose,” 2011. [Online].
Available:
AUTHORS
Alexander A. Kist is with the Faculty of Engineering and Surveying at the University of Southern Queensland,
Toowoomba, Queensland Australia (e-mail: [email protected]).
Andrew D. Maxwell, is with the Faculty of Engineer-ing and SurveyEngineer-ing at the University of Southern Queen-sland, Toowoomba, Queensland Australia (e-mail: [email protected]).